S&P 500 Index Near Key Resistance – Correction Ahead?Recently, the S&P 500 ( SP:SPX ) has seen some sharp moves with high momentum due to the tariff tensions between the US and China over the past couple of weeks. These moves have also impacted other correlated markets like cryptocurrency .
In the past day, news came out that Trump is planning to meet the Chinese president on October 31st . With markets opening, the S&P 500 started to rise and is currently moving near a Resistance zone($6,734_$6,690) and close to its Resistance lines .
From an Elliott Wave perspective, it seems that the S&P 500 is completing a microwave 5 of the main wave C , and the corrective structure looks like an Regular Flat(ABC/3-3-5) .
I expect that in the coming hours, the S&P 500 index could drop at least to around $6,641(First Target) .
Second Target: $6,611
Stop Loss(SL): $6,735
Note: The $6,641 level is quite important in the context of the recent rally and could act as both support and resistance for the S&P 500.
A possible decline or fall in the S&P 500 index could also cause Bitcoin to decline (due to Bitcoin's high correlation with the S&P 500 index in recent weeks).
Please respect each other's ideas and express them politely if you agree or disagree.
S&P 500 Index Analyze (SPX500USD), 1-hour time frame.
Be sure to follow the updated ideas.
Do not forget to put a Stop loss for your positions (For every position you want to open).
Please follow your strategy and updates; this is just my Idea, and I will gladly see your ideas in this post.
Please do not forget the ✅' like '✅ button 🙏😊 & Share it with your friends; thanks, and Trade safe.
Regularflat

Chfjpy start to look for buyFor chfjpy it is at the zone we should look for buy set up. Invalidation if the price breaks below 181.589. Target is toward 183 to 184.

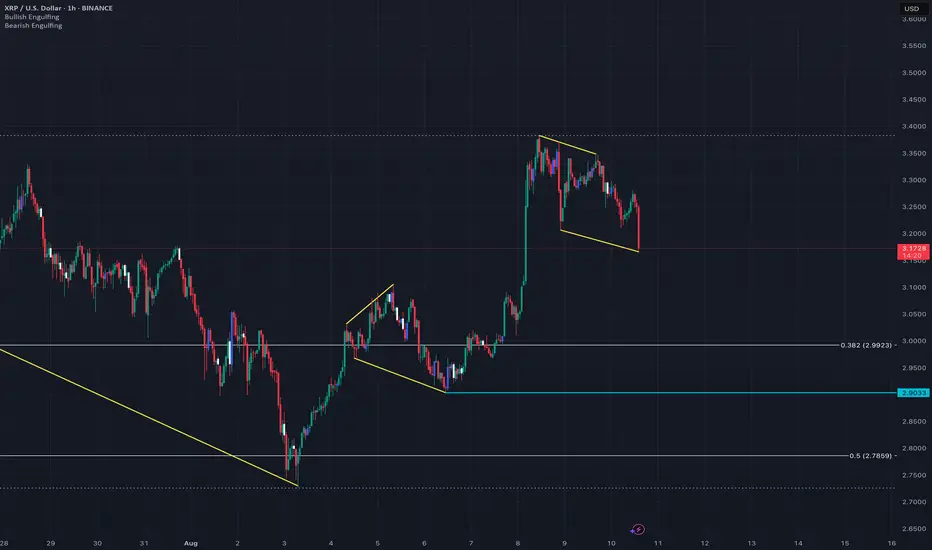
XRP Look For Buy As It Is Showing Trend Continuation PatternXrpUsd, peesonally for me it is showing trend continuation pattern per current market structure. Ideally it should not go down break below 2.9033. Look for your buy set ip before entering.
Target ideally above 3.6606 or the best case 4.1364.
Dont risk over 1% for this trade.
BTC Is Heading For At Least 120k level AgainBased on current market movement in my personal humble opinion there’s good chance for btcusd to go up again to test 120k level or the best case another ATH.
The reason behind this is we have complete correction in the form of regular flat (yellow pattern line) and based on this tf (h4) we can spot bullish engulfing price action at the end of possible wave C of the regular flat I have mentioned earlier.
The stop can be below the low pf the latest bullish engilfing candle.
Risk not more than 1%.
If it takes me out then I’ll look for another reenter below as even if the market breaks the low of the regular flat, the bias doesn’t change at all.

(1D) BTCUSD 3-3-5 REGULAR FLAT CORRECTIONTHERE'S A CHANCE BITCOIN MAY GO TO $43000. We hit my nominal target of $56000 three times now during this larger time frame correction, which started at the ATH in March. It SEEMINGLY looks like we got the 'final' bounce off the 50% retracement fib @ $49000. HOWEVER, I don't like the way she's just hanging out mid-air between trend lines. This typically gives me the indication that the move isn't over just yet. I've updated my wave counts; looks like we are dealing with a 3-3-5 REGULAR FLAT PATTERN, which may terminate around $43000 nominal, which coincides with the next available support trend line and 61.8% retracement fib. Let's see if this thesis plays out. Just a bit more pain left until we see upside impulse again towards ATH's. Be patient and hang tight! IF that support doesn't hold, we are going to mid-30K.

GBPUSD ANALYSIS Hello traders
The impulse wave for the GBPUSD is bullish and we have a regular flat correction pattern that we expect to have another bullish wave

US OIL Analysis Hello traders
We have a bullish impulse wave that broke another bearish wave, and we have a regular flat correction pattern that we expect to have another bullish wave


The potential downside of oilWave analysis
price action
order blocks
liquidity
market structure
regular flat pattern


Does US oil fall to levels of 85?There is an supply area from which the price has redistributed and now the price is retesting it correctively and we have a signal of change in direction The next target is the level of 85


GBP JPY ANALYSIS There is an increase in the buyers' momentum and there is a correction that did not break through the wall of the wave with increasing momentum The price is now in a range, if the range is broken strongly we will see a rise to further levels


HDFC! can drop in the coming DaysHello ladies and gentlemen, according to my graphical analysis Of The HDFC BANK stock , there is a high probability of drop level in the coming days.

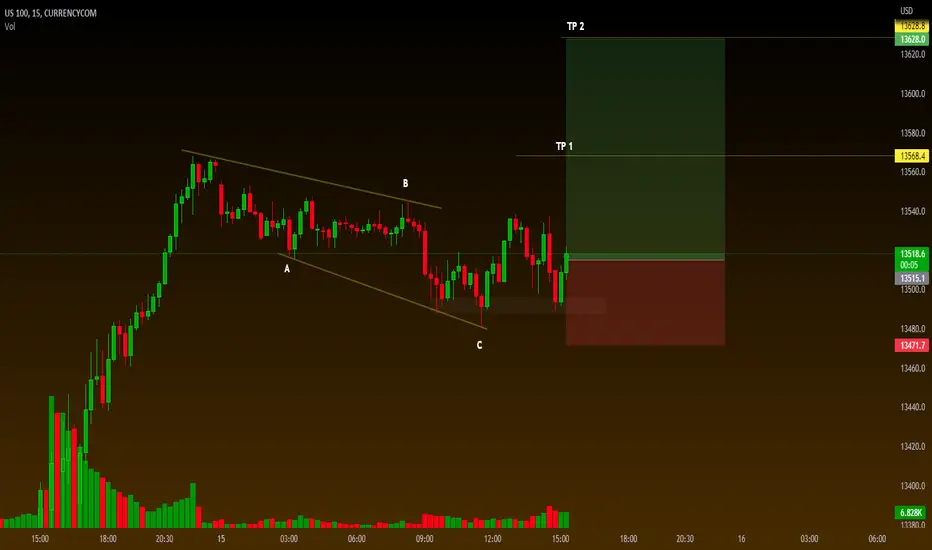
BTC search for momentum increase in 15 min chart hello,
BTC/USDT
Regular flat elliott wave, if the momentum increased in 15 min chart. that is the main condition
Regular flat targets (24700 - 25400)
Fail if the momentum is lacking.
Not Financial Advice
DYOR
