View on RelianceLook like reliance is completed 5 wave and now in correction mode. Depth of correction is at 989 but its look like flat correction(5-3-5).
Note:- This is only for education purpose.
RELIANCE

RELIANCE Unleashed | Bulls Roaring StrongThis is the daily timeframe chart of Reliance.
Reliance is moving in a strong momentum phase and is consistently respecting the Supertrend indicator.
Based on Supertrend, the key support level is at 1518.
Currently, the stock is trading above multi-timeframe pivot levels, indicating short-term momentum strength.
Buying opportunities may be considered near the 1530–1540 range.
The stock has a strong support zone around 1515–1520.
Potential upside target is near 1620.
If the support zone sustains, we may see higher prices in Reliance in the coming sessions.
Thank you.

Reliance Industries Limited for 10th Dec #RELIANCE Reliance Industries Limited for 10th Dec #RELIANCE
Resistance 1540 Watching above 1543 for upside momentum.
Support area 1515-1520 Below 1520 gnoring upside momentum for intraday
Watching below 1513 for downside movement...
Above 1540 ignoring downside move for intraday
Charts for Educational purposes only.
Please follow strict stop loss and risk reward if you follow the level.
Thanks,
V Trade Point

Reliance Looking Good...Buy REL at current level and all dips
Target1 - 3000
Target2 - 3200
Target3 - 3627 (if close above 3210)
Disclaimer :-
I am not SEBI registered. The information provided here is for education purposes only.
I will not be responsible for any of your profit/loss with this channel suggestions.
Consult your financial advisor before taking any decisions

RIL: Navigating Key Supply & Demand Zones for Future MovementIntroduction:
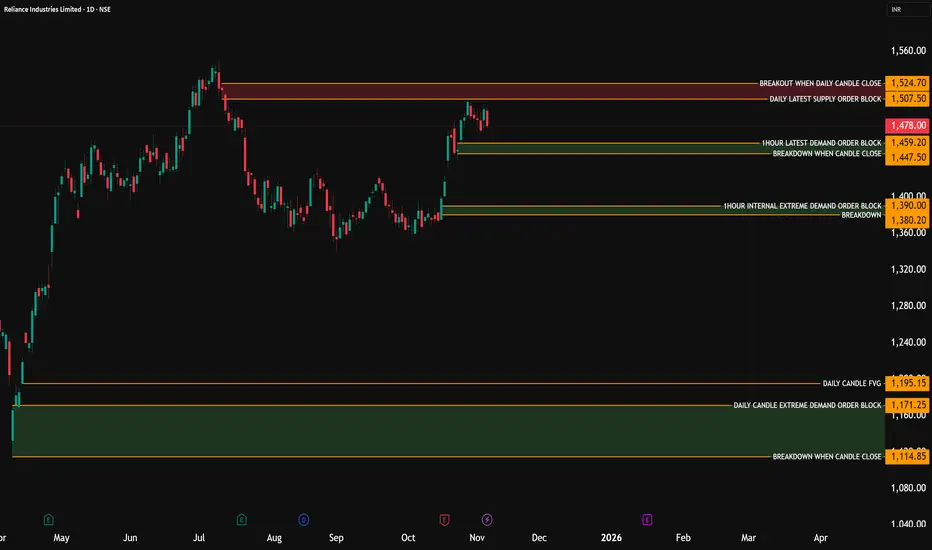
This analysis focuses on the daily chart of Reliance Industries (RIL), highlighting critical supply and demand zones that are likely to dictate its price action in the coming weeks and months. We observe a recent uptrend followed by a pullback, and the current price action is situated at crucial junctures.
Key Observations & Zones:
Daily Latest Supply Order Block (Resistance):
Zone: 1,507.50 - 1,524.70 (highlighted in red)
Significance: This is a formidable resistance area. A daily candle closing above 1,524.70 would signal a strong bullish breakout, potentially targeting higher price levels. Until then, this zone acts as a ceiling, where sellers have historically stepped in. We've seen a recent rejection from this area, confirming its strength.
1-Hour Latest Demand Order Block (Immediate Support):
Zone: 1,447.50 - 1,459.20 (highlighted in yellow)
Significance: This is the immediate support zone identified from a lower timeframe (1-hour chart). For bulls to maintain control in the short term, RIL needs to hold above 1,447.50. A breakdown below this level could trigger further downside pressure.
1-Hour Internal Extreme Demand Order Block (Strong Support):
Zone: 1,360.00 - 1,390.00 (highlighted in green)
Significance: This represents a much stronger demand zone, likely to attract significant buying interest if the price reaches it. This is a key area for potential reversals or strong bounces. A breakdown below 1,360.00 would be a significant bearish development, suggesting a deeper correction.
Daily Candle Extreme Demand Order Block (Long-Term Support):
Zone: 1,160.00 - 1,195.15 (highlighted in a broader green box)
Significance: This is a crucial long-term demand zone. If RIL experiences a substantial correction, this area is expected to provide very strong support. A daily candle close below 1,114.85 (the lowest yellow line beneath this zone) would invalidate this demand and indicate a major shift in the long-term trend.
Current Price Action & Outlook:
RIL is currently trading within the proximity of the 1-hour latest demand order block. The stock is attempting to find support here after being rejected from the daily supply zone.
Potential Scenarios:
Bullish Scenario: A strong bounce from the current levels or the 1-hour internal extreme demand order block (1,360-1,390), followed by a decisive daily close above 1,524.70, would confirm renewed bullish momentum.
Bearish Scenario: A daily close below 1,447.50 could lead to a test of the 1-hour internal extreme demand order block. A breakdown below 1,360.00 would open the doors for a deeper correction towards the long-term daily candle extreme demand order block.
Conclusion:
RIL is at a critical juncture. Traders should closely monitor how the price reacts to these identified supply and demand zones. The levels of 1,524.70 on the upside and 1,447.50 (short-term) / 1,360.00 (medium-term) on the downside will be pivotal in determining its near to medium-term trajectory.
RELIANCE Industries Ltd for 30th Oct #RELIANCERELIANCE Industries Ltd for 30th Oct #RELIANCE
Resistance 1510 Watching above 1513 for upside momentum.
Support area 1490 Below 1500 gnoring upside momentum for intraday
Watching below 1487 for downside movement...
Above 1500 ignoring downside move for intraday
Charts for Educational purposes only.
Please follow strict stop loss and risk reward if you follow the level.
Thanks,
V Trade Point

RELIANCE — The MONSTER WAVE 3 Isn’t Over Yet!📈 Summary:
Reliance isn’t done yet — the structure shows a powerful Wave 3 still unfolding with institutional strength behind it.
Expect a controlled Wave 4 retracement (₹800–₹500) before the next super rally — Wave 5 toward ₹10,000 (3.618%) .
📈 Elliott Wave count + SMC + Fundamentals all scream continuation!
Smart money is accumulating , not distributing — this is the calm before the storm.
🔥 Wave 3 builds wealth. Wave 5 creates history.
📊 Elliott Wave Confluence:
The stock remains within Wave 3 , unfolding with strong impulsive momentum and clean internal sub-waves.
Wave 3 is expected to mature around the 2.618 extension (~₹2,875) , but structure still supports further upside before exhaustion.
A Wave 4 correction will likely retrace toward the 0.382–0.5 Fib zone (₹800–₹500) , forming a deep yet healthy reset.
The grand finale — Wave 5 — targets the 3.618 Fibonacci extension (~₹10,000) , aligning with long-term macro growth and structural expansion. 🚀
💰 Smart Money Concept (SMC) Insight:
Institutional order flow remains bullishly displaced — no evidence of full distribution yet.
Expect Wave 4 to be the “smart money re-entry zone,” with liquidity sweeps and accumulation before the final push.
Wave 5 could trigger the euphoric phase where late retail chases and institutions start scaling out at premium valuations. 🧠💵
📈 Price Action Perspective:
Trend remains structurally bullish — higher highs and higher lows dominate.
A break above ₹1,600–₹1,700 confirms Wave 3 continuation.
Once the market consolidates into Wave 4, watch for equal lows, demand absorption, and BOS confirmations to catch early Wave 5 entries.
Wave 5 is expected to be sharp, emotional, and momentum-driven — classic of late-cycle impulsive waves. ⚙️📊
🌍 Fundamental Confluence:
Reliance’s expansion across energy, telecom, AI, green tech, and retail supports this wave count perfectly.
The next decade’s growth catalysts — digital ecosystem scale-up, Jio financial inclusion, and renewables — align with Wave 5’s “valuation explosion” narrative.
Fundamentals mirror Elliott psychology: Wave 3 = justified growth, Wave 4 = consolidation, Wave 5 = euphoria-driven expansion . 💹🌏
🔮 Expectations Ahead:
📍 Wave 3 Target: ₹2,800–₹3,000 range (2.618 fib).
⚠️ Wave 4 Retracement: ₹800–₹500 (accumulation & re-entry zone).
🚀 Wave 5 Target: ₹10,000 (3.618 extension — the ultimate cycle peak).
💎 Final Thought:
Reliance is still in the driver’s seat of its Wave 3.
Wave 4 will give patient bulls one final golden entry before Wave 5 — the ₹10,000 super cycle — rewrites market history.
Traders & Analysts
"This might be the mega move of the decade — and it’s happening right in front of us. 🔥
Reliance (RELIANCEIND) is still charging through a powerful Wave 3, and there’s plenty of air above before any major correction even begins. 🚀
Our Elliott Wave models show Wave 3 has not peaked yet — momentum, structure, and institutional flow all confirm that the current rally could still extend toward the ₹2,800–₹3,000 zone before any Wave 4 cooldown.
But here’s the big picture: after Wave 4’s healthy reset, the final Wave 5 explosion could drive prices to a massive ₹10,000 target (3.618 extension) — a potential super-cycle top years in the making. 💎
📈 Smart money isn’t exiting — it’s riding Wave 3 and preparing for the ultimate Wave 5 payoff.
Timing this phase could define your decade in trading. ⚡
So, traders — how far do you think Wave 3 can run before the big reset?
Drop your targets below 👇 and let’s see who rides this wave all the way to ₹10,000! 💰🌊”
— Team FIBCOS
#Reliance #ElliottWave #NSE #SmartMoney #PriceAction #WaveTheory #TechnicalAnalysis #TradingView #Investing #StockMarketIndia #RelianceIndustries #SwingTrading #LongTermInvesting #Wave3 #Wave5 #BullishIndia #ChartAnalysis #WealthBuilding #MarketStructure #Fibonacci #Wave4Accumulation

Reliance Industries Ltd for 23rd Oct #RELIANCE Reliance Industries Ltd for 23rd Oct #RELIANCE
Resistance 1470-1475 Watching above 1476 for upside momentum.
Support area 1450 Below 1450 gnoring upside momentum for intraday
Watching below 1448 for downside movement...
Above 1470 ignoring downside move for intraday
Charts for Educational purposes only.
Please follow strict stop loss and risk reward if you follow the level.
Thanks,
V Trade Point

Reliance Industries Ltd for 17th Oct #RELIANCEReliance Industries Ltd for 17th Oct #RELIANCE
Resistance 1400 Watching above 1404 for upside momentum.
Support area 1380 Below 1380 gnoring upside momentum for intraday
Watching below 1377 for downside movement...
Above 1400 ignoring downside move for intraday
Charts for Educational purposes only.
Please follow strict stop loss and risk reward if you follow the level.
Thanks,
V Trade Point

Reliance Industries Ltd for 16th Oct #RELIANCEReliance Industries Ltd for 16th Oct #RELIANCE
Resistance 1390 Watching above 1393 for upside momentum.
Support area 1365 Below 1380 gnoring upside momentum for intraday
Watching below 1364 for downside movement...
Above 1380 ignoring downside move for intraday
Charts for Educational purposes only.
Please follow strict stop loss and risk reward if you follow the level.
Thanks,
V Trade Point

Reliance Industries Ltd for 15th Oct #RELIANCEReliance Industries Ltd for 15th Oct #RELIANCE
Resistance 1390 Watching above 1393 for upside momentum.
Support area 1365 Below 1380 gnoring upside momentum for intraday
Watching below 1364 for downside movement...
Above 1380 ignoring downside move for intraday
Charts for Educational purposes only.
Please follow strict stop loss and risk reward if you follow the level.
Thanks,
V Trade Point

Reliance Industries Ltd for 14th Oct #RELIANCEReliance Industries Ltd for 14th Oct #RELIANCE
Resistance 1390 Watching above 1393 for upside momentum.
Support area 1365 Below 1380 gnoring upside momentum for intraday
Watching below 1364 for downside movement...
Above 1380 ignoring downside move for intraday
Charts for Educational purposes only.
Please follow strict stop loss and risk reward if you follow the level.
Thanks,
V Trade Point

Reliance Industries Ltd for 13th Oct #RELIANCE Reliance Industries Ltd for 13th Oct #RELIANCE
Resistance 1390 Watching above 1393 for upside momentum.
Support area 1365 Below 1380 gnoring upside momentum for intraday
Watching below 1364 for downside movement...
Above 1380 ignoring downside move for intraday
Charts for Educational purposes only.
Please follow strict stop loss and risk reward if you follow the level.
Thanks,
V Trade Point

Reliance Industries Ltd for 7th Oct #RELIANCE Reliance Industries Ltd for 7th Oct #RELIANCE
Resistance 1380-1383 Watching above 1384 for upside momentum.
Support area 1365 Below 1365 gnoring upside momentum for intraday
Watching below 1364 for downside movement...
Above 1380 ignoring downside move for intraday
Charts for Educational purposes only.
Please follow strict stop loss and risk reward if you follow the level.
Thanks,
V Trade Point

Reliance Industries Ltd for 18th Sept #RELIANCE Reliance Industries Ltd for 18th Sept #RELIANCE
Resistance 1420 Watching above 1422 for upside momentum.
Support area 1400 Below 1400 gnoring upside momentum for intraday
Watching below 1397 for downside movement...
Above 1420 ignoring downside move for intraday
Charts for Educational purposes only.
Please follow strict stop loss and risk reward if you follow the level.
Thanks,
V Trade Point

COIN 1D Time frameMarket Snapshot
Current Price: ~$318.78
Daily Change: +5.5% (strong upward move)
🔎 Technical Indicators
RSI (14-day): ~71 → Overbought zone, signals caution.
MACD: Positive and rising → Strong bullish momentum.
Stochastic Oscillator: High → Overbought conditions, risk of short-term pullback.
ADX: ~16 → Weak trend strength despite recent move.
📈 Moving Averages
5-day MA: ~$315 → Bullish
50-day MA: ~$305 → Bullish
200-day MA: ~$314 → Bullish
All three show buy signals, confirming trend strength.
🔧 Support & Resistance
Support Levels: ~$315, ~$313, ~$311
Resistance Levels: ~$319, ~$321, ~$330
📅 Outlook
Bullish Case: If COIN sustains above ~$319, it could push toward $330 or higher.
Bearish Case: With RSI in overbought territory, a pullback toward ~$315–311 is possible.
Overall Bias: Moderately bullish, but vulnerable to short-term profit-taking.

BTCUSDT 2Hour Time frameBTC/USDT 2-Hour Snapshot
Current Price: $112,349.00
Change: -0.29% from the previous close
Intraday High: $112,891.00
Intraday Low: $110,812.00
🔎 Technical Indicators
Relative Strength Index (RSI): Neutral
Moving Averages:
7-period MA: $112,376 (short-term support)
25-period MA: $111,484 (medium-term support)
99-period MA: $113,049 (short-term resistance)
📈 Market Sentiment
Pivot Points:
Resistance: $113,650
Support: $108,666
📅 Outlook
Bullish Scenario: A breakout above $113,650 could signal a move toward $120,000.
Bearish Scenario: A drop below $108,666 may lead to further downside.
Overall Bias: Neutral, with mixed signals from moving averages and momentum indicators.

AMZN 45Minutes Time frameAMZN 45-Minute Snapshot
Current Price: $238.24 USD
Change: +1.02% from the previous close
Intraday Range: $235.08 – $238.85 USD
52-Week Range: $161.38 – $242.52 USD
🔎 Technical Indicators
RSI (14): 67.1 — Neutral to slightly overbought
MACD: 1.88 — Bullish momentum
Moving Averages:
5-period SMA: $237.61 — Buy signal
10-period SMA: $236.92 — Buy signal
20-period SMA: $235.59 — Buy signal
50-period SMA: $231.42 — Buy signal
📈 Market Sentiment
Pivot Points:
R1: $238.90
R2: $239.43
R3: $240.13
S1: $236.97
S2: $237.67
S3: $238.20
📅 Outlook
Bullish Scenario: A breakout above $238.90 could lead to a push toward $239.43 and higher.
Bearish Scenario: A drop below $236.97 may test support around $235.59.
Overall Bias: Neutral to slightly bullish, with positive momentum but facing near-term resistance.

META 45Minutes Time frameMETA 45-Minute Snapshot
Current Price: $765.70 USD
Change: +1.81% from the previous close
Market Cap: $1.86 Trillion
P/E Ratio: 25.95
EPS: $27.56
Intraday High: Not available
Intraday Low: Not available
🔎 Technical Indicators
RSI (14): Neutral
MACD: Neutral
Moving Averages:
5-period SMA: Not available
10-period SMA: Not available
20-period SMA: Not available
50-period SMA: Not available
📈 Market Sentiment
Pivot Points:
R1: Not available
R2: Not available
R3: Not available
S1: Not available
S2: Not available
S3: Not available
📅 Outlook
Bullish Scenario: A breakout above the current price could lead to further gains.
Bearish Scenario: A drop below the current price may test support levels.
Overall Bias: Neutral, with mixed signals from moving averages and momentum indicators.

SPX 3Hour Time frameSPX 3-Hour Snapshot
Current Price: 6,512.62 USD
Change: +0.21% from the previous close
Recent High: 6,508.23 USD (August 28, 2025)
Recent Low: 5,500.00 USD (March 13, 2025)
🔎 Technical Indicators
RSI (14): Neutral
MACD: Bullish momentum
Moving Averages:
5-period SMA: Buy signal
10-period SMA: Buy signal
20-period SMA: Buy signal
50-period SMA: Buy signal
📈 Market Sentiment
Golden Cross: The S&P 500 recently formed a "golden cross," where the 50-day moving average crossed above the 200-day moving average, indicating a bullish trend.
Business Insider
Analyst Outlook: Barclays raised its 2025 year-end S&P 500 target to 6,450, citing stronger-than-expected corporate earnings and optimism around artificial intelligence.
Reuters
📅 Outlook
Bullish Scenario: A breakout above 6,508.23 USD could lead to a push toward 6,600 USD and higher.
Bearish Scenario: A drop below 6,400 USD may test support around 6,200 USD.
Overall Bias: Moderately bullish, with positive momentum but facing near-term resistance.

COIN 3Hour Time frame📊 COIN 3-Hour Snapshot
Current Price: $318.78
Change: +5.49% from the previous close
Intraday Range: Not specified
Market Cap: Approximately $83.3 billion
P/E Ratio: Not specified
Beta: 2.89
🔎 Key Levels
Resistance:
R1: $318.78 (recent high)
R2: $330.00 (next resistance zone)
Support:
S1: $310.00 (immediate support)
S2: $300.00 (next support level)
📈 Technical Indicators
RSI (14): Not specified
MACD: Not specified
Moving Averages:
5-period SMA: Not specified
50-period SMA: Not specified
200-period SMA: Not specified
📌 Market Sentiment
Catalysts: Positive momentum following recent gains and analyst upgrades.
Sector Performance: Cryptocurrency market showing strength, with Coinbase leading gains among peers.
Options Activity: Significant trading in call options at $318.78 strike price, indicating bullish sentiment.
📅 Outlook
Bullish Scenario: A breakout above $318.78 could lead to a push toward $330.00 and higher.
Bearish Scenario: A drop below $310.00 may test support around $300.00.
Overall Bias: Moderately bullish, with positive momentum but facing near-term resistance.

RELIANCE 1D Time frame Reliance Industries (RELIANCE)
Current Price: ₹1,380.10
Change: +0.28% from the previous close
Intraday Range: ₹1,375.50 – ₹1,381.20
Volume: 9,753,126 shares traded
Market Cap: ₹18.67 trillion
P/E Ratio: 25.10
EPS (TTM): ₹60.23
Dividend Yield: 0.40%
Beta: 0.88 (indicating lower volatility relative to the market)
🔎 Key Levels
Resistance:
R1: ₹1,385.00 (recent high)
R2: ₹1,400.00 (psychological level)
R3: ₹1,420.00 (next resistance zone)
Support:
S1: ₹1,375.50 (immediate support)
S2: ₹1,360.00 (next support level)
S3: ₹1,350.00 (longer-term support)
📈 Technical Indicators
RSI (14): 58.21 — Neutral to slightly bullish
MACD: 2.15 — Positive momentum
Moving Averages:
5-day SMA: ₹1,373.00 — Buy signal
50-day SMA: ₹1,350.00 — Buy signal
200-day SMA: ₹1,300.00 — Buy signal
Stochastic Oscillator: 75.00 — Overbought, indicating potential for a pullback
📌 Market Sentiment
Catalysts: Positive momentum following recent gains and analyst upgrades.
Sector Performance: Oil & Gas sector showing strength, with Reliance leading gains among peers.
Options Activity: Significant trading in call options at ₹1,400 strike price, indicating bullish sentiment.
📅 Outlook
Bullish Scenario: A breakout above ₹1,385.00 could lead to a push toward ₹1,400.00 and higher.
Bearish Scenario: A drop below ₹1,375.50 may test support around ₹1,360.00.
Overall Bias: Moderately bullish, with positive momentum but facing near-term resistance.

PLTR 1D Time frame📊 Palantir (PLTR) Daily Snapshot
Current Price: $162.36
Change: +4.01% from the previous close
Intraday Range: $156.37 – $162.75
Volume: 59,300,483 shares traded
🔎 Key Levels
Resistance:
R1: $162.75 (recent high)
R2: $165.00 (psychological level)
R3: $170.00 (next resistance zone)
Support:
S1: $156.37 (recent low)
S2: $150.00 (psychological support)
S3: $145.00 (next support zone)
📈 Technical Indicators
RSI (14): 67.41 — Neutral to slightly bullish
MACD: 1.51 — Positive momentum
Moving Averages:
5-day SMA: $157.25 — Buy signal
50-day SMA: $145.00 — Buy signal
200-day SMA: $130.00 — Buy signal
Stochastic Oscillator: 77.32 — Overbought
ADX (14): 44.32 — Strong trend strength
📌 Market Sentiment
Catalysts: Positive momentum following recent gains and analyst upgrades.
Sector Performance: AI and data analytics sectors showing strength, with Palantir leading gains among peers.
📅 Outlook
Bullish Scenario: A breakout above $162.75 could lead to a push toward $170.00.
Bearish Scenario: A drop below $156.37 may test support around $150.00.
Overall Bias: Moderately bullish, with positive momentum but facing near-term resistance.
