already price is at ATH, so wait for breakout!reliance is now debt free, that's is the reason for this rocket move, so price is already so high so wait for more confirmations, ike breakout, volume etc
Relianceindustries

reliance industries ltd.ril making higher highs, now 52 on week high, after resisting from 1865 the price made a strong support at 1800, our new targets are shown in the chart, wait for breakout retest.

Reliance Looking Very Good Ahead of AGM - 1850 Levels Possible1. There was lot of accumulation happened in the zone of 1710-1720
2. After that base shifted towards 1735-1740
3. In last week, Reliance played important role to push Nifty higher. So when nifty will consolidate, Reliance too.
4. On Intel's investment it is trading at 1800 levels.
But I still believe this not good zone to enter. In order to touch 1850, it has to make base on 1760-1780. So I will wait for the 1760-1765 levels. This is very good entry point. We may expect this zone in upcoming 2-3 trading sessions. 1750 levels are good to watch because it may falls to 1735 level if it breaks 1750 in intra day. Then it will be a very very good opportunity to swing trade
I am looking at target of 1840-1850 till Reliance AGM which is on 15th July. This is completely event specific trade.

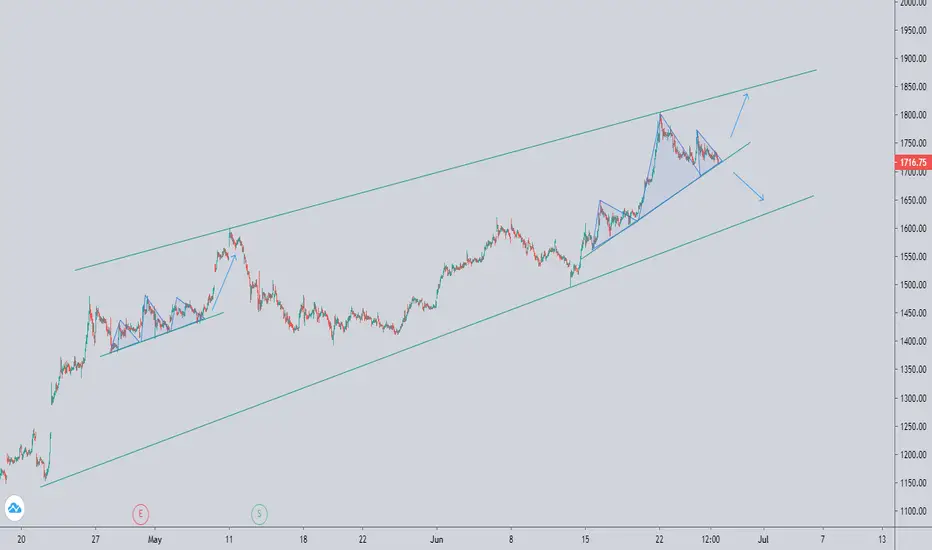
long term chart!reliance is a at ATH, now stock is consolidating, if good volume came then it may give breakkout, if volume missing then chances are price will come down.

reliance industries ltd. making bullish tringlereliance is in very clean bullish triangle pattern wait for breakout

#Reliance.... All trading levels u need to know.....
CMP (Last Close) : 1741.65
Totally in uptrend...
Every downfall towards 1717 bounce back zone for targets 1759 / 1788 / 1805 /1846 +.
Brakout below 1702 targets of 1692 / 1684 not ruled out......
this is an update to teh idea alreay publised below...
Like Share Follow........... Lets make wealth together

chart looking good, wait for the clear direction.reliance is already at ATH. on bigger time frame, price consolidating, if you are able to catch breakout, you can make good bucks.

reliance 2000 price soon...reliance 2000 price soon...
please like/share/comments if I am right as my reliance chart analysis.

Reliance ..... Marching..... towards....Reliance heading to 1840+++++
Base case 1660 -1600 good support....

Reliance Ascending Triangle Breakout We discuss about daily breakout in last chart and we have that daily breakout now price going above.
Target overall done with reliance debt free .. more to come

RELIANCE (Daily futures chart) : SHORTRecently the price have made a new all time high. Now all the news has factored in the price of stock. OI at 1700CE is increasing which acts as a resistance level for stock. Price has also made a Short hook setup at top with RSI in over bought levels. We can short the stock when we get the opportunity at right price. Maintain strict SL

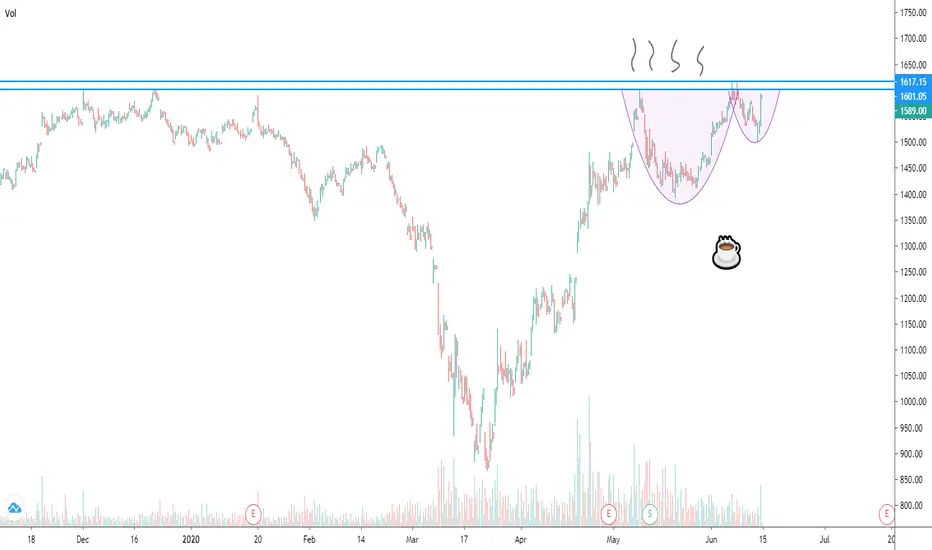
Reliance Breakout -Cup and handle formation Target for 1700-1800 levels
support at 1470-1500 level
wait for 3% min penetration
Hope you like it . Please like and share

RELIANCE IND. Near to Its strong Resistance LevelsReliance have a strong Resistance level at 1600-1620 levels. Every time it reach those levels and correct from there. All positive news of various instruments have already been there in price and there are chances of some profit booking & Pullback. Inspite of rise in RELIANCE there has NO SIGNS OF UNWINDING IN 1600CE, which indicates that there can be correction in price.

RELIANCE | Very BullishReliance Industries has raised more than 100,000 Crore Rupees in the past 6 weeks, significantly reducing their net debt.
- This is a good sign, showing institutional investors' interest and belief in the company.
- Fundamentals aside, technically the price action seems to be breaking out of a Inverse head& Shoulder, along with a cup and handle pattern, Only adding to the bullishness of the stock.
-MACD also is converging to form a bullish crossover on the 4H chart.
- Reliance is a very big player in the Telco sector in one of the most populated countries in the world, showing their profit margin capabilities.
I'm very bullish on this stock in the long term and i expect positive price action to follow up this week.

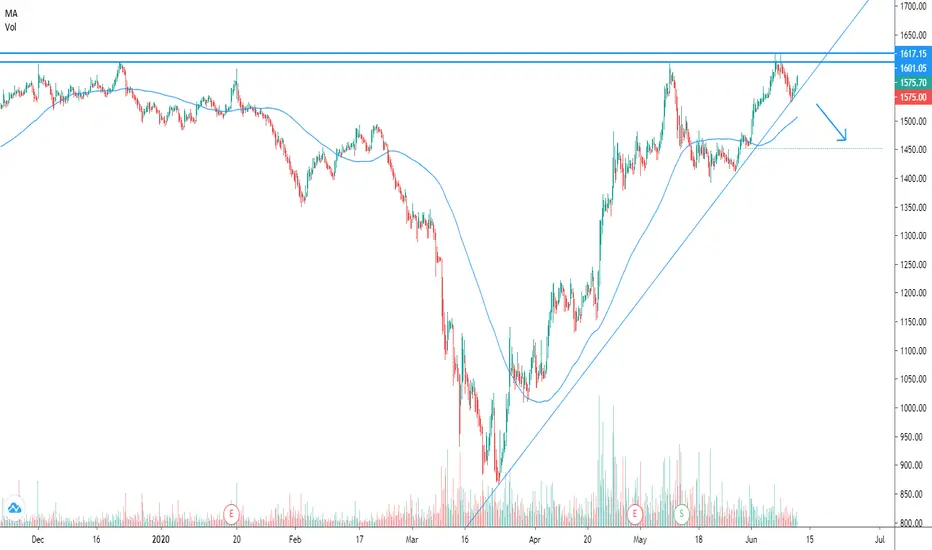
Will reliance break ATH?Reliance after getting huge foreign investments also failed to break high of 1620, and still is trading below the long term bullish trend as you an ins the chart trading below diagonal line, this shows the bearishness of Reliance. Once can short reliance as per the targets mentioned in the charts . Longs only above All time high of 1620.

RELIANCE - Gap up or gap down ?Opening above 1600 can take stock to 1650 levels.
Opening below 1570 can take stock to 1540-1530 levels.
Flat opening can make stock trade sideways in between 1600- 1570 levels.

cup and handle ☕ is a bullish pattern but in this kind of marketbe cautious, before making any decision. wait for the clear direction.
Reliance Price in Ascending Triangleprice in ascending triangle ready to break above
wait for market to open and than we will take trade at retest
if resistance isn't break than it can touch the support again.

for breakout, reliance need significant volume!but if volume lack, and reliance respect resistance then price can slip to 1450. also check his option chain data, you will notice something interesting.

RELIANCE - holds good support @1540 levelsReliance has good support near 1540 levels and and there is a probability of shark pattern , whose support levels also aligned with price support@1540
Hence , i am expecting stock would most likely bounce from there and retest its recent highs around 1600 levels.
So its a temporary long trade
Trade type - Risky - only for pro traders
I am bullish on the stock only above 1650, till then stock can trade in between 1620 - 1540-1520 range.

Reliance Industries retracement levels1437 is the first important retracement level after the recent profit booking
Do share this with others if you agree and like this.
