Renko

EURJPY Renko guard In the last days the price has remained in a range, therefore it is very difficult to be able to predict an entry, Personally I think that the price will continue to rise, since it is in a trend up for a long time. And lately there was a cut in the small downtrend.
Black lines are supports and resistance drawn on the basis of only the price (Renko)

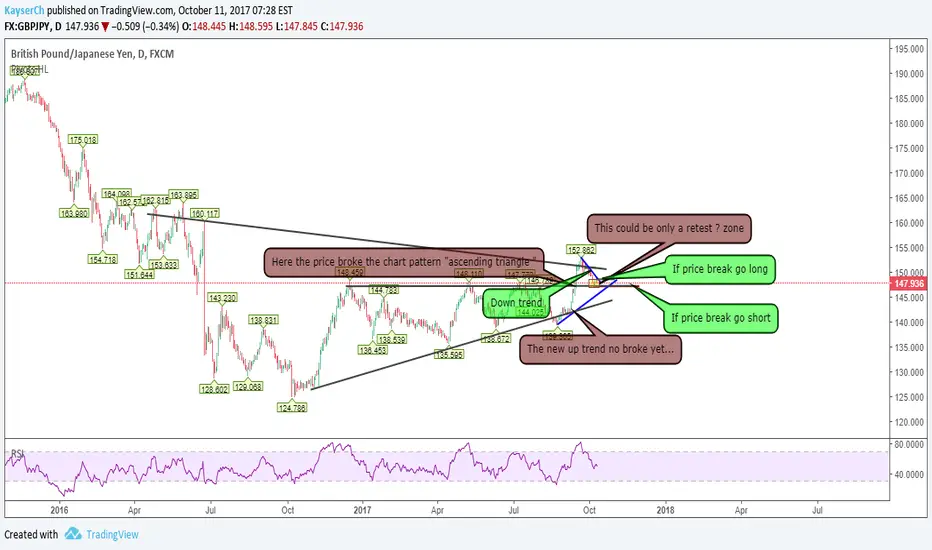
GBPJPY ; smartWhy short ?
1) The price is at the maximum from "brexit", I know you're smart to know what it means.
2) GBPUSD going down
3) Finsh last up wave .
You should not leave aside the economic calendar, to be efficient :)

Why Renko ? 1) The chart consists of blocks (a.k.a. bricks) which are the same size. These blocks can be bearish and bullish as in a standard bar or candlestick chart.
2) Renko chart does not take time into consideration so, if the Renko chart is set to (10), this means that the next block would not be formed until the price action creates an increase or a decrease of at least ten pips. The block could be formed in a second, a minute, a day or a week
U gonna say , but why renko ?
1) Ability to Spot Trends Quickly
2) Ideal for Support and Resistance Trading
3) Easy-to-Find Chart Patterns
Last days i upload different analysis with renko , be careful because it could take a long loooooong time to give a result.
The following days, upload graphs (D) with traditional renko (5 pips ) and renko ATR ( 40-80 pips or more )
Renko its very beautiful <3 I love renko . Now u could love too LOL


GBPCHF Renko Price broke down trend , the horizontal line is an important resistance , A bullish trend could form


AUDUSD Renko 1) 4 years down trend end.
2) Probably the wave is running out.
3) Probably the price is approaching a point of reverse.( look fibo 0.38) good resistence zone too.
New up trend ? we dont know xD , possible 0.81 December U.u ithink :)

USDCHF Renko Why short ?
1) Up tren finish
2) Down trend strat lol xD
3) I think price gonna test last time fibo 0.23 and later go down
4) If you like extreme u coulg go last pips of this wave log ( better wait 0.23 fibo area )

USDCAD Renko 1) Down trend
2) divergence
3) IV wave complete fibo .23
You should not leave aside the weekly economic calendar, to be efficient


Possible scenarioWhy "long " ?
1) In the last two years the price has been in a range, but all change in last months , the price has increased strongly broke the resistance .
2) Last week we can see a new HH and (LH?), if we see the green line we can assimilate the price is in posisible up trend .
You should not leave aside the weekly economic calendar, to be efficient :)

Ford to move higher after rally from recent hurricanesRecently, I have been trading auto manufactures, steel and home building materials. We've looked at GM and LPX. They received a boost from the September hurricanes. Here's another one, Ford.
We see a rally and higher high on heavier volume yesterday. RSI is showing good strength. Looking at its Renko chart, there appears to be price resistance at 12.64.
News of higher profits coming off of the hurricanes caused a significant gap up in price. Expect that gap to fill and the price to fall to 12.09. This is going to be my buy point with a short-term target of 12.64, a 4.6% increase. My stop would be at around 11.86.
For now, I'm on the sidelines...
Here's the renko chart I used for finding s/r levels:
Happy trading!

LPX to fall 9% over next weekAside from the expected strong Q4 earnings, due to the hurricaines, we should see LPX fall 9% to 25.11.
This current rally isn't doing well, showing a small 3-day consolidation, ATR oscillator confirms a weakening in range after a strong move (range strengthened) down. RSI found support at around 51, this is rather bullish, however price action gives too many indications of weakness on this rally.
We could be on an "a" correction wave and have just completed a 5-wave cycle. Note that on 7/18, there was a longer than usual correction, lasting more than a month and pushed the RSI below 50, bearish. Corrections have become smaller and smaller, this is unhealthy price action for a trend. More and more people are holding, there's no healthy selling. If there is no selling, the price can't move higher.
Also setting up for a correction on its monthly chart, as well
Take a look at this daily Renko chart for S/R and the trendline


RENKO STRATEGYLong on ema and macd. Sell on the first red renko brick.
Short on ema and macd. Buy on the first green renko brick.

Alvo conservador a vista.Assim que o suporte for rompido, entrar vendido com o alvo mínimo a base do triangulo.

Continuação da queda.Aguardar os próximos dois bricks , se um pelo menos um preto abrir abaixo da média azul, entrar vendido.

GER30 SHORT RENKO CHARTFollowing latest reports from French Presidential Elections
Current situation with North Korea
Brexit, Possible Frexit...
Both DAX and CAC are at highs and looking for reversal for longterm downtrend

A Way to Use Renko Bars as a Filter to TradesWith some careful back-testing (fitting), renko can help us to be on the right side of trades, acting as a useful filter for signals both on longer and shorter time-frames.


