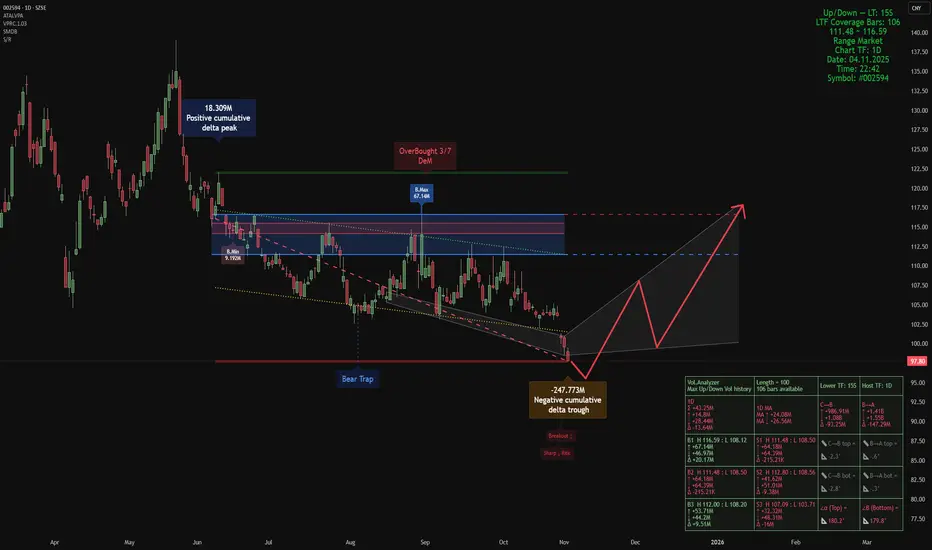
Smart Money Composite View — BYD Company Limited Class ASmart Money Composite View — #002594 (1D), BYD Company Limited Class A
Indicators used:
• Smart Money Support/Resistance
• Smart Money Dynamics Blocks (Pearson Matrix)
• ATAI •Volume Pressure Analyzer v1.2 — Pure Up/Down (Editorial Pick)
We fuse these three into a single composite read. With offset = 48, the setup highlights where price sits relative to smart-money demand/supply, how liquidity is being absorbed, and where momentum can re-emerge.
Market read (composite)
• Price is trading below the 112–118 supply block, which currently acts as the dominant resistance. The failed attempts into this band and the overhead “OverBought” tag mark it as the active sell wall.
• The current swing printed a large negative cumulative delta trough (~-247.8M) right at the lower reaction zone (bear-trap baseline + descending structure). That’s classic absorption of aggressive selling rather than fresh distribution.
• Wing geometry is near-flat (α≈180° / β≈179.8°), signalling compression: momentum has bled off while liquidity rotates. This is typically the pause before a directional decision.
• The grey path on the chart sketches the logical reaction sequence: a relief leg first into the mid-band (~108), where supply should be re-tested, and—only if absorption continues—an extension toward 112–118. Until price reclaims and holds above ~108, the structure remains a redistribution risk under that supply.
Invalidation: A decisive close below the recent trough low (the bear-trap baseline on the chart) would negate the recovery sequence and opens lower prices.
This analysis is a personal market view and is not investment advice.
Resisitance
Himatseide near breakoutHimatsingka Seide is near breakout zone.
Trade if it closes above resistance area.

TREND LINE RESISTANCENo matter how bullish peaple are so far we had 4 points of chart returning back from the trend line resistance in order BTC to start a bullish market it needs to break this resistance and only after that we can discuss about other price resistance sunch as 45500.So far far i think we can expect some small bullish movements but it's gonna be safier to place the shorts within your own strategy shorts signals. Just an opionion for the moment .

XRP/USDT (RIPPLE) Resistance line BreakoutRipple Technical Analysis Update
XRPUSDT Currently trading at 0.270'
Entry-level: Above 0.270 ( only enter after the 1-day candle close Above the resistance line)
Resistance level 1: 0.327
Resistance level 2: 0.375
Risk Reward Ratio : (1 : 4.3)
Support level or stop loss: 0.242
ALWAYS KEEP STOP LOSS...


USOIL 34.33 + 1.41% LONG IDEAGOOD DAY EVERYONE
HERE'S A LONG IDEA ON THE US OIL COUPLE OF SCENARIOS ARE POSSIBLE ON THE COMMODITY SO IF WE TRADE ABOVE RESISTANCE LEVEL 34.66 LOOKING FOR CONTINUATION TO THE UPSIDE IF YOU TOOK THE PREVIOUS IDEA ON USOIL ADJUST YOUR STOP LOSS TO JUST ABOVE PREVIOUS PENNANT AND HOLD ...
RISK MANAGEMENT
SWING TRADE

ICON-ICX- Breakout Imminent?BINANCE:ICXBTC
Icon is making higher lows thanks to a supporting trendline.
1075 resistance has been tested several times. How much longer will it hold?
ICX is setting up for a potential breakout to the 1150 resistance.


EASY ENTRY DOUBLE BOTTOM LONG LOOK AT THE DAILY CHART EASY 1:2 Hey I just found USDJPY on a bottom daily here is a 1H chart Scaling in some units now and on rebound on the support line.
On a long term it could be an easy 1:2 trade
TRade on your own and good luck !

Breaking resistanceThis pair break important resistance 121 points. Form me look like there is stability in Europe. For me long.

EURUSD start fallingEURUSD is going to start falling or never. We are now heading to March US debt ceiling and French election One of the Candidate Marine Le Pen launched her presidential campaign, promising to put France first by freeing it it from the “tyrannies” of globalisation, Islamic fundamentalism and the European Union. If French election is favour Le Pen, EURUSD will cascade down. further more, UK will start Brexit in March so Europe is full of uncertain.
Moreover, the Greece debt problem will be due on July this year. Although Greece has suffer along and have achieve Fiscal surplus for 1% of GDP, some IMF offical still insist Greece have to achieve fiscal surplus of 3.5% in 2018 in order to get aid.
Weekly Chart of EURUSD is showing a rebound to previous support line and also 20 week moving average and hit resistance. Stochastic is showing overbought means it is a bit difficult to get further rally. if EURUSD break below 1.05 then it will open up the way to parity.

GBP/EUR Short at Channel ResistanceWe are approaching the top of an upward channel, this key area of resistance is a good area for a sell opportunity. This is supported by divergence, that suggests that the next peak will be lower than the last - which would fall at the top of the trend line. Before placing a trade wait until the candle closes, if the candle closes outside of the trend line the set up is invalid. Finally, this upward trend has a bias to break to the upside, so this opportunity needs to be considered thoroughly.

Bullish Gartley Pound/DollarPrice has recently danced around the 1.241 level and appears to be moving in a Gartley formation. The potential reversal zone is calculated to slightly below this level but this is still indicating that price will bounce when the level is next retested. It may be wise to drop to the 1hr chart to seek a more accurate entry using candlesticks from a lower timeframe.
Gartley Ratios:
AB: 0.618
BC: 0.382-0.886
CD: 1.272-1.618
XD: 0.786

DXY Bulls vindicated, Key Resistance remainsIn my mind, the US Dollar is s benefitting from a much needed GOLD correction. None the less, the Bulls have been given a chance to run.
Watch for 101 to be in their sights.


UK100, what's next?Hello guys! happy new year.
UK100 indice is printing a nice range here and as we can see, it's at a very important point. Break or reversal? Our 2 most important questions. AS usual, we're not the one to decide, so let's watch it and see what the market will decide in the next coming candles.
As for a personal analysis, I bet for a reversal. Price is at the resistance, we have a doji candle and not much volume in the market for price to break the 3 months high. Still, let's wait for the upcoming candles.

EURJPY SHORT PT2So had i posted this beforehand, price was at the 18/19th.
The purple line denotes how price could have moved lower which i drew beforehand with the circle above.
the green lines are hourly support and the first of which would have been my entry, upon candle confirmation

GBPNZD - Bearish continuation after 50% retracementThe GBPNZD 50% retracement from the last major move appears to be holding. Indicators are suggesting oversold values and weakening bullish pressure. The red rectangle is the projection based on the 50% retracement.
A pending sell order has been place a few pips below today's low at 1.748. SL is safely above the highs of this retracement.
GBPNZD likes to make big moves so be ready for a roller coaster ride.


Gold Breakout from a very important zonethe market has shown a very aggresive breakout from the linear consolidation channel shown above.
these are strong signs of a retest to the previous structure low (blue trend line)
great short oppurtunity

Massive resistance area approaching The EURNOK is approaching a huge resistance area. Price hasn't broken this area since this time last year. I will definitely be watching this for either a long or short. Waiting for price action to confirm!
