ETH/USDT 1W Chart📊 Market Structure:
Main Trend: Still up (higher lows and highs pattern persists).
Current Phase: Correction in an uptrend.
Local Trend: Down for several weeks (series of red weekly candles).
⚙️ Key Support and Resistance Levels:
Resistance (green lines):
4,753 USDT – recent local high, very strong resistance.
4,373 USDT – previous consolidation level, currently a supply zone.
3,979 USDT – current key local resistance, which previously served as support.
Support (red lines):
3,600 USDT – currently tested support level (coincides with the uptrend line).
3,165 USDT – next strong support level (previous local lows).
2,740 USDT – strong long-term support, potential target for further correction.
📈 Trendline:
The black uptrend line connects successive higher lows since April 2024.
The current weekly candlestick is testing this line (confluence with support at 3,600 USDT).
Maintaining this line = still a bullish medium-term scenario.
A breakout and weekly close below ~3,580–3,600 USDT → a signal of a possible trend reversal.
📉 Volume:
Downward volume is increasing, indicating supply pressure.
A lack of strong demand candlesticks = buyers are cautious in this zone.
🔄 Stoch RSI Oscillator (bottom of the chart):
Located in the oversold zone (below 20).
The %K (blue) and %D (orange) lines are starting to converge → a possible rebound signal in the coming weeks if a crossover occurs upwards.
🧭 Scenarios:
🟢 Bullish
Holding support at 3,600 USDT + trendline.
Confirmation with a bullish candle with higher volume.
Target: Return to 3,980 → 4,370 USDT.
🔴 Bearish:
Closing the week below 3,580 USDT (trendline + support).
Potential decline to 3,165 USDT, and even 2,740 USDT beyond.
RSI and volume suggest that downward pressure remains significant.
📌 Summary:
Key level: 3,600 USDT → decisive point for the market's further direction.
Short-term: Still downward pressure, but a technical rebound is possible (Stoch RSI).
Medium-term: The uptrend has not reversed until ETH closes below the trend line and 3,550 USDT.
Resistence

BTC/USDT 1H Chart Short-Term📉 Descending Channel (black lines)
The price previously moved within a clear descending channel, which was broken upward.
A breakout from the channel signals a change in the short-term trend – from supply pressure to an attempted rebound.
From a technical perspective, a breakout from a descending channel often leads to an upward correction, the extent of which is at least the midpoint of the previous downward impulse.
🔷 Triangle Formation (blue lines)
After breaking out of the channel, the price formed a symmetrical triangle (consolidation) – a sign of market indecision.
Triangles of this type are often trend continuation patterns, but in this context – after a breakout from a descending channel – an upward breakout (i.e., a further upward rebound) is more likely.
The key resistance level to watch is $111,145 – a breakout with volume confirmation would open the way to $112,320 and then $113,921.
🧭 Key Technical Levels
Resistance:
$111,145 – local resistance (upper boundary of the consolidation/triangle).
$112,320 – another strong resistance level from the previous local high.
$113,921 – major medium-term resistance.
Support:
$110,442 – lower boundary of the triangle (short-term support).
$108,793 – support after the recent bounce.
$107,285 – next demand level.
$104,969 – bulls' defensive boundary in the broader context.
📊 Stoch RSI (bottom of the chart)
The Stoch RSI oscillator is currently in a rebound phase from the neutral level (~40–60).
If the lines (blue and orange) cross upwards and enter the zone above 80, this could confirm bullish momentum and a breakout from the triangle to the upside.
However, a rejection from 60 and a further drop below 20 would signal a false breakout and a possible retest of USD 108,800.
🔎 Scenario Summary
➡️ Upside Scenario (more likely):
Breakout from the triangle to the upside (confirmed by a 1-hour candle above USD 111,150).
Potential move to USD 112,300 → USD 113,900.
Momentum indicators support a rebound if the Stoch RSI maintains its upward trend.
⬇️ Downside scenario (alternative):
Unsuccessful breakout and return below $110,400.
A correction to $108,800 can then be expected, and if this level is broken, a further decline to $107,300.

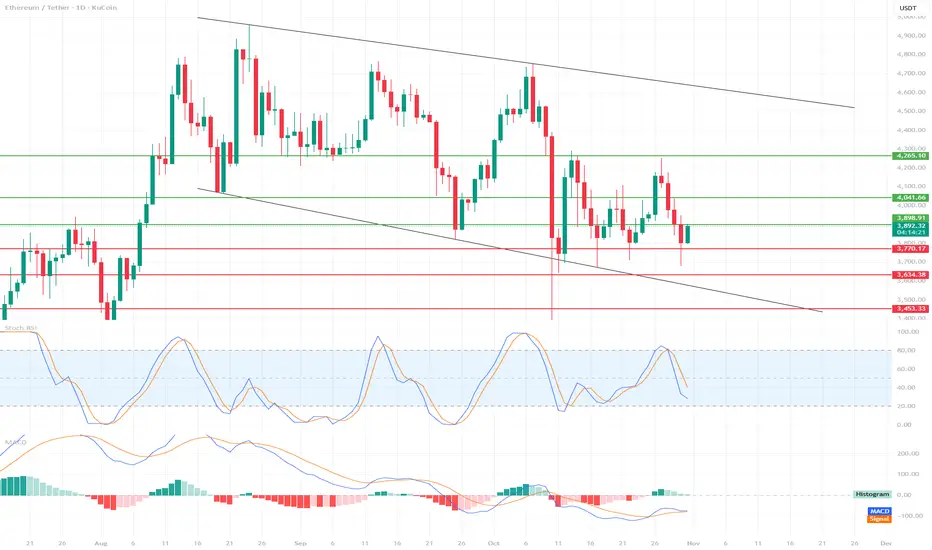
ETH Tests Support – Is This the Beginning of a Rebound?📉 Market Structure
We see a descending channel, bounded by two black trend lines.
Upper Boundary: ~$4,700
Lower Boundary: currently around $3,700, representing strong dynamic support.
The price is currently hovering slightly above the lower edge of the channel, suggesting a possible rebound, but the market remains in a medium-term downtrend.
🔍 Support and Resistance Levels
Support:
$3,770 → currently being tested, crucial in the short term.
$3,643 → next strong support from previous lows.
$3,453 → last line of defense against a steeper decline.
Resistance:
$3,889 → closest resistance, current local ceiling.
$4,041 → strong resistance resulting from prior consolidation.
USD 4.265 → a line that, if broken, could signal a change in the medium-term trend.
📊 Technical Indicators
Stochastic RSI
Located near the oversold zone (below 20), with a slight upward curve.
🔹 Signal: Potential upside move (bounce) in the short term if the %K and %D lines cross upward.
MACD
The MACD line is slightly below zero, but is starting to curve upward and may soon cross the signal line.
🔹 The histogram is starting to decline on the negative side – this is often an early bullish signal (possible change in momentum).
⚖️ Scenarios
🔹 Bullish
If ETH holds above USD 3,770 and the Stoch RSI confirms the rebound, a possible move towards:
3,889 → USD 4,041 → USD 4,265.
A break above USD 4,265 could open the way to USD 4,500+ (upper band of the channel).
🔻 Bearish
Loss of support at USD 3,770 → a signal of weakness.
Then the next downside targets:
USD 3,643, then USD 3,453.
If USD 3,453 breaks, possible tests of the lower band of the channel – even around USD 3,300.
🧭 Summary
Main trend: downward (descending channel).
Short-term bias: neutral-bullish (potential for a rebound from support).
Key level to watch: USD 3,770 – maintaining this level could trigger a rebound, loss = risk of a steeper decline.
GBPCHF: The Fake Breakout Tale
This is the daily chart!
It is broken below a main level!
but it might be fake!
Most of the CHF start to change their direction after reaching this level.
GBPCHF will by a great probability.
And this is the chart of latest 3M! a bearish channel is obvious here!
Fluctuations are considerable for this pair!
Two Scenarios are clear in it!
We might break the yellow up,
Or we might react to the green

BTC/USD 1D Chart📉 Trend Structure
Bitcoin is currently in a medium-term downtrend, as evidenced by the descending channel (black trend lines).
Each bounce from the upper edge of the channel has ended in a decline, and recent tests of the lower boundary suggest that the market is respecting this channel as a primary structure.
⚙️ Key Technical Levels
Resistance (green lines):
$123,345 – strong resistance from the previous high and the channel breakout boundary.
$115,179 – local resistance that has been tested several times and rejected.
Support (red lines):
$107,482 – currently tested support level; breaking it could strengthen supply pressure.
$104,929 – next strong support level near the local lows from September.
USD 98,841 – critical support – lower channel zone, potential capitulation or rebound zone.
📊 Volume
Volume is increasing on the declines, suggesting that the current downward move is supported by seller activity.
No significant accumulation volume at the lows – the bulls have not yet taken control.
🔄 Stoch RSI Oscillator
The Stoch RSI is approaching the oversold zone (around 20), but has not yet reached it.
If the %K and %D lines extend below 20 and then cross upward, this will signal a potential technical rebound.
For now, momentum is negative (bearish).
🧭 Scenarios
🟥 Bearish Scenario (more likely at this point)
A breakout of the $106,000 level opens the way to $104,900 and then $98,800.
Continuing the downward movement within the downward channel could lead to the lower edge of the channel around $100,000 in November.
🟩 Bullish Scenario (Bounce)
Defending the $106,000 level and a positive signal from the Stoch RSI could lead to a bounce around $115,000.
Only a breakout of the upper edge of the channel (~117,000–118,000) with volume confirmation would signal a trend reversal.
⚠️ Summary
Trend: Downtrend (descending channel)
Momentum: Bearish
Key level to watch: USD 106,000
Potential rebound area: USD 104,900 – USD 98,800
Stoch RSI: Near oversold → possible short-term rebound

SILVER LONGKeep eyes on silver now after gold. Check the chart. A break of the trendline can trigger an entry. 150000 will be a crucial level to watch too but if this is also broken then-
Target- 155000, 157000
Entry- Break of trendline 148000 or above 150000
Stoploss- 144500
Disclaimer- This is just for educational purpose.
JAI SHREE RAM.

ETH/USDT 1W🔹 Overall Trend
We are still in an uptrend (trend line maintained from the March low).
However, momentum is weakening—a series of lower highs is forming, suggesting a local correction within the main trend.
🔹 Key Technical Levels
🟢 Resistance:
4,179 USDT – the current level that the price is testing as resistance.
4,407 USDT – the next strong resistance, where previous rejections occurred.
4,877 USDT – the main resistance resulting from the August highs.
🔴 Support:
3,916 USDT – almost identical to the above (demand zone).
3,561 USDT – key structural support; loss of this level = possible trend change.
🔹 Formation and Structure
The current pattern could form a potential ascending triangle, with the trendline (black) connecting the lows and the horizontal resistance lines marking the upper boundary of the consolidation.
If a breakout occurs above 4,180–4,400, a move to 4,800+ is possible.
However, if we break the trendline and 3,900, a move to 3,560–3,400 could occur, or even a test of 3,000 with significant selling pressure.
🔹 Volume
Volume is decreasing during consolidation → typical of an accumulation or distribution phase.
No clear breakout signal – the market is waiting for a trigger (e.g., macroeconomic data, ETFs, news about ETH 2.0).
🔹 Stochastic RSI (Bottom of the chart)
Located in the oversold zone (<20).
The %K line (blue) is attempting to cross the %D line (orange) from below – a signal of an early rebound.
If confirmed next week, a local rebound from the 3,900–4,000 zone could occur.
🔹 Scenarios:
✅ Bullish:
Breakout from the trendline + breakout above 4,180 → target 4,400, then 4,880.
Confirmation by increasing volume and the Stoch RSI emerging from oversold territory.
❌ Bearish:
Breakout of the trendline and 3,900 → target 3,560, then 3,200.
Increasing downward volume + no bullish reaction at the support levels.

XRP/USDT 1D Chart Review🔹 1. General Trend
A long-term downtrend is visible, confirmed by the descending trendline connecting the peaks (black diagonal line).
The price continues to respect this trend, and the current rebound looks like a test of this line from below.
🔹 2. Key Levels
✅ Resistance:
2.77–2.80 USDT – current strong resistance (being tested now, with the price trying to break through it).
→ This is the confluence zone: downtrendline + horizontal level.
2.85–2.86 USDT – next resistance (previous local high).
3.12 USDT – main weekly resistance, where the last major downward wave began.
✅ Support:
2.48 USDT – key daily support from which the market rebounded.
2.13 USDT – lower support that halted the earlier crash (large wick).
🔹 3. Stochastic RSI
Currently in the overbought zone (80–100), and the %K and %D lines are close to crossing.
→ This signals that upward momentum may be weakening – a local correction or consolidation is possible.
🔹 4. Scenarios
🟢 Bullish (breakout of resistance 2.77–2.80)
A confirmed breakout and close of the candle above 2.80 USDT will signal a continuation of the move to:
🎯 2.85–2.86 (first target)
🎯 3.12 (second target)
🔴 Bearish (rejection of resistance)
If the daily candle closes below 2.65 USDT, a possible pullback to:
🎯 2.48 (key support)
🎯 2.13 (deeper retest)

BTC/USD 1h short-term🧭 General context
• Bitcoin price is ~$114,470.
• The short-term trend remains upwards, which is confirmed by the black trendline.
• The last upward impulse brought the price from ~ USD 111,000 to ~ USD 117,000.
• Currently, the price is testing the support zone after a short correction.
⸻
📊 Key technical levels
• Resistances (green):
• USD 117,815 – local peak, strong resistance (potential TP for longs).
• USD 116,545 – medium resistance, possible retest in the short term.
• $115,518 – lower resistance, bulls decision point.
• Support (red):
• USD 114,667 – currently tested level (important intraday support).
• USD 113,545 – another strong support (close to trendline).
• USD 111,915 – the limit after which the upward trend may reverse.
⸻
⚙️ Trendline
• The trend line runs from approximately USD 110,000 and connects subsequent lows.
• The price is currently close to the trendline, so:
• Rebound → continuation of the upward trend,
• Breakout → possible decline to 113,500 or lower (up to USD 111,900).
⸻
📈 Oscillator (Stochastic RSI)
• It is located close to the oversold zone (approx. 8 p.m.).
• This means that the market is close to a potential rebound - a bullish signal (if the %K and %D lines cross upwards).

BTC/USD 1H chart short-term📊 Market structure:
• Current price: ~$113,300
• Trend: A short-term uptrend - evidenced by rising lows and rising highs, as well as price remaining above the black trendline.
• The chart shows Bitcoin testing resistance at $114,089, following a strong breakout earlier.
⸻
🧭 Key Levels:
Resistances (green lines):
1. USD 114,089 – the closest resistance that the price is currently testing.
2. USD 116,057 – another strong resistance, potential target after breakout.
3. USD 118,681 – main resistance level from the higher time frame (H4/D1).
Support (red lines):
1. USD 112,156 – first local support (close to the trend line).
2. USD 109,567 – medium-term support, key to maintaining the growth structure.
3. $107,702 – Strong support where institutional buy orders are likely.
⸻
📈 Trendline:
The black upward trendline leads through the recent local lows.
➡️ As long as the price stays above it, the trend remains bullish.
➡️ Breaking this line down would be the first signal of a weakening trend and a correction towards USD 112,150-111,000.
⸻
⚙️ Stochastic RSI (bottom indicator):
• Currently starting to move down from overbought levels (above 80).
• This indicates a possible short-term downward correction or consolidation.
• If the indicator drops below 40 while keeping the price above the trendline, it may be a good opportunity to go long again.

ORDER / USDT gaining momentum-Watch for breakout towards $0.35ORDER is showing strong momentum and building up for a potential short-term bullish rally. A confirmed breakout above the current resistance zone could lead the price towards $0.33 – $0.35.
Momentum suggests a possible trend shift — keep a close watch and manage risk wisely.

BNB/USDT 1H chart short-term📊 1. Trend structure
• We see an upward channel (black trend lines) - the price rebounds from the lower support line and gradually heads upwards.
• Currently, the rate oscillates in the middle zone of the channel - approx. 1,115 USDT.
• As long as the lower trend line (approx. USDT 1,090) holds, the bullish structure is intact.
⸻
🟩 2. Support and resistance zones
Support:
• 1,106 USDT → local intraday support (already tested several times).
• 1,090 USDT → stronger support + trend line.
• 1,056 USDT and 1,016 USDT → lower zones, in case of a stronger correction.
Resistance:
• 1,125 USDT → local resistance that is currently blocking the upward move.
• 1,148 USDT → another strong resistance, after breaking it, a test of 1,174 USDT (upper border of the channel) is possible.
⸻
📈 3. Indicator – Stochastic RSI
• Currently, the Stoch RSI lines are starting to bounce from bottom to top, after previously entering the oversold zone.
➡️ This is a short-term rebound signal, but not yet a strong buy signal - confirmation of the break through of the ~1,125 USDT level is needed.
⸻
⚙️ 4. Technical scenarios
Bullish:
• Maintaining 1,106–1,090 USDT and breaking above 1,125 USDT → target 1,148 → 1,174 USDT.
• The trend support at 1,090 USDT acts as a buying zone for swing traders.
Bearish:
• A break below 1,090 USDT will negate the channel structure → a possible drop to 1,056 USDT and then 1,016 USDT.
• The RSI will then likely enter a strong oversold zone.

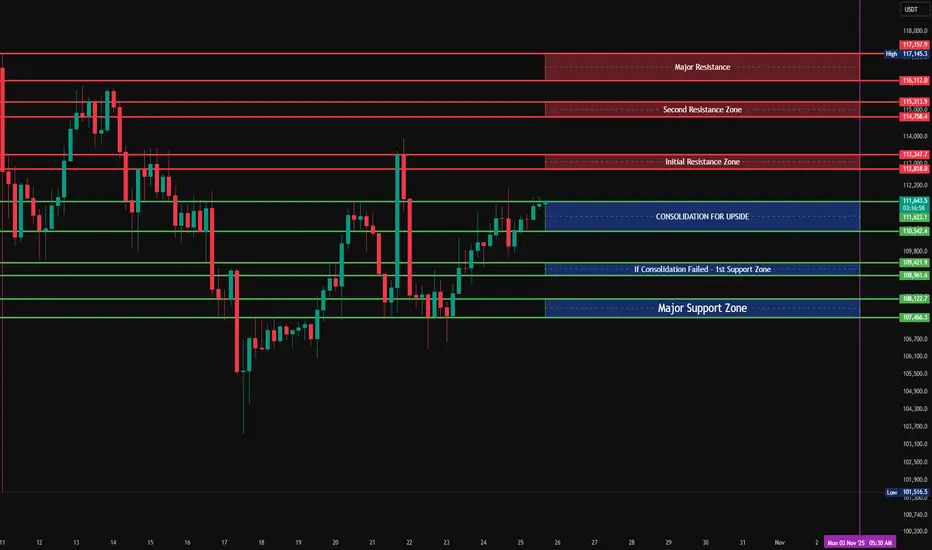
BTC Key Levels in 4H🧭 BTC 4H Market Analysis
BTC remains in a structural equilibrium phase, holding within a tight consolidation pocket ($111,422 – $111,691) as the market attempts to sustain above the midrange base. Price has been building gradually higher lows since the last retest of the Major Support Zone ($107,466 – $108,122), signaling a slow reaccumulation phase within a broader corrective context.
This “Consolidation for Upside” zone marks a pivotal decision area. Sustained acceptance above $111,600 will likely confirm strength continuation toward the Initial Resistance Zone ($112,818 – $113,347), setting the stage for a possible breakout sequence toward the higher resistance layers at $114,758 – $115,313 (Second Resistance) and $116,112 – $117,157 (Major Resistance).
The 4H market tone currently shows balance, with buyers defending dips efficiently but yet to assert full control. For any bullish follow-through, the next few candles will need to establish closing strength above the consolidation ceiling — ideally a clean break and retest confirmation above $111,700.
If price fails to expand upward and instead slips back below $110,524, the short-term tone shifts to neutral, and BTC may drift back into its lower demand range at $109,421 – $108,961 (“If Consolidation Failed – 1st Support Zone”). That’s where buyers are expected to defend again; loss of this zone would expose the deeper Major Support Zone ($107,466 – $108,122), a key structural area that has historically served as a base for directional reversals.
The broader structural context indicates that BTC is compressing within a mid-range pocket, likely preparing for a breakout leg into early November. Given the price compression near the consolidation high, momentum bias leans constructively bullish, provided the upper range holds firm.
📊 Summary:
Current Range: $111,422 – $111,691 (Consolidation for Upside)
Immediate Support: $110,524
If Consolidation Fails – 1st Support Zone: $109,421 – $108,961
Major Support Zone: $107,466 – $108,122
Initial Resistance Zone: $112,818 – $113,347
Second Resistance Zone: $114,758 – $115,313
Major Resistance: $116,112 – $117,157
Market Tone: Balanced / Constructive
Bias: Mildly Bullish while holding above $110,500; range-neutral below $109,400.
Chorus (CNU) major resistance test. Price discovery?
CNU being in the Telcom space has seen a steady and consistent upwards trend since near its inception and being listing on the ASX, with over 600% gain since 2013. In the last 5 years or so we've seen a sideways trend, as the price begins to advance towards test its previous major resistance @ around the $8.80 mark.
On the (W) we can see a gap down after a test of this key area and a mean reversion to the 200MA with a close on the 50MA. Some big seller volume moved in to push the price down, but encouragingly price as respected the current trend line, with signs of a bounce this week.
A potential GAP fill is in play, and a potential for a break above major resistance and then into price discovery for this company. A clear BUY signal would be a break or break and hold after a retest of the resistance of the $8.80 mark. Good luck.

BTC/USDT Short-Term 4H Review Chart🧩 Market Structure
After a strong decline, the price has rebounded, creating a local uptrend (marked with the orange trend line).
The price has currently broken through the uptrend from below, which is the first sign of bullish weakening.
The current candle is testing this line from below—a classic trendline retracement (potential pullback).
📉 Support and Resistance Levels
From the chart:
Resistance (green lines):
113.868 USDT — key high.
111.240 USDT — strong resistance (previous local high).
109.133 USDT — currently being tested from below (confluence with the trendline).
Support (red lines):
107.524 USDT — first support.
105.253 USDT — lower support, a boundary for maintaining the higher low structure.
103,582 USDT — key support, below which the upward structure will be negated.
🔍 Volume
Increasing volume is visible on the red candles — selling dominated the trend breakout.
The last green candle has a large lower wick and slightly higher volume — a signal of a possible defensive reaction from the bulls, but without confirmation of continuation.
📊 Stochastic RSI (oscillator)
Located in the oversold zone (around 20).
The %K line is starting to curve slightly upward — it could signal a short-term rebound, but until there's a crossover and confirmation, this is only an early signal.
📈 Scenarios
✅ Bullish:
If BTC rebounds and closes the candle above 109,100 USDT, it will be a false breakout of the trend and a possible upward move towards 111,200–113,800 USDT.
Support to be maintained: 107,500 USDT.
❌ Bearish:
If the price remains below the trendline and 109,000 USDT, and then breaks above 107,500 USDT, the path opens to:
105,200 USDT, and then
103,500 USDT (strong support and potential buy zone).
⚙️ Summary
Short-term trend: neutral → slightly downward (after the trendline breakout).
Key level to watch: 109,100 USDT (retest trendline).
Potential support: 107,500 → 105,200 → 103,500.
Momentum (Stoch RSI): A bullish rebound is possible, but confirmation is lacking.

TradeCityPro Academy | Support & Resistance Part 2👋 Welcome to TradeCityPro Channel
🎓 Educational Section Technical Analysis Training Series
Welcome to the Educational Content Section of our channel!
Here, we aim to teach you technical analysis from A to Z through structured playlists.
We’ll cover everything from risk and capital management, Dow Theory, support and resistance, trends, and market cycles, to more advanced concepts.
Our lessons are based on both real market experience and The Handbook of Technical Analysis.
🎨 What is Technical Analysis?
Technical Analysis (TA) is a method used to forecast price movements in financial markets by analyzing historical data, especially price and volume.
It’s based on the idea that history tends to repeat itself, and that recurring patterns can reveal profitable trading opportunities.
📚 Complete Guide to Support and Resistance in Technical Analysis
🧩 Introduction
In technical analysis, two key concepts form the foundation of nearly every trading strategy: Support and Resistance.
These levels represent areas on the chart where the price is likely to change direction, as buyers or sellers regain control.
But to truly understand them, you must go beyond the chart — because their origin lies in human psychology and collective behavior.
🟢 What Is Support?
A support level is an area where buying pressure increases and prevents the price from falling further.
It acts like a floor where buyers believe the asset has become cheap enough to buy.
As a result, the market tends to bounce upward from that area.
For example, if Bitcoin has repeatedly reversed near $55,000, that zone is considered a support level.
🔴 What Is Resistance?
A resistance level is an area where selling pressure increases and stops the price from rising higher.
When the price approaches this level, traders often feel the asset is “too expensive” and start selling.
For example, if Ethereum has failed multiple times to break above $3,800, that area is considered resistance.
💭 Why Do Support and Resistance Form?
Markets are not just numbers — they’re the reflection of human emotion and crowd behavior.
When large groups of traders make similar decisions (to buy or sell) around the same price zone, it creates a psychological memory in the market.
If price has reacted there before, traders remember it — and react the same way next time.
This repetition forms the backbone of how support and resistance levels develop and strengthen over time.
🧠 The Role of Emotion and Crowd Psychology
Emotions drive markets.
When prices rise quickly, people experience FOMO (Fear of Missing Out) and rush to buy — until demand runs out and price reverses (resistance).
When prices fall, fear of losing money triggers panic selling — until sellers dry up and price rebounds (support).
This constant emotional cycle repeats endlessly, creating recurring support and resistance zones on every chart.
⚙️ The Structure Behind the Levels
From a technical perspective, these levels form because large clusters of orders are placed around them.
Traders typically set buy orders below the current price (near support) and sell orders above it (near resistance).
So when the market reaches those areas, there’s a strong battle between buyers and sellers.
That’s why these zones are not just psychological — they’re also built into the order flow and liquidity structure of the market.
📈 Reactions and Breakouts
When price approaches a key level, two outcomes are possible: Reaction or Breakout.
In a reaction, price touches the level and reverses — meaning buyers or sellers defend it successfully.
In a breakout, price pushes through with strong momentum and high volume, breaking the market’s previous belief.
After a breakout, the level often changes its role:
A broken resistance becomes new support.
A broken support becomes new resistance.
This behavior is known as Role Reversal, one of the most powerful principles in chart analysis.
⚖️ The Professional Mindset
Support and resistance are zones, not exact numbers.
The market may slightly move above or below them before reacting — this is known as a fake breakout.
Professional traders look for confirmation such as reversal candles, volume spikes, or RSI divergences before acting.
The key is not to memorize lines but to read crowd behavior.
Once you understand why people buy or sell at certain points, you gain a true edge over the average trader.
🧩 Conclusion
Support and resistance are not just lines on a chart; they are the visible footprints of fear, greed, and collective memory in the market.
By understanding their psychological and structural roots, you can identify better entry and exit zones,
predict reactions more accurately, and avoid emotional mistakes.
Learn to read the emotions behind the candles — because at its core, the market is simply a crowd of human minds trying to win.

BNB/USDT 1D chart review📊 1️⃣ General context
• BNB price is approximately USDT 1,100, after correction approximately -0.85%.
• It is clear that the market is in a corrective phase after a strong increase - recent highs reached ~1,340 USDT.
• Currently, the rate is balancing between support ~1069 USDT and resistance ~1149 USDT.
⸻
🟢 2️⃣ Supports and resistances (key levels)
• Closest support:
🔸 1069 USDT (short term, red line)
🔸 985 USDT – stronger support (previously tested, below EMA 50)
🔸 884 USDT – strong long-term support (potential correction low)
• Resistances:
🔹 1149 USDT – first level to break
🔹 1226 USDT – important daily resistance
🔹 1344 USDT – main peak, border of the previous impulse
⸻
📈 3️⃣ Moving Averages (SMA/EMA 50/200)
• We see the yellow EMA 50 line and the green SMA 200 line crossed (EMA Cross 50/200).
👉 This is a golden cross - a medium-term growth signal.
• Currently, however, the price has fallen below EMA 50, which means supply pressure in the short term.
• As long as it stays above the 200 SMA (~1060-1070), the macro trend remains bullish.
⸻
📉 4️⃣ MACD
• The histogram is red and decreasing - this confirms that the downward momentum continues but may be weakening.
• The MACD line (blue) is approaching the signal line (orange), which may indicate an impending bounce.
⸻
🪫 5️⃣ RSI
• RSI is around 40-45, which is close to the oversold zone.
• This suggests that sellers may be losing strength and a technical rebound may occur soon.

Simple XAUUSD Strategy That Just Made 100 Pips!Gold played out beautifully today with a clear 100-pip move to the downside. After testing resistance near 4240, price showed rejection with strong bearish candles, confirming exhaustion from buyers and giving a clear sell signal.
The structure shifted from higher lows to lower highs, signaling the start of a short-term correction. Once price broke below the intraday support zone, momentum carried it smoothly down toward 4145 — completing a perfect swing move.
No complex indicators were needed. Just clean market structure, rejection candle confirmation, and patience for entry. The dollar strength added extra pressure on gold, aligning with the technical view.
Key takeaway: follow structure, not emotion. A simple rejection and structure break can deliver more than any over-complicated setup. Consistency comes from clarity.
Trade closed around 4145 with a solid 100-pip gain. Now watching the 4140–4130 zone for possible reaction or bounce setup before the next move.
#XAUUSD #Gold #PriceAction #Breakout #SmartMoney #TechnicalAnalysis #DayTrading #Scalping #TradingView

BTC/USD 4H chart reviewBitcoin is currently trading around $109,000, a rebound after falling. An attempt to break the short-term downtrend is visible (yellow SMA line 1).
The previous lows were around USD 104,500 - 105,000, and the current candle is trying to break the local resistance around USD 109,000 - 110,000.
⸻
📊 2. Moving Averages (SMA / EMA)
You have several averages on the chart:
• The yellow line (SMA #1) – the short-term average, currently slightly sloping downwards, but the price is just breaking it from below – is the first sign of a change in momentum.
• Red line (EMA Cross 50/200) – it looks like the 50 EMA is below the 200 EMA, confirming the downtrend in the broader picture.
• Blue and green zones (EMA/SMA of higher intervals) – show strong resistance zones:
• $112,592
• $115,674
→ These are targets for a potential upside rally if the 109k breakout holds.
⸻
💹 3. MACD
• The MACD line crossed the signal line from below → it is a buy signal (bullish crossover).
• The histogram increases above zero, which confirms the upward momentum.
➡️ MACD confirms that the upward correction continues, but we do not have a full upward trend yet.
⸻
📈 4. RSI
• RSI is around 55-60, i.e. neutral and upward.
• It was previously in the oversold zone (around 30), so the current rebound is a healthy reaction.
➡️ No overbought yet, so there is room for further upward movement.
⸻
🧱 5. Key technical levels.
Level
Support 1
$106,550
local support after rebound
Support 2
$104,550
strong bottom from the previous move
Support 3
$101,700
the last bastion of buyers
Resistance 1
$109,000-$110,000
currently tested level
Resistance 2
$112,600
another growth target
Resistance 3
$115,700
EMA200 key barrier – trend change if it breaks

$3,500 ETH Incoming! I AM SHORT!#ETH just rejected from a 4H supply zone. If the bearish PA continues, we will expect the local lows to be taken out and the $3,500 psychological number to be tested.
How long will it take?
Just sit back and enjoy the ride.
Calculate Your Risk/Reward so you don't lose more than 1% of your account per trade.
Every day the charts provide new information. You have to adjust or get REKT.
Love it or hate it, hit that thumbs up and share your thoughts below!
This is not financial advice. This is for educational purposes only.

BTCUSD 1D Chart • Trend: clear decline in the descending channel (yellow lines).
• EMA 50/200: during a bearish cross (death cross) - medium-term bearish signal.
• SMA 50 / 100 / 200: price below all key averages - a classic signal of market weakness.
⸻
📉 1. Trend indicators
🔹 EMA Cross 50/200 (blue)
• The price has fallen below EMA 200, which means that the medium-term trend is currently negative.
• In addition, the EMA 50 breaks the EMA 200 from above - a sell signal.
🔹 Descending Channel (Yellow)
• The price is close to the lower band of the channel, which may result in a short-term technical rebound, but the main trend remains down.
• Upper channel line (resistance): approximately USD 114,000-115,000
• Bottom Line (Support): ~$101,000
📊 3. Momentum indicators
🔸RSI
• RSI ≈ 37 → close to oversold zone, but not extreme yet.
• Signal: Possible short bounce if it stays above the 30 level.
🔸 MACD
• The MACD line is below the signal line and the negative histogram is growing → the downward momentum continues.
• No signs of reversal yet.
⸻
🔥 4. What does this mean in practice
🔻 Short-term (1-7 days):
• Downward trend with a possible technical rebound in the area of USD 104,000-101,000.
• RSI close to oversold → possible pullback to USD 109,000–110,000.
⚖️ Medium term (2-4 weeks):
• Until BTC returns above EMA 200 (approx. 115,000), the market remains in a correction/distribution phase.
• If the price breaks 101,000 down, a possible decline to 96,900 or even USD 92,000 (previous macro support).
⸻
📈 5. Scenarios
✅ Bullish (less likely now)
• Maintaining above $104,000
• Breakout 109,000 → USD 112,000 → test 115,000
• Breakout of EMA 200 → trend reversal signal
❌ Bearish (more likely)
• 104,000 raise → $101,000 test
• If the support breaks, a decline to 96,900-97,000 is possible within a few days.

EURUSD in channel resistance rangeHello friends
The EURUSD currency pair has reached the ceiling in the channel resistance range and you can take a sell position at this price.
The stop loss if the price stabilizes above the trend line in the 4h time frame is in the price range of 1.16900
The take profit is in the channel bottom range in the price range of 1.14800
Dear traders, please do not forget about capital management, risk management and adherence to the stop loss.
When the price reaches the target, the update for this currency pair will be posted again, so follow me to be informed about low-risk and successful trading ranges and be the first to know
I hope you are profitable.

ETH/USDT 4H chart review📉 Main trend (short-term)
• The price is below the black downtrend line, which means sellers are dominating.
• There is an attempt to break out above the trendline, but there is no continuation - i.e. a false breakout (so-called "bull trap").
⸻
🔴 Key support and resistance levels
• Resistances:
• 4,252 USDT – local resistance, the limit of the previous rebound.
• 4,471 USDT – strong resistance, earlier peak after breakout.
• 4,750 USDT – main resistance from a higher interval (possible target after a trend change).
• Support:
• 3,963 USDT – current price level, acts as local support.
• 3,763 USDT – next strong support, confirmed by the previous rebound.
• 3,435 USDT – critical zone, bottom of the structure.
⸻
📊 RSI (oscillator)
• RSI (bottom chart) is close to the oversold zone (<30).
• This means that the market is overloaded with selling and a technical rebound may occur in the short term.
⸻
🔍 Volume
• Volume decreases with subsequent declines → a sign of supply fatigue.
• This may suggest that a local bottom is approaching and a possible corrective move upwards.
⸻
📈 Scenarios
✅ Bull scenario
• If ETH stays above USDT 3,960-3,970, there may be a rebound to:
👉 USDT 4,250-4,470 (first target).
• Confirmation: a candle closing above the black trend line.
❌ Bear scenario
• If the price drops below USDT 3,960 and stays there for 4H,
next drop target is:
👉 3,760 USDT, and in the event of a breakout – 3,435 USDT.
