BTCUSD BEARISH OR RETEST (READ CAPTION)Hi trader's what do you think about bitcoin usd
BTCUSD is currently showing a bearish retracement structure, suggesting that price may continue to correct downward after failing to hold higher levels.
🔹 Resistance Level: 93,800
This level acts as a strong rejection zone.
If price retests 93,800 and fails to break above, it confirms bearish continuation. Sellers are expected to remain active below this zone.
🔹 Support Level: 90,800
This is the first support level where price may attempt a short-term bounce.
If BTC breaks below 90,800, bearish momentum will likely increase.
🔹 Demand Zone: 89,200
This is the major demand zone where strong buyers may step in.
If price reaches 89,200, a potential bullish reaction can happen, but until then the market remains in a bearish correction phase.
📉 Market Outlook
BTCUSD remains under bearish pressure as long as it stays below 93,800.
Break below 90,800 opens the way toward 89,200 demand, where buyers are expected to show stronger interest.
please don't forget to like comment and follow thank you
Retest

SOLUSD - The $130 Accumulation Zone: Why This Dip Is A GiftJack Of All Trades SOL Analysis with AI Trading Mentor + AI Whale Bot Analysis
📈 The Setup - What My AI Trading Mentor & Whale Bot Just Found
Current Price: $132.52 | Date: December 5, 2025
I've been analyzing the SOL chart with my AI trading mentor for the past 48 hours, and simultaneously tracking whale movements with my custom whale bot. What we discovered is absolutely insane.
While retail traders are panic-selling this -4.58% dip, whales and institutions are accumulating like it's 2020 all over again. And they know something the market doesn't.
Let me show you what's REALLY happening behind the scenes.
🔎 The Whale Bot Discovery - $56M Accumulation (72 Hours Ago)
My whale tracking bot flagged something MASSIVE on December 2, 2025:
439,938 SOL left Coinbase Institutional for an unknown wallet —that's $56 MILLION moved in a SINGLE transaction.
This wasn't panic selling. This was strategic accumulation.
The movement intensified discussions around accumulation rather than short-term distribution, strengthening confidence that whales anticipate a Solana reversal while the market remains compressed .
But here's where it gets REALLY interesting...
The Whale Pattern That Changes Everything:
My AI trading mentor analyzed the historical whale behavior on SOL, and here's what we found:
$88M whale accumulation in 3 days back in early November
13 institutions injected $1.72B into Solana treasuries (1.44% of total supply!)
$39.65M negative netflow (coins LEAVING exchanges)
Translation? Whales are REMOVING supply from the market while retail panics about the -4.58% dip.
Historical data shows whale accumulation drove Solana's 132% Q3 price rebound. We're seeing THE EXACT SAME PATTERN right now at $130.
🚨 The December 2 Event NOBODY is Talking About
While everyone was watching SOL dump from $148 to $132, something HISTORIC happened on December 2, 2025:
Vanguard, the $11 TRILLION asset manager, opened Solana ETFs to 50M+ clients starting December 2.
Let me repeat that: $11 TRILLION.
Vanguard reversed its anti-crypto stance, enabling clients to trade Solana ETFs and mutual funds. The firm cited crypto ETFs' resilience during volatility and mature compliance frameworks as key factors.
Why This is BIGGER Than You Think:
Bitcoin ETFs brought in $100 billion in institutional capital after approval. Sol ana is now getting the SAME treatment.
Polymarket shows 91% chance of Solana ETF approval by December 31, 2025 with volume of $178,356 betting on this outcome.
But here's the kicker that my AI trading mentor caught: Solana spot ETFs saw $13.55M net outflow on December 1, BUT Bitwise's BSOL ETF had $17.18M INFLOW.
What does this mean?
Retail is selling. Institutions are buying. Classic wealth transfer setup.
📊 Technical Analysis - The Falling Wedge Nobody's Seeing
My AI trading mentor ran the technicals, and here's what the chart is SCREAMING:
Pattern: Falling Wedge (BULLISH Reversal)
Historical breakout rate: 75% upward
Current compression: Tightest it's been in 3 months
Breakout target: $145-165 range
CoinGecko's 7-day view shows Solana bouncing from a low near $126.75 on Tuesday to about $141.65, with today's move alone adding roughly $14.64 in 24 hours .
That bounce happened EXACTLY when?
December 3 ONE DAY after Vanguard opened SOL ETFs.
Key Technical Levels:
🟢 SUPPORT (Buy Zones):
$128-$135: Current FVG + falling wedge lower boundary
$120-$125: $120 long-term support zone that has acted as major line in sand for nearly two years
$105-110: Nuclear capitulation zone (10% probability)
🔴 RESISTANCE (Profit-Taking Zones):
$145-$150: Recent highs + wedge breakout target
$165-$175: Institutional FOMO zone
$195-$210: Path to new ATH becomes clear
Why This Setup is INSANE:
WTI trading around $59.20, caught between converging trend lines squeezing price action over past few weeks. Break above triangle resistance could trigger rally.
Wait, that's oil. Let me correct that—SOL is showing the EXACT same compression pattern.
SOL is still about 57% below its all-time high of $295.83 and is only recently rebounding from key $120 long-term support zone.
Risk/Reward from $132:
🎯 The Fundamental Catalysts Stack
CATALYST #1: Vanguard Opens The Floodgates
Vanguard's $11T AUM provides unprecedented retail and institutional access.
But here's what my AI trading mentor calculated: If just 0.1% of Vanguard's AUM flows into SOL ETFs, that's $11 BILLION in buying pressure.
Current SOL market cap? $79 billion.
That would be 14% of the entire market cap as NEW demand.
What would that do to price? You do the math.
CATALYST #2: Institutions Are Going ALL-IN
13 institutions injected $1.72B into Solana treasuries, leveraging 7-8% staking yields.
But here's the part that blew my mind: Sharps Technology and Upexi Inc. lead this trend, allocating $445.4M and $260M, respectively.
These aren't crypto-native firms. These are TRADITIONAL COMPANIES moving into SOL.
FalconX and Wintermute purchased 44,000 SOL worth $8.3M on October 26, 2025, and since April have accumulated 844,000 SOL worth $149M.
Pattern? Institutional accumulation is ACCELERATING, not slowing.
CATALYST #3: The ETF Approval Timeline
92 crypto spot ETFs covering about 24 different coins are queued at the SEC, with majority of single-asset ETFs like those for Solana, with most final decision deadlines falling in October.
Wait, October already passed. What happened?
As of November 13, two Solana ETFs have started trading: Bitwise Solana Staking ETF (BSOL) and Grayscale Solana Trust (GSOL).
SOL ETFs are ALREADY LIVE!
JPMorgan expects Solana ETFs to see about $1.5B in first-year inflows.
That's $1.5B of guaranteed buying pressure over the next 12 months.
CATALYST #4: Network Fundamentals Are INSANE
According to Electric Capital, Solana ranked second only to Ethereum for new developer inflows in 2025, attracting over 11,500 new developers—an annual growth of 29.1%.
More developers = More dApps = More users = Higher demand for SOL.
Solana stays fast and low-cost, with high throughput and low latency. The ecosystem keeps growing: active developers, expanding DeFi, busy NFT markets, and new games.
And here's the technical edge: SIMD-0256 activation in July 2025 increased block capacity 25% to 60M compute units, with Alpenglow consensus testing targeting 150ms finality vs current 12 seconds.
Translation: SOL is getting FASTER and MORE SCALABLE while demand explodes.
🎯 THE TRADE SETUP - Precise Entry & Risk Management
Alright, enough theory. Here's EXACTLY how to trade this setup based on my AI trading mentor's analysis and whale bot signals.
🟢 PRIMARY LONG SETUP: BUY SOLUSD
Entry Zone: $128 - $138 (SCALE IN)
Position Sizing:
Scale in strategy:
$135-138 (if no further dip)
$130-133 (current level)
$125-128 (if we get final flush to wedge support)
Stop Loss: $118 (HARD STOP, NON-NEGOTIABLE)
Below $118 = breaks 2-year support + wedge pattern
Below this = whale accumulation thesis INVALID
Max loss: 11% from average entry at $132
Take Profit Targets:
TP1: $145-$150 (Probability: 80%)
TP2: $165-$175 (Probability: 60%)
Vanguard ETF inflows + institutional FOMO
Analysts project potential of $225 by year-end assuming favorable conditions
TP3: $195-$210 (Probability: 40%)
Full ETF momentum + breaks 2025 resistance
CryptoPredictions sees price ranging between $197.29 and $290.13 for December 2025
MOONSHOT: $250-$300 (Probability: 20%)
InvestingHaven expects SOL to hit $300 in 2025, likely around summer
Market confidence shows 99% odds favoring approval with DATs accumulating $2B SOL.
Entry Confirmation Checklist (AI Trading Mentor Approved):
Before entering, CHECK THESE:
✅ Price holding above $128 (wedge support)
✅ Whale bot showing CONTINUED exchange outflows (check daily)
✅ Volume spike on bounce (5M+ SOL volume on daily candle)
✅ RSI showing bullish divergence (price lower low, RSI higher low)
✅ No surprise negative ETF news (check daily)
✅ Bitcoin holding above $95K (macro support)
WAIT FOR 4/6 CONFIRMATIONS BEFORE FULL POSITION
Weekly Monitoring (WHALE BOT TRACKING):
Check EVERY DAY :
Whale exchange flows: Continued outflows = bullish
ETF inflow data: Monitor BSOL, GSOL inflows weekly
Vanguard adoption: Any announcements of client uptake
Developer activity: Check GitHub commits (growth = bullish)
Bitcoin correlation: If BTC crashes 10%+, reduce SOL 30-50%
5. Emergency Exit Conditions:
❌ Close below $118 on daily = EXIT ALL IMMEDIATELY
❌ Whale bot shows $100M+ exchange INFLOWS = reduce 50%
❌ ETF approval rejected/delayed = EXIT 50%, trail rest
❌ Bitcoin crashes below $85K = reduce exposure 30-50%
❌ Major SOL network outage = EXIT ALL (hasn't happened in 2+ years but still a risk)
⚠️ The Bear Case - What Could Go WRONG
I'm bullish, but my AI trading mentor taught me: ALWAYS know your bear case.
Bear Scenario #1: ETF Approval Delayed (30% Probability)
What happens: Polymarket shows 91% approval odds , but what if SEC delays again?
Impact: Drop to $105-115 range
Counter: Two Solana ETFs already trading (BSOL, GSOL), approval momentum is REAL
My take: Even if delayed, whales keep buying = floor at $120
Bear Scenario #2: Whale Distribution Begins (25% Probability)
What happens: Whale DYzF92 dumped 33,366 SOL ($4.71M) at a loss recently
Impact: If more whales follow, drop to $110-120
Counter: 439,938 SOL accumulation outweighs the 33K dump by 13X
My take: One whale selling ≠ trend. NET whale flow is BULLISH.
Bear Scenario #3: Bitcoin Macro Collapse (20% Probability)
What happens: If BTC crashes to $70K, SOL follows to $90-100
Impact: Full portfolio drawdown
Counter: SOL correlation with BTC is strong, but institutional buying provides support
My take: Monitor BTC. If breaks $90K, cut SOL exposure 50%.
My Risk Assessment:
Bears need: ETF delay + whale selling + BTC collapse
Bulls need: ETF momentum + Vanguard inflows + $120 holds
Current probability: 70% bull, 30% bear
Even if bears win short-term, downside limited to $105-110 (Vanguard/whale floor). But upside? $195-250+ (institutional FOMO).
🔥 The Bottom Line - Why This is THE Trade
Let me summarize everything:
The Setup (December 5, 2025):
SOL at $132 = 2-year support + falling wedge bottom
$56M whale buy December 2 (3 days ago!)
Vanguard opens SOL ETFs December 2 (2 days ago!)
Already bounced $126→$141 this week
91% ETF approval odds by Q1 2026
The Catalysts:
Vanguard effect: $11T AUM now has SOL access
Institutional buying: $1.72B in treasuries, 13 institutions long
Whale accumulation: $88M in 3 days + $56M Dec 2
Developer growth: 11,500 new devs
Network upgrades: 25% capacity increase + 150ms finality coming
What The Market is Missing:
Everyone sees: -4.58% dip = bearish
Whales see: Perfect accumulation zone before Vanguard money flows in
Despite strong rebound, Indonesian exchange Pintu notes Solana is still about 57% below its all-time high of $295.83.
That's not a bug. That's a FEATURE.
We have 57% room to run back to ATH, and we're sitting at 2-year support with $11 TRILLION in new capital about to enter through Vanguard.
🎯 Action Plan - What To Do RIGHT NOW
IF YOU'RE BULLISH (Recommended by AI Trading Mentor):
Set Alerts:
Alert at $128 (aggressive buy - wedge support test)
Alert at $133 (current - scale in point)
Alert at $138 (last entry before breakout)
Alert at $145 (take profit trigger)
IF YOU'RE BEARISH:
Wait for:
Close above $150 with volume (breakout confirmed)
Then enter on $145-148 retest
Safer but worse risk/reward
IF YOU'RE NEUTRAL:
Allocate 3-4% of portfolio (half position)
Enter at $130-135 only
Take profits at $155 (+19%)
This is the "I believe but I'm cautious" play
Final Thoughts - The Truth About This Setup
My AI trading mentor has analyzed thousands of setups.
Here's what I KNOW for certain on December 5, 2025:
✅ 439,938 SOL ($56M) removed from Coinbase Dec 2
✅ Vanguard ($11T) opened SOL ETFs Dec 2
✅ 13 institutions hold $1.72B SOL (1.44% supply)
✅ 91% ETF approval odds on Polymarket
✅ $120 support held for 2 years
✅ Falling wedge = 75% break upward historically
✅ $100B flowed into BTC after ETF approval
Here's what I DON'T know:
Will Vanguard inflows start immediately or take months?
Will whales keep accumulating or start distributing?
Will BTC hold or crash?
Drop a 🟣 if you're buying SOL at $130-135.
Drop a 🤖 if you're using AI to refine and help guide you with setups like this.
Drop a 🐋 if you're following whale accumulation.
Drop a 💰 if you're ready for $

NZD/USD Building Bullish Structure From DemandDespite recent corrective moves, NZD/USD is developing a strong bullish foundation as price continues to respect the major demand zone at the bottom of the chart. Each rejection from this zone shows clear evidence of institutional buying, with long wicks and aggressive recoveries indicating that sellers are losing power.
The rounded-top and earlier distribution worked mainly as a liquidity sweep, pulling price back into areas where large buyers were waiting. Now, price is forming a higher-low structure, suggesting accumulation rather than continuation of the downtrend. The presence of the Fair Value Gap (FVG 4H) below acts as a completed rebalancing area, giving room for a clean bullish expansion.
If price maintains stability above the buyer zone (0.5690–0.5700), we can expect a progressive move toward the mid-range resistance at 0.5740, and eventually a push back into the upper supply zone around 0.5800, which becomes the primary bullish target. Fresh liquidity is building above recent highs, providing the fuel needed for an upside continuation.
Overall, the market shows signs of accumulation, higher lows, and smart-money support, favoring a bullish continuation as long as price remains above the major demand zone.

RANGE BREAKOUT WITH RETEST & DOWNSIDE CONTINUATION SETUPRANGE BREAKOUT WITH RETEST & DOWNSIDE CONTINUATION SETUP
The EUR/GBP chart displays a well-defined market structure transition from accumulation ranges into a broader bearish cycle. Initially, the price moved through multiple tight ranges, indicating accumulation and liquidity building on both sides. Each breakout from these ranges created short-term bullish impulses, but the upward momentum consistently weakened as price approached the strong supply zone.
Once price tapped the major supply zone, selling pressure increased sharply, marking the start of a clean descending channel (seller zone). This channel represents controlled distribution by sellers, which pushed the market back below the previous mid-range support.
The most important structural event is the bearish breakout from the central range support. After the breakout, price returned for a textbook retest, where previous support flipped into resistance — a classic confirmation of bearish continuation.
The market is now positioned between key liquidity levels, and unless the retest zone is reclaimed, probability favors a continuation move towards the next support level. If this level breaks, further decline toward the lower support base becomes the next logical target.
Overall sentiment remains bearish, with sellers controlling the flow, and any long positions remain risky unless the market reclaims the broken support area and breaks structure to the upside.

Bitcoin Bullish Bitcoin will go long after breakout and retest with pin bar above 50 fib levels.
NOTE: This analysis involved technical analysis only no fundamental analysis involved.

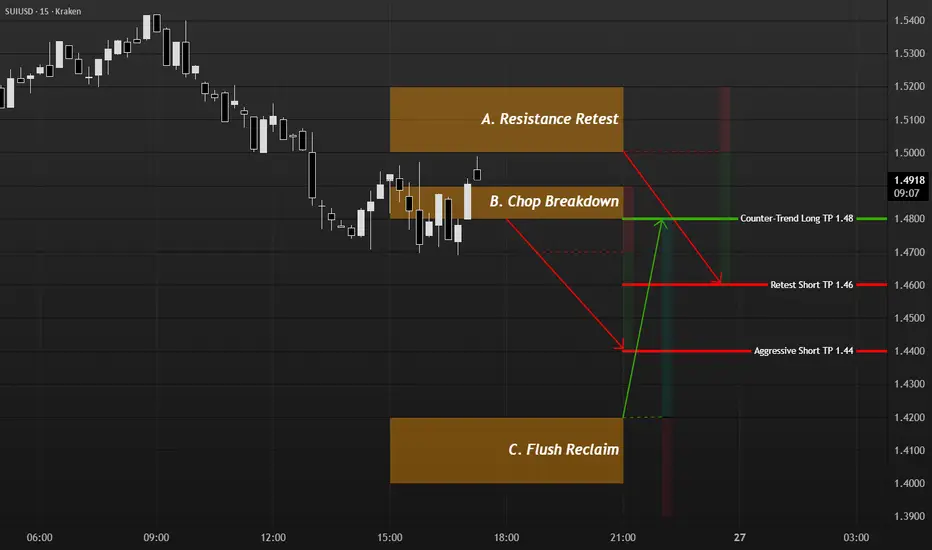
SUI intraday while BTC stallsBTC is chopping at key levels, so I’m not forcing trades there. Instead I’m using SUI on Kraken: strong push up from 1.33 to 1.55 on 24th, then clear distribution and break lower, which gives three structured ideas.
A. Base case: short a failed retest of 1.50–1.52 after rejection, invalidation above 1.54–1.55, targeting 1.46 then 1.42.
B. Aggressive: if price grinds under 1.48 and breaks, I look to sell a retest from below with the same invalidation and target at 1.44.
C. Counter-trend: I only consider a long after a sharp flush into 1.40–1.42 and a clean reclaim on 15m; below 1.40 the bounce idea is off.
This is a map, not signals. I size so a full stop costs about 0.5% of equity and take partial profits at the first target.
Gold Reload Zone… Bulls Waiting Patiently!📈Gold remains overall bullish, respecting both its rising structure and the major support zones beneath current price. After breaking above the light-blue resistance area, XAUUSD is now pushing higher, but a pullback remains very likely before the next impulse.
⚔️On the upcoming retest of the blue structure zone and the rising trendline, we will be looking for trend-following longs. This area has acted as support multiple times and now aligns with the bullish context, making it a high-probability buy zone.
🏹As long as Gold remains above the red demand area and respects the rising structure, the next wave upward toward the 4,385 resistance remains the most likely scenario. Only a clean break below the red zone would weaken the bullish outlook.
For now, patience is key… wait for the retest, then look for longs from structure. 🤔
⚠️ Disclaimer: This is not financial advice. Always do your own research and manage risk properly.
📚 Stick to your trading plan regarding entries, risk, and management.
Good luck! 🍀
All Strategies Are Good; If Managed Properly!
~Richard Nasr

PEPEUSDT is near major weekly support also trendline retest herePEPEUSDT appears to be concluding its bearish phase, with price action having breached a significant daily support level. The asset is now undergoing a critical retest of the broken trendline a common technical phenomenon where former Resistance(Red trendline) transforms into support . A successful rejection from this level could catalyze a robust bullish reversal. Based on the magnitude of the preceding decline and the strength of this support zone, we project a potential upward movement with an estimated appreciation target of 200% upon confirmed breakout confirmation.
DISCLAIMER: ((trade based on your own decision))
<<press like👍 if you enjoy💚

XAUUSD On the 1-hour chart, Gold is currently trading inside a tight symmetrical triangle, with price compressing between a rising trendline from the November 5th lows and a descending trendline from the November 14th highs.
Price is hovering around the $4,070 zone, which also aligns with the 50-period moving average, showing indecision but increasing pressure for a breakout.
A break and retest above the $4,085–4,095 resistance zone (highlighted in grey) may trigger a bullish momentum wave. The projected breakout target points toward the $4,180–4,220 region, based on the measured move from the previous swing.
As long as price holds above the rising trendline support, the structure remains bullish, with buyers expected to step in on any retest of support.

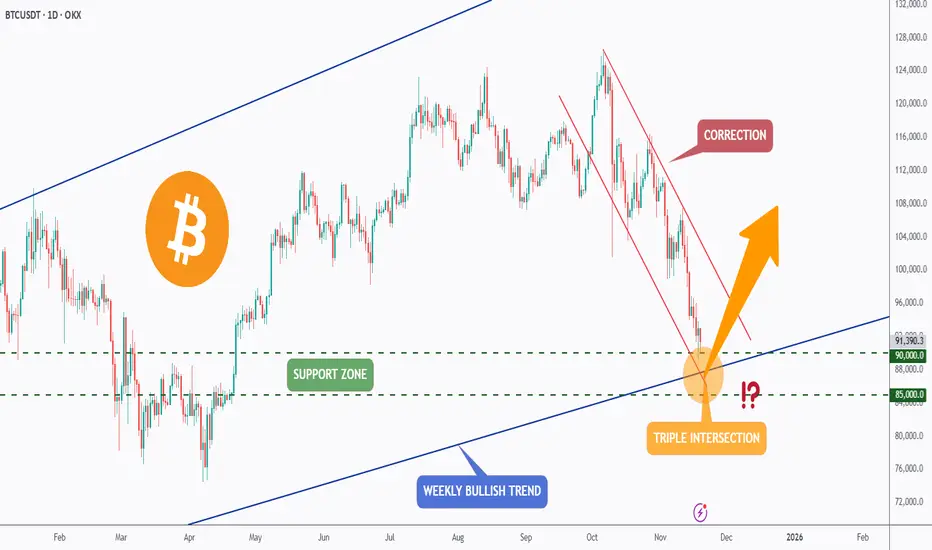
BTC - Triple Intersection… Now or Never for the Bulls?Bitcoin has been in a steep correction for weeks, sliding inside a clear falling channel. Despite the heavy sell-off, price is now approaching one of the strongest confluence zones on the entire chart, a triple intersection.
This key level combines:
1- The major weekly bullish trendline
2- The horizontal support between $85,000–$90,000
3- And the lower boundary of the falling corrective channel
This kind of alignment doesn’t happen often. It’s the area where long-term bulls typically show up.
As long as BTC holds above $85,000–$90,000, the macro bullish structure remains intact. A strong reaction here could trigger a reversal and kick off the next impulsive wave upward. However, if this triple confluence fails, the market may face a deeper correction before stabilising.
We’re standing at a decisive moment… will this zone ignite the next bullish leg or break down into another wave of fear? 🤔
⚠️ Disclaimer: This is not financial advice. Always do your own research and manage risk properly.
📚 Stick to your trading plan regarding entries, risk, and management.
Good luck! 🍀
All Strategies Are Good; If Managed Properly!
~Richard Nasr.
Uptrend Retest PlayGold has continued to maintain a strong bullish structure on the 15-minute timeframe, creating a series of higher highs and higher lows while respecting the ascending trendline that has been guiding the current uptrend. After an initial impulsive move to the upside, price broke above a key intraday resistance level, confirming buyer strength and shifting that previous resistance into a fresh support zone.
Following the breakout, price is now pulling back toward a high-probability demand area where multiple technical factors converge. This zone aligns with:
1️⃣ The retest of the prior resistance, now acting as support.
2️⃣ The ascending trendline, which has been consistently defended by buyers.
3️⃣ A small liquidity sweep, as price has dipped below a minor intraday low to collect resting sell-side liquidity.
4️⃣ A fresh demand block, created by the last bullish candle before the recent impulsive breakout.
These elements together form a strong confluence area where buyers have historically been active, suggesting the market may be preparing for another bullish continuation leg. If price reacts positively within the blue entry zone and forms bullish confirmations (rejection wicks, displacement candles, or a break in micro-structure), the probability of continuation toward the marked upside target increases significantly.
Moreover, the broader trend remains intact, with no break of structure to the downside. As long as price continues to respect the support zone and the trendline, the bullish bias remains valid. This pullback should be viewed as a corrective move within a trending market rather than a reversal, and deeper retracements into the demand region may provide even higher-quality entries for traders waiting for confirmation.
Overall, current conditions favor bulls as long as support holds. A strong reaction from the entry zone could lead to renewed momentum and an attempt to push toward the next liquidity level and the projected target above.

EURUSD SELL NOW Script Name - EURUSD
Position - SELL SIDE
Time frame :
Monthly - Coming to support
Day - Descending Channel Forming and market in Top
1Hr - Breakout the Structure
Entry - 1.16136
Target - 1.14823
Stoploss - 1.16560
This view only for Eduactional Purpose
Happy Trading ...

ICP - After a 250% Explosion, What’s Next?🚀ICP has just witnessed a massive parabolic rally , surging by over 250% in just a few days, an incredible move that pushed the price into overextended territory.
📉Now, after such a vertical climb, a healthy correction is unfolding. The area highlighted in red represents a major demand zone, where previous consolidation took place before the explosive breakout.
🏹As price retraces toward this zone, I’ll be looking for potential long opportunities, expecting buyers to step back in and push ICP higher, possibly toward new local highs in the coming weeks.
Could this correction be the perfect reload before the next leg up? 🔥
⚠️ Disclaimer: This is not financial advice. Always do your own research and manage risk properly.
📊All Strategies Are Good; If Managed Properly!
~Richard Nasr

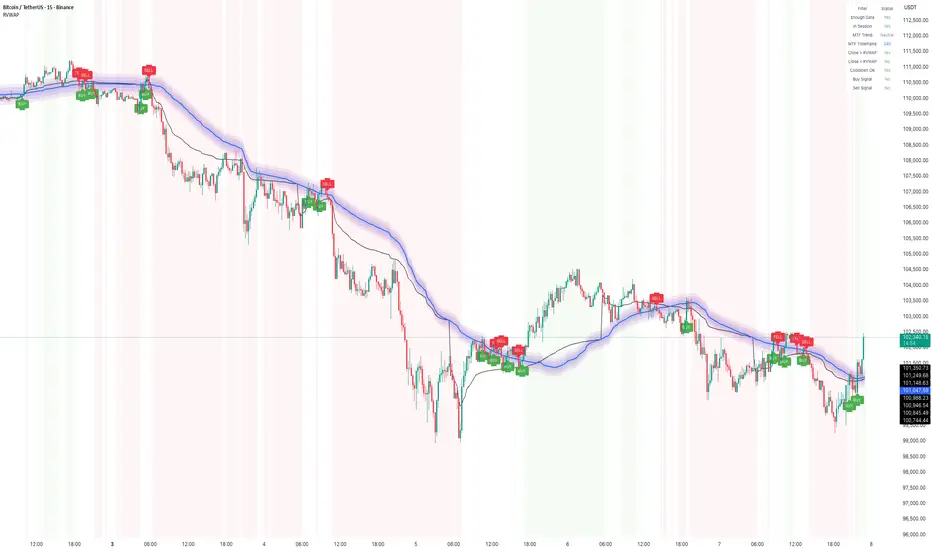
How to Use Rolling VWAP – Early US Session Trend TrackerIn today’s BTC/USDT 15-min chart, the Rolling VWAP perfectly captured the directional bias throughout the session.
The smooth transition between compression and expansion phases clearly aligned with VWAP slope shifts — giving multiple early signals during the US market open, when volatility tends to expand sharply.
Performance Highlights
• The indicator tracked clean trend waves with minimal lag, showing how price respected the VWAP envelope dynamically.
• BUY and SELL zones were well-defined, with fading reversals quickly replaced by trend-aligned setups.
• Session filter (US Market) ensured signals appeared primarily during active volatility windows, avoiding false setups during low-volume hours.
• The rolling nature of VWAP (instead of session-based VWAP) allowed continuous trend capture across intraday transitions.
Additional Notes
1. Cooldown Setting:
Currently set to 1 candle — which makes the chart more responsive but slightly denser with signals.
Increasing it (e.g., to 3–5 bars) can make the chart cleaner, though some reversal entries may not display visually even though they’re logically detected.
2. US Session Filter:
The logic focuses on the early US market phase, effectively capturing directional bursts when liquidity and volatility spike — ideal for short-term scalping or trend continuation setups.
⸻
🧠 Tip:
Combine the Rolling VWAP bias with higher-timeframe structure (e.g., 1H trend) for even more reliable directional trades.
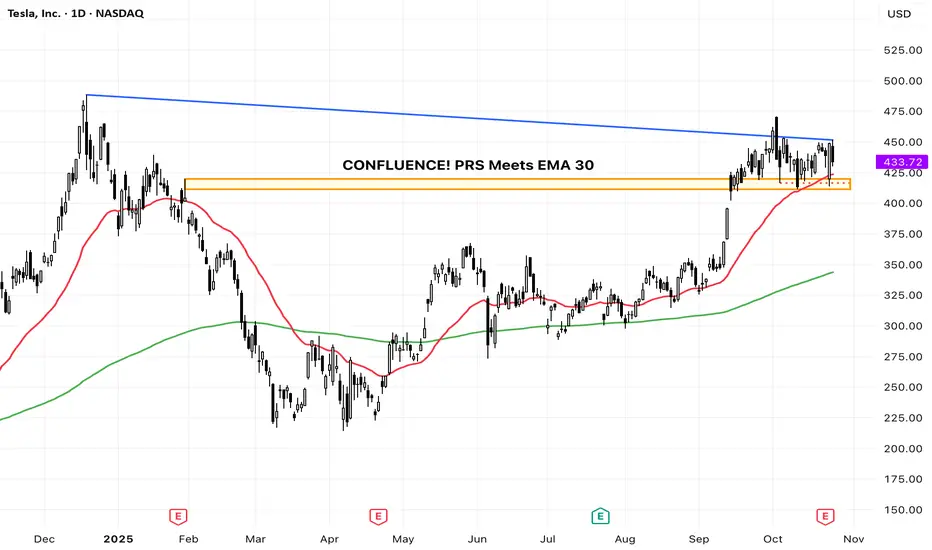
TSLA: Watching Prior Resistance Turn into Key SupportIntroduction & Thesis
Tesla ( NASDAQ:TSLA ) is currently presenting a textbook technical setup on the daily chart. After a strong uptrend from May to October, the price has pulled back to a critical zone that previously acted as heavy resistance in early 2025. This analysis explains why this level is a crucial 'make-or-break' point for the bulls.
The Breakout and The Retest
Observe the orange rectangle (approx. $410 - $425). This region was a significant ceiling for the price action earlier this year. According to technical theory, once a strong resistance level is decisively broken (which occurred in September), it is expected to flip its role and become a crucial support level. This is often referred to as a Prior Resistance Turned Support (PRS) area.
The price is currently pulling back right into this PRS zone, a common and healthy movement known as a retest.
Confluence of Support
Crucially, the 30-day Exponential Moving Average (EMA 30), which defines the short-term trend, is also converging with this key support zone. This creates a powerful confluence of support, significantly increasing the probability of a bounce. The long-term trend, indicated by the upward-sloping 200-day EMA (green line), remains firmly bullish, supporting the overall upward bias.
Scenarios
🎯 Bullish Scenario (The Bounce)
If the $410 - $425 zone holds and we see a strong bullish rejection candle (e.g., a hammer or engulfing pattern), it would confirm the support flip, suggesting the next leg of the rally towards the recent highs around $475.
🛑 Bearish Scenario / Invalidation (The Failure)
Conversely, a sustained daily close below $410 would be a crucial failure signal. This would invalidate the bullish retest thesis and suggest a deeper correction is underway, likely targeting the next major support zone around the 200-day EMA (currently near the $343 region).
📚 Educational Takeaway
This setup perfectly illustrates how traders look for confluence. The strongest support zones are those where multiple technical factors—like a former resistance level (PRS) and a strong moving average (EMA 30)—converge. A successful bounce here reinforces the power of market structure principles.
(Disclaimer: This is for educational purposes only and not financial advice.)
Stage Analysis of ORISSAMINEStock has formed a good base after stage 4 and gave a breakout after 6 months of consolidation with huge volume.
It is now coming in stage 2 after breakout.

EURNZD trend breakout and start of correctionEURNZD has broken below the ascending channel and confirmed the breakout under 2.0350. This indicates the start of a corrective phase. Downside targets are 2.0190, 2.0020, and 1.9860. As long as the price stays below the confirmation zone, sellers dominate the market. A return above 2.0370 would cancel the bearish outlook and restore the upward trend.
The New Zealand dollar remains supported by stable macroeconomic data and expectations that the RBNZ will maintain tight policy longer than the ECB. Meanwhile, the euro faces pressure from weak industrial performance and sluggish recovery across the eurozone. These factors favor further downside for EURNZD.
Following the breakout and confirmation, EURNZD is likely to continue its correction. As long as the price remains below 2.0350, the bias stays bearish with targets at 2.0190, 2.0020, and 1.9860.

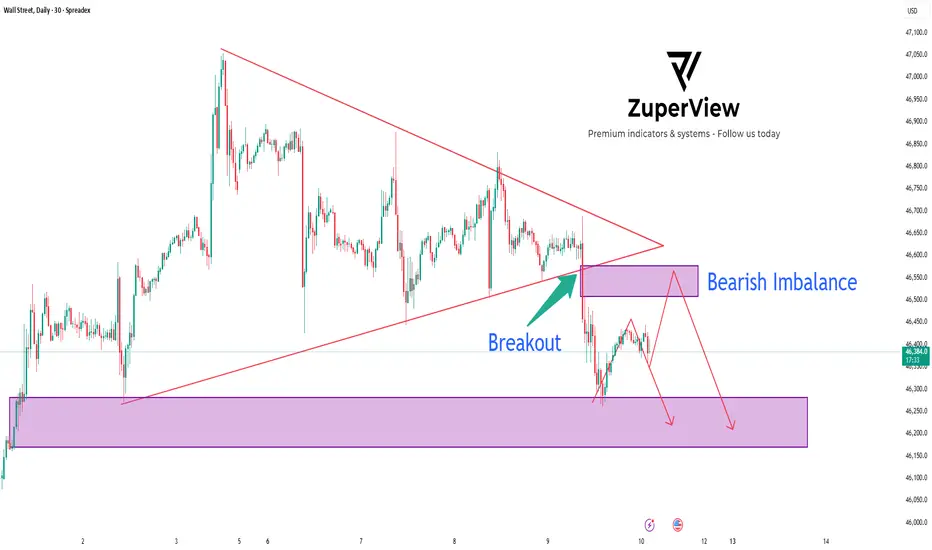
US30: Triangle breakout signal deeper sell move
📉 US30 Analysis: 4-Layer Resistance, Bearish Imbalance & Triangle Breakout | TradingView
The SPREADEX:DJI just printed a clean bearish breakout from a symmetrical triangle pattern on the 30-minute chart 🕒.
What makes this setup stand out is the 4-layer resistance zone perfectly overlapping with a Bearish Imbalance, creating a strong confluence for a potential continuation to the downside.
________________________________________
🧠 Technical Overview
On TradingView, the chart shows multiple lower highs forming inside a symmetrical triangle — a sign of buying exhaustion and seller accumulation. After several attempts, price finally broke below the structure, confirming a bearish market shift.
Key zones:
🔴 4-Layer Resistance: 46,850 → 46,550
⚫ Bearish Imbalance: 46,500 – 46,550
🟣 Demand Zone / Support: 46,150 – 46,250
Each resistance layer acted as a rejection point, showing how Smart Money continues to distribute orders and defend that area aggressively.
________________________________________
📊 Breakout – Retest – Continuation Setup
Following the breakout, price made a quick pullback to retest the 4-layer resistance zone — right where the Bearish Imbalance sits.
This is a textbook Breakout–Retest–Continuation pattern on TradingView, confirming that sellers are still in control.
1️⃣ Breakout: Price breaks below the triangle.
2️⃣ Retest: Price retraces to test the 4-layer resistance and imbalance.
3️⃣ Continuation: Strong rejection signals the next bearish leg.
________________________________________
💡 Trading Plan
Our trading plan for this setup is straightforward. I’m waiting for price to retest the 46,500–46,550 zone and show clear signs of rejection — such as a bearish engulfing candle or a break of structure on lower timeframes.
If confirmed, I’ll look to enter a short position targeting the Demand Zone around 46,150–46,250.
A stop loss would be placed just above 46,650, beyond the resistance cluster, to protect against false breakouts.
This plan aligns perfectly with Smart Money Concept (SMC) and Price Action trading, offering a strong risk-to-reward ratio 📈.
________________________________________
🧩 Market Psychology
✅ The four consecutive rejections at the same price zone clearly show how institutional traders are defending supply levels.
✅ Every time price pushes higher, Smart Money sells into liquidity, leaving wicks and imbalances behind.
✅ This behavior reinforces the bearish bias and supports the idea of a continued drop once short-term liquidity is collected.
________________________________________
🔎 Summary
✅ Bearish breakout confirmed from the triangle pattern
🔴 Strong 4-layer resistance overlapping with Bearish Imbalance
📉 Expecting price to continue toward the lower Demand Zone
This setup is clean, confluence-rich, and ideal for traders using TradingView, Price Action, and Smart Money Concepts.
A well-timed short from this zone could deliver a high-probability trade with excellent structure confirmation 🔥.
Please like and comment below to support our traders. Your reactions will motivate us to do more analysis in the future 🙏✨
Harry Andrew @ ZuperView
USDCHF 1D – the dollar wakes upAfter a long decline, the pair finally shows some life - on the daily chart we have a clean breakout from the falling wedge followed by a retest.
Price now holds inside the buy zone (0.795–0.803) - the perfect base for a potential bullish move.
Technically, the setup looks solid:
✅ breakout confirmed
✅ retest completed
✅ volume rising
✅ momentum turning bullish
The first resistance sits at 0.808, where a minor pause could appear.
If buyers hold control above that level - the path to 0.823 (1.618) and later 0.848 (2.618) opens up nicely.
Structure remains bullish as long as the buy zone stays intact.
And remember: you don’t fight the wedge - you ride the breakout.

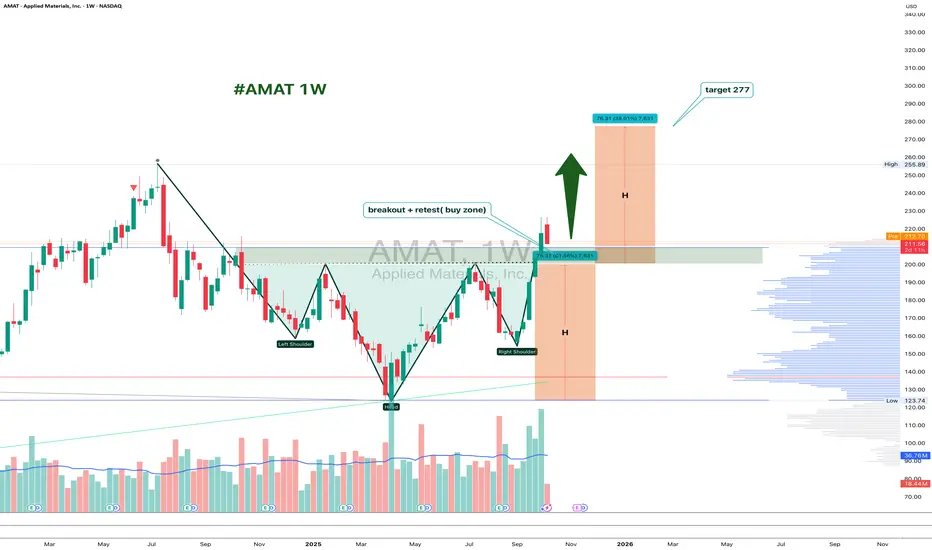
AMAT 1W: Retesting the Neckline Before the Next Move?On the weekly chart, Applied Materials (AMAT) has completed a clean inverted head and shoulders breakout around $226, and is now pulling back to retest the neckline zone near $200–211.
This area acts as strong support. If buyers defend it, the bullish pattern stays valid, with a projected target around $277, matching the 1.618 Fibonacci extension.
From a fundamental perspective, AMAT remains a key semiconductor player, benefiting from ongoing demand for chip-making equipment. The pullback looks more like a healthy pause than weakness - a classic chance for latecomers to re-enter.
Funny enough, the “head and shoulders” pattern, known for signaling tops, is doing the exact opposite here - apparently, even the market likes a good plot twist.
Meta platforms, D ( Channel + 2 Fibonacci Extensions up & down )Hey Traders and Investors, I hope you all are doing well in your life.
market is nature's response and Price is the God .
Let's check the market with the help of natural levels tool : Trend Based Fibonacci Extension in addition with Trend Channel .
After forming almost a ' Head and Shoulders ' pattern on Daily chart, Meta platforms has given a pull-back ( base for Fib-Extension UP level tool on the right side , $690.51 ).
The Pull-back trend expect to continue till the retest level of 23.6% ( $765 ) of Fib-Extension UP level tool on the right side .
The most near level for the re-test is the 50% level ( $664.14 ) of Fib-Extension Down level tool on the left side , for a new UP trend Entry ( investors ).
Note: The marked Circle ⭕ enclosed candle is the important level candle, Up Trend channel's 50% trend line is intersecting with 23.6% of Fib-Extension UP level tool on the right side .
Keep on checking this Level for your future trading decisions.
" Buy 🟢 "above $731 with the stop loss🔻of $690 for the
🎯 Target 1: $765
🎯 Target 2: $811
🎯 Target 3: open.
" Sell 🔴 " below $664 with the stop loss🔺of $690 for the
🎯 Target 1: $634
🎯 Target 2: $590
🎯 Target 3: open.
Smart Levels is Smart Trading 👨🎓
⚠ RISK DISCLAIMER :
All content provided by "TradeWithKeshhav" is for information & educational purposes only.
It does not constitute any financial advice or a solicitation to buy or sell any securities of any type. All investments / trading involve risks. Past performance does not guarantee future results / returns.
Always do your own analysis before taking any trade.
Regards :
Team @TradeWithKeshhav
Happy Trading and Investing!
Still Bullish but ..PSO CMP 415.97 (12-08-2025 12:47PM)
Still Bullish but it may re-test its breakout level around 380 - 405.
Upside Targets Intact.
Important to Cross & Sustain 435 - 437 for further Upside.

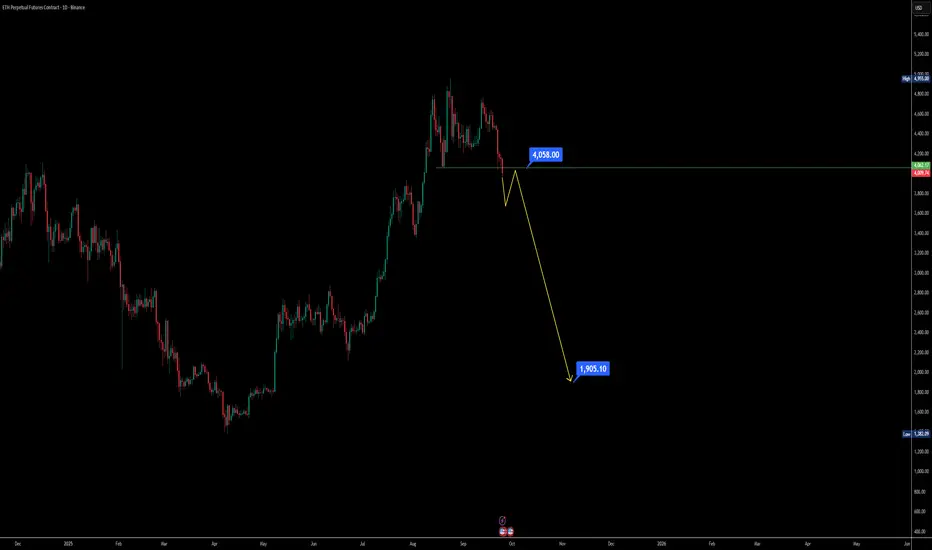
Ethereum Daily Chart Distribution Phase Signals huge dumpIf you’ve been tracking Ethereum on the daily chart, the structure is starting to look heavy — and not in a bullish way. Let’s break this down step by step so it’s easy to follow 👇
Support lost: ETH has already broken its key support zone around $4060, which previously acted as a higher low. Now, the recent dip is printing a new lower low, shifting market sentiment.
Daily close levels matter: If the daily candle closes below $4000, it confirms weakness and opens doors for a further sell-off.
Possible head and shoulders: A pullback toward the $4100 region could simply build the right shoulder of a bearish head and shoulder pattern. The structure matches what we saw earlier on the left shoulder.
Bearish momentum risk: If ETH fails to hold above $4000 after that pullback, we could be looking at extended downside — even a sharp fall toward the $2000 zone based on historical dump patterns.
Market behavior reminder: Over the past two years, whenever ETH started a distribution breakdown, the drop was often fast and violent. That’s why caution is key here.
📌 Key Takeaway: Ethereum is at a make-or-break daily level. Watch $4000 closely — losing this level could accelerate a bearish breakdown. Short-term traders may look for opportunities on the pullback, while long-term holders need to stay cautious of the possible head and shoulders pattern forming.