Beautiful Breakout & Re-test also done.EFERT Analysis
Closed at 255.08 (23-01-2026)
Beautiful Breakout & Re-test also done.
Immediate Targets seems to be around 279 - 280.
However, it has the potential to touch 340+
Breaking 237 may lead it towards 230 - 232.
Retest-structure

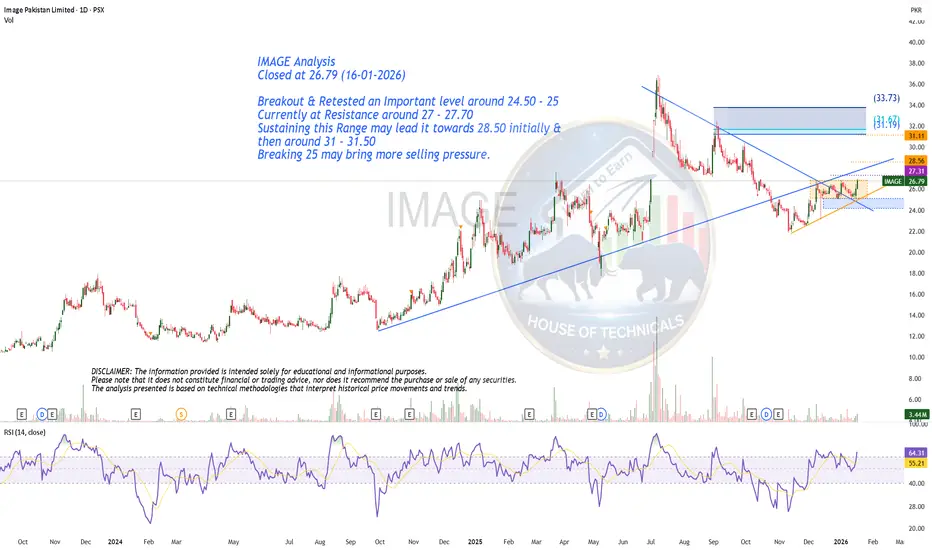
Breakout & Retest!IMAGE Analysis
Closed at 26.79 (16-01-2026)
Breakout & Retested an Important level around 24.50 - 25
Currently at Resistance around 27 - 27.70
Sustaining this Range may lead it towards 28.50 initially &
then around 31 - 31.50
Breaking 25 may bring more selling pressure.
Zcash: Mapping the Multi-Layer Retest | Path to Trendline RetestZcash will enter a critical decision phase if price falls and holds under $491, which suggests a potential shift in momentum that places us in a consolidation range. We would then be operating within a consolidation box potentially. My focus is on the multi-layered support structure below us.
Near-Term Bullish Structure: We must hold the $473–$479 area. A bounce and break back above the 490s here keeps the immediate momentum intact.
The Fake-out Risk: Watch $468 closely. "Prior highs become support" logic suggests a bounce point, Could be a potential fake-out zone to catch late shorts chasing a trendline breakdown—don't get trapped.
The Mid-Layer: Below the potential fake-out zone, we have a secondary structural layer encompassing the prior and secondary highs.
The Macro Target: The actual trendline retest—and the highest-probability entry—sits in the $432–$435 confluence zone. This is the 3rd layer where the full breakout logic is truly tested.
⚠️ Risk Management & Invalidation
While the outlook remains constructive above the trendline, we must respect the downside risk:
The Red Flag: If price falls and closes under $425, the bullish retest thesis is under significant pressure.
Structural Breakdown: A break under the $390–$405 zone would suggest that the probability of a further breakdown has increased significantly.
The "C-Wave" Scenario: Losing the $390 level could trigger a major C-Wave correction, potentially leading to a deep retracement as low as the mid-$200s.

Bitcoin Bullish Bitcoin will go long after breakout and retest with pin bar above 50 fib levels.
NOTE: This analysis involved technical analysis only no fundamental analysis involved.

PEPEUSDT is near major weekly support also trendline retest herePEPEUSDT appears to be concluding its bearish phase, with price action having breached a significant daily support level. The asset is now undergoing a critical retest of the broken trendline a common technical phenomenon where former Resistance(Red trendline) transforms into support . A successful rejection from this level could catalyze a robust bullish reversal. Based on the magnitude of the preceding decline and the strength of this support zone, we project a potential upward movement with an estimated appreciation target of 200% upon confirmed breakout confirmation.
DISCLAIMER: ((trade based on your own decision))
<<press like👍 if you enjoy💚

XAUUSD On the 1-hour chart, Gold is currently trading inside a tight symmetrical triangle, with price compressing between a rising trendline from the November 5th lows and a descending trendline from the November 14th highs.
Price is hovering around the $4,070 zone, which also aligns with the 50-period moving average, showing indecision but increasing pressure for a breakout.
A break and retest above the $4,085–4,095 resistance zone (highlighted in grey) may trigger a bullish momentum wave. The projected breakout target points toward the $4,180–4,220 region, based on the measured move from the previous swing.
As long as price holds above the rising trendline support, the structure remains bullish, with buyers expected to step in on any retest of support.

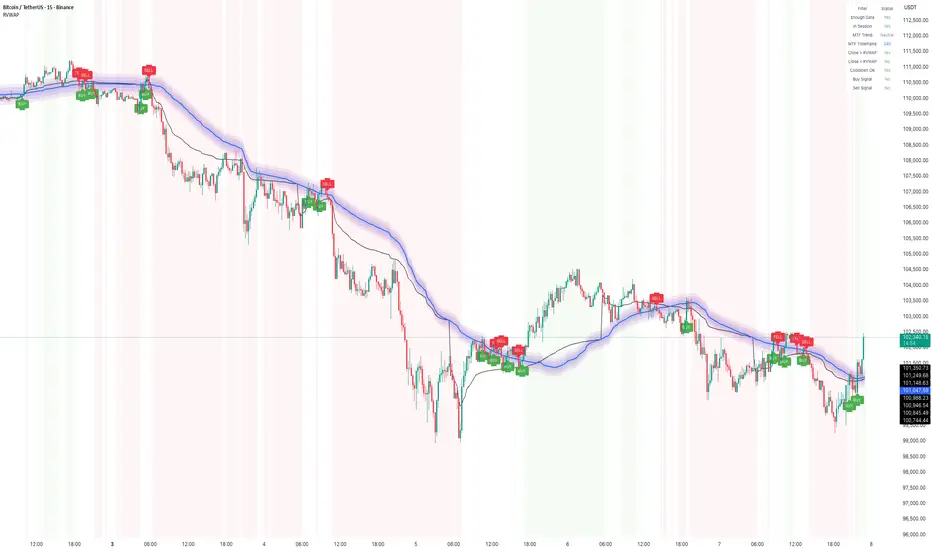
How to Use Rolling VWAP – Early US Session Trend TrackerIn today’s BTC/USDT 15-min chart, the Rolling VWAP perfectly captured the directional bias throughout the session.
The smooth transition between compression and expansion phases clearly aligned with VWAP slope shifts — giving multiple early signals during the US market open, when volatility tends to expand sharply.
Performance Highlights
• The indicator tracked clean trend waves with minimal lag, showing how price respected the VWAP envelope dynamically.
• BUY and SELL zones were well-defined, with fading reversals quickly replaced by trend-aligned setups.
• Session filter (US Market) ensured signals appeared primarily during active volatility windows, avoiding false setups during low-volume hours.
• The rolling nature of VWAP (instead of session-based VWAP) allowed continuous trend capture across intraday transitions.
Additional Notes
1. Cooldown Setting:
Currently set to 1 candle — which makes the chart more responsive but slightly denser with signals.
Increasing it (e.g., to 3–5 bars) can make the chart cleaner, though some reversal entries may not display visually even though they’re logically detected.
2. US Session Filter:
The logic focuses on the early US market phase, effectively capturing directional bursts when liquidity and volatility spike — ideal for short-term scalping or trend continuation setups.
⸻
🧠 Tip:
Combine the Rolling VWAP bias with higher-timeframe structure (e.g., 1H trend) for even more reliable directional trades.
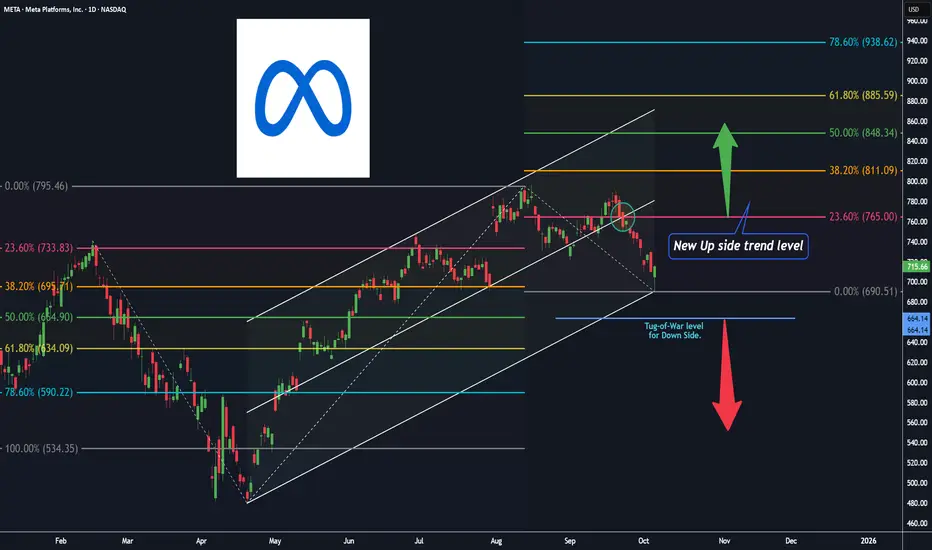
Meta platforms, D ( Channel + 2 Fibonacci Extensions up & down )Hey Traders and Investors, I hope you all are doing well in your life.
market is nature's response and Price is the God .
Let's check the market with the help of natural levels tool : Trend Based Fibonacci Extension in addition with Trend Channel .
After forming almost a ' Head and Shoulders ' pattern on Daily chart, Meta platforms has given a pull-back ( base for Fib-Extension UP level tool on the right side , $690.51 ).
The Pull-back trend expect to continue till the retest level of 23.6% ( $765 ) of Fib-Extension UP level tool on the right side .
The most near level for the re-test is the 50% level ( $664.14 ) of Fib-Extension Down level tool on the left side , for a new UP trend Entry ( investors ).
Note: The marked Circle ⭕ enclosed candle is the important level candle, Up Trend channel's 50% trend line is intersecting with 23.6% of Fib-Extension UP level tool on the right side .
Keep on checking this Level for your future trading decisions.
" Buy 🟢 "above $731 with the stop loss🔻of $690 for the
🎯 Target 1: $765
🎯 Target 2: $811
🎯 Target 3: open.
" Sell 🔴 " below $664 with the stop loss🔺of $690 for the
🎯 Target 1: $634
🎯 Target 2: $590
🎯 Target 3: open.
Smart Levels is Smart Trading 👨🎓
⚠ RISK DISCLAIMER :
All content provided by "TradeWithKeshhav" is for information & educational purposes only.
It does not constitute any financial advice or a solicitation to buy or sell any securities of any type. All investments / trading involve risks. Past performance does not guarantee future results / returns.
Always do your own analysis before taking any trade.
Regards :
Team @TradeWithKeshhav
Happy Trading and Investing!
Still Bullish but ..PSO CMP 415.97 (12-08-2025 12:47PM)
Still Bullish but it may re-test its breakout level around 380 - 405.
Upside Targets Intact.
Important to Cross & Sustain 435 - 437 for further Upside.

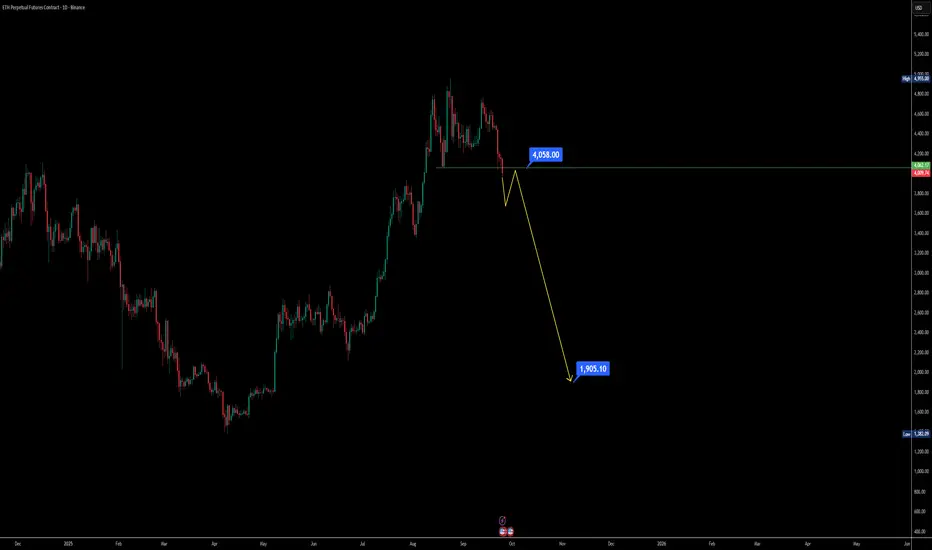
Ethereum Daily Chart Distribution Phase Signals huge dumpIf you’ve been tracking Ethereum on the daily chart, the structure is starting to look heavy — and not in a bullish way. Let’s break this down step by step so it’s easy to follow 👇
Support lost: ETH has already broken its key support zone around $4060, which previously acted as a higher low. Now, the recent dip is printing a new lower low, shifting market sentiment.
Daily close levels matter: If the daily candle closes below $4000, it confirms weakness and opens doors for a further sell-off.
Possible head and shoulders: A pullback toward the $4100 region could simply build the right shoulder of a bearish head and shoulder pattern. The structure matches what we saw earlier on the left shoulder.
Bearish momentum risk: If ETH fails to hold above $4000 after that pullback, we could be looking at extended downside — even a sharp fall toward the $2000 zone based on historical dump patterns.
Market behavior reminder: Over the past two years, whenever ETH started a distribution breakdown, the drop was often fast and violent. That’s why caution is key here.
📌 Key Takeaway: Ethereum is at a make-or-break daily level. Watch $4000 closely — losing this level could accelerate a bearish breakdown. Short-term traders may look for opportunities on the pullback, while long-term holders need to stay cautious of the possible head and shoulders pattern forming.
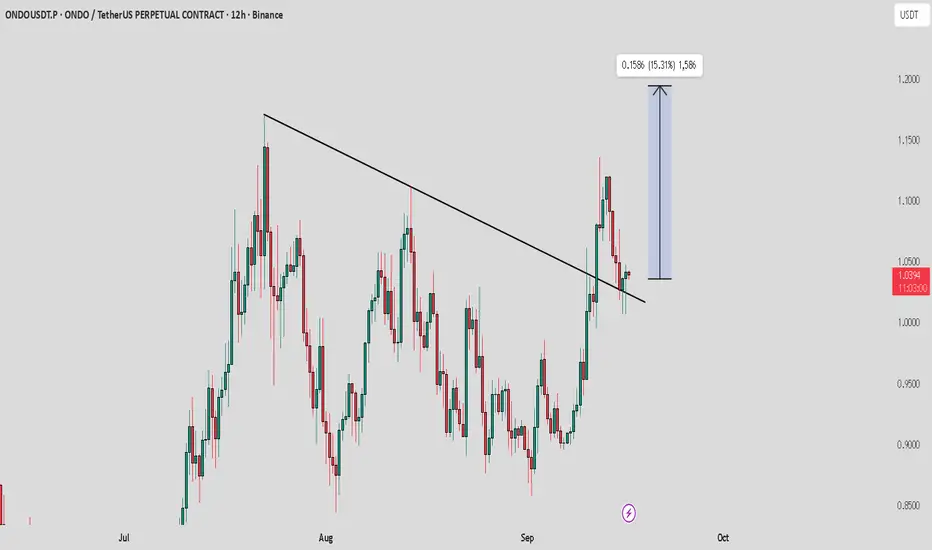
ONDO / USDT : Retest successful , Strong rally aheadONDO/USDT after a successful retest is now ready for a strong rally towards $1.20 – $1.40.
📌 Manage risk wisely.
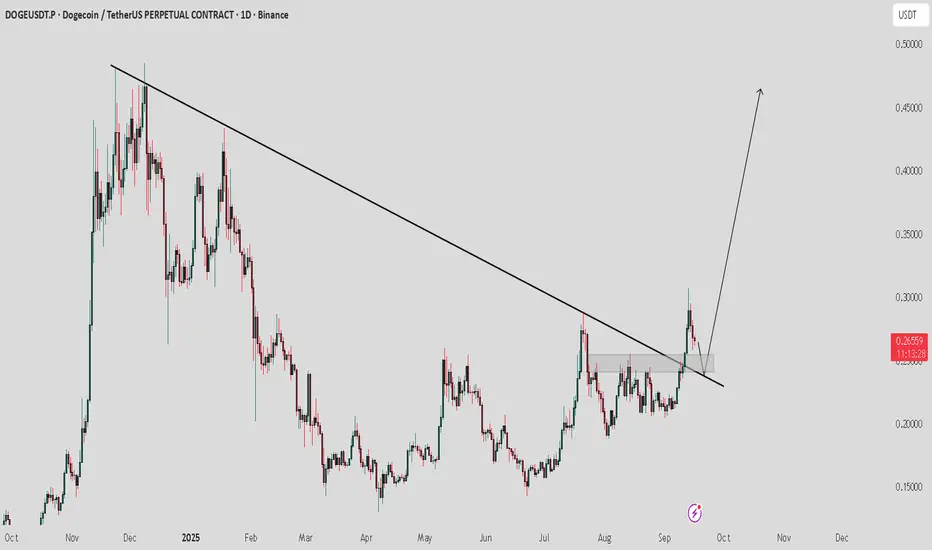
DOGE / USDT : Expecting strong move after successful retestDOGE/USDT has broken out from trendline resistance with strong potential. Currently, a retest is in progress — a successful retest could trigger a bullish rally towards $0.40 – $0.50.
📌 Always wait for confirmation of the bullish move and manage risk wisely.
ROSE / USDT : Bullish rally ahead after successful retestROSE/USDT has broken out of trendline resistance and is now heading for a retest of the breakout zone. If this retest holds successfully, price could rally toward $0.045.
📌 Always wait for clear confirmation of a bullish move before entering. Manage risk wisely.

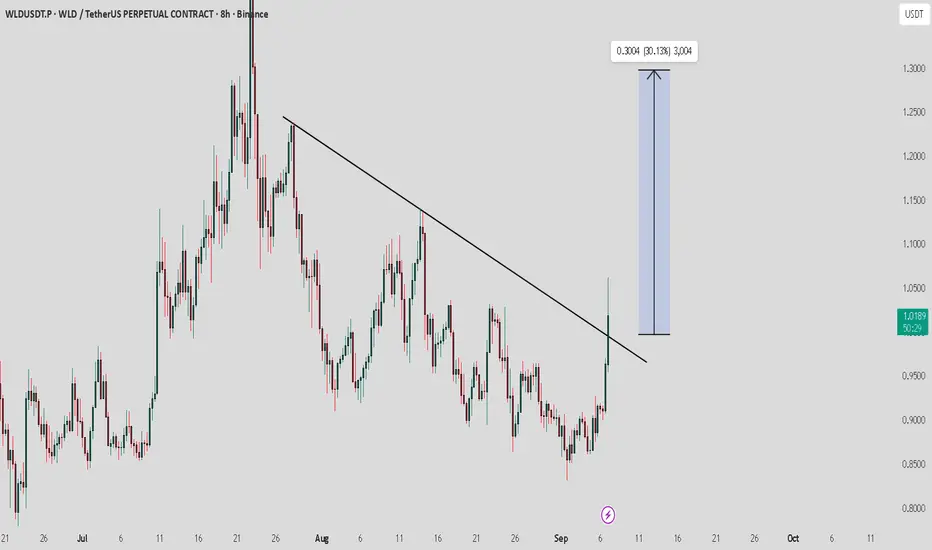
WLD / USDT : Breaking out with strong potentialWLD/USDT is breaking out of trendline resistance with strong potential. This breakout could signal the start of a strong rally ahead.
If the breakout holds, the next upside targets are $1.10 – $1.20 – $1.30. A successful retest would further strengthen this setup.
Always wait for a clear bullish signal and candle close to avoid fakeouts. Manage risk wisely before entering.
BANK / USDT: Retest is in progress ,Expecting bullish rally soonBANK/USDT has broken out of the symmetrical triangle pattern and is currently in the retest phase. If this retest holds, price could rally toward the $0.10 target.
Best approach: Wait for bullish confirmation before entering. Always trade smartly with proper risk management and in line with market conditions.

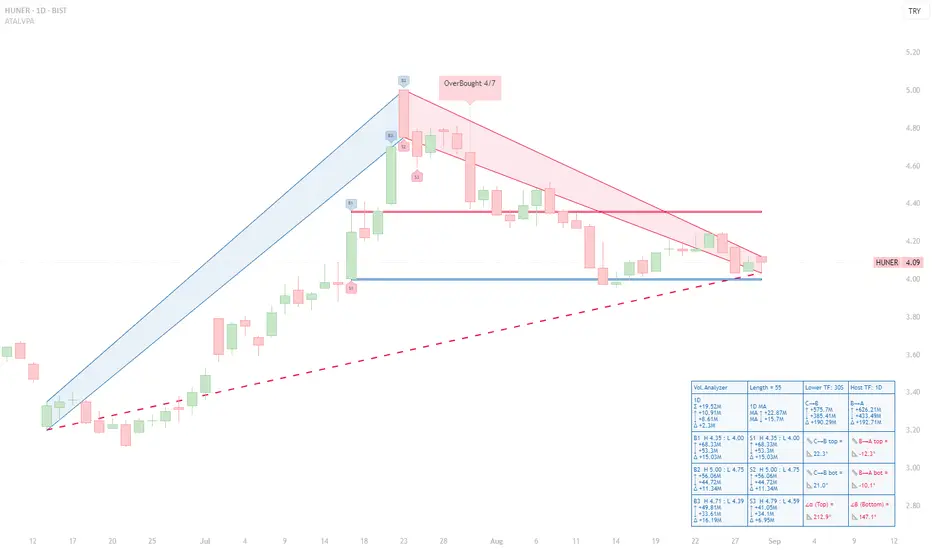
HUNER (1D) — Seller Bias After OB Cluster; Descending BA SlopesHUNER (1D) — Seller Bias After OB Cluster; Descending BA Slopes, 4.00 Support Under Test
Executive read (VPA, 55-bar window)
◉ OB/OS: An OverBought 4/7 tag printed at the apex; no confirmed OS on the right edge. That OB cluster preceded the entire red B→A leg and frames the current risk.
◉ Ranked volume peaks (Top-3):
- B1 (H 4.35/L 4.00) ↑ 68.33M, ↓ 53.3M, Δ +15.03M.
- B2 (H 5.00/L 4.75) ↑ 56.06M, ↓ 44.72M, Δ +11.34M.
- B3 (H 4.71/L 4.39) ↑ 49.81M, ↓ 33.61M, Δ +16.19M.
- S3 (H 4.79/L 4.59) ↑ 41.05M, ↓ 34.1M, Δ +6.95M.
Takeaway: Buying peaks were heavy, but subsequent price action failed to sustain higher highs; sellers have since controlled the B→A leg.
◉ Segment diagnostics:
- C→B advance: top/bottom slopes +22.3° / +21.0° → mature but constructive.
- B→A decline: top/bottom slopes –12.3° / –10.1° → persistent downside pressure.
- Orientation at B: α 212.9° (red) / β 147.1° (red) confirm the bearish state of the current swing geometry.
◉ Levels & structure:
- Support: the S1 low ≈ 4.00 is the active horizontal shelf repeatedly defended.
- Resistance: 4.35 (B1/S1 pivot), 4.71–4.79 (B3/S3 band), then 5.00 (B2). The descending B→A trendline caps bounces before these levels.
Actionable interpretation (educational):
Bias stays bearish-to-neutral while price trades beneath the B→A upper line and below 4.35. A credible shift would require (i) a fresh B-ranked bar with positive Δ near the right edge, and (ii) a close back above the B→A top. Failure to reclaim 4.35 after bounces leaves 4.00 vulnerable; a daily close below 4.00 would validate extension into the S-zones. Conversely, an OS print near 4.00 coupled with flattening BA slopes would set up a tactical mean-reversion toward 4.35 → 4.71/4.79.
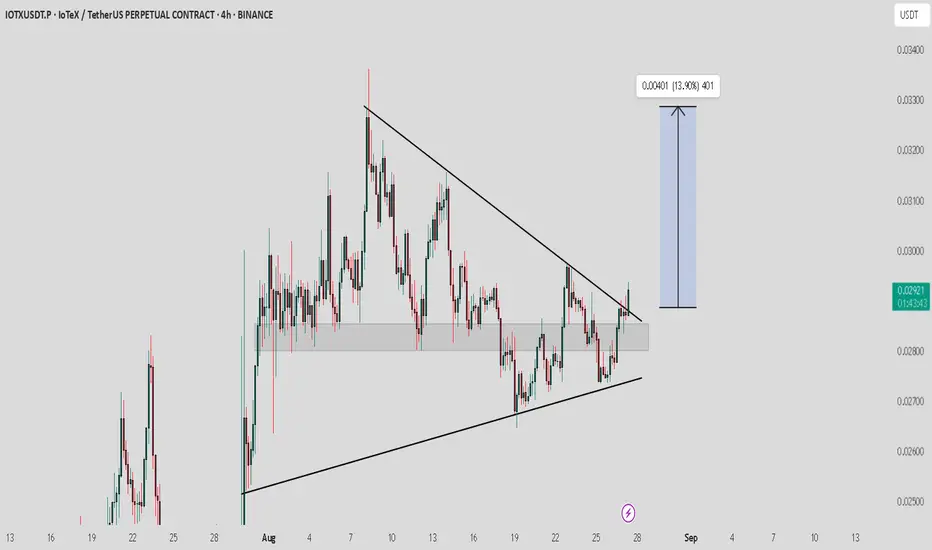
IOTX / USDT : Breaking out from symmetrical triangleIOTX/USDT has broken out from the symmetrical triangle. The key now is confirmation — a retest of the breakout zone may occur before continuation. If this level holds, price could rally toward the $0.0315 – $0.033 zone (+13–15%).
Trade Setup:
Entry: On successful retest hold / bullish confirmation candle above $0.030
Targets: $0.0315 – $0.033
Stop-Loss: Below $0.028 (breakout zone invalidation)
Best strategy: Wait for retest confirmation to avoid getting trapped in a false breakout.
EIGEN / USDT : Keep a close watch on retest processEIGEN/USDT – Bullish Breakout Potential
EIGEN has broken the descending resistance trendline, signaling a possible upward move. The current breakout shows strong bullish momentum with a target of around 0.830 USDT, offering a potential 52.73% gain. Keep an eye on this level for possible retest and confirmation.
Key Points:
Strong trend reversal from the downtrend.
Breakout above resistance could lead to further gains.
Target price 2.4 USDT.
Risk management advised for volatile market conditions.
Stay sharp and trade wisely!

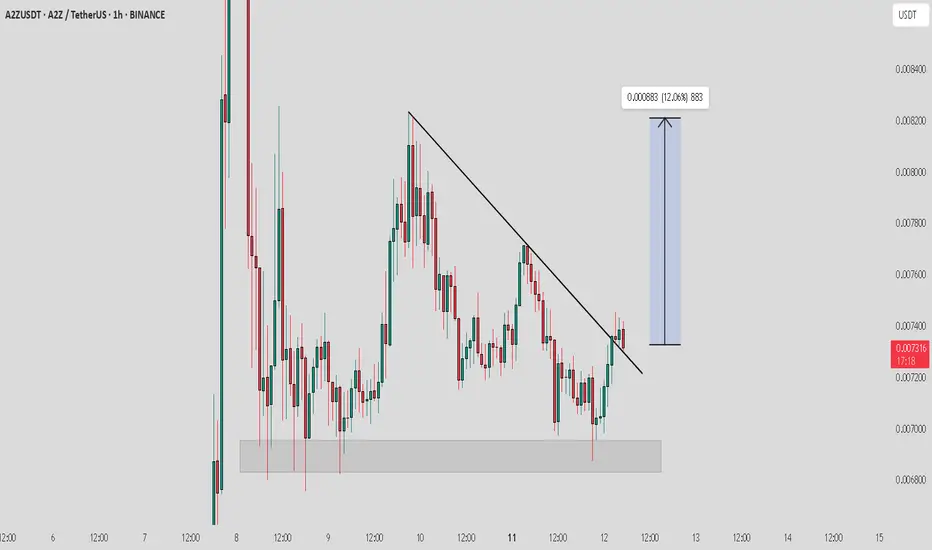
A2Z / USDT : Keep a close watch on retest progressA2Z/USDT Breakout + Retest in Progress 🚀
We’ve seen a solid breakout from the downtrend resistance line. Currently, A2Z/USDT is in the process of retesting the breakout zone. If this retest is successful, we are likely to see a strong upward move targeting a 12%+ gain as shown in the chart.
Keep an eye on the price action around the retest zone. A successful retest could set the stage for a nice bullish move.
Stay alert and trade wisely!
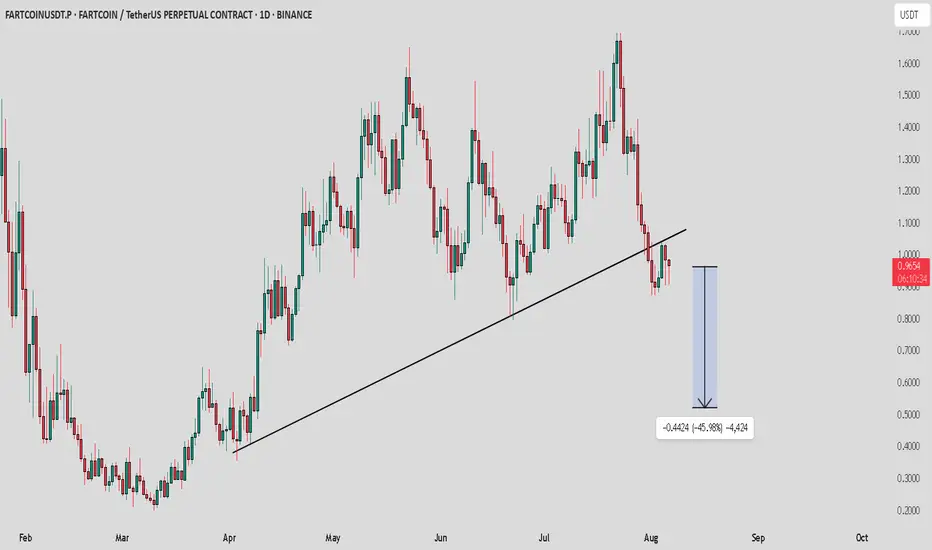
FARTCOIN / USDT : Trendline broken and retest successfulFARTCOIN: Trendline Broken, Bears in Control!
FARTCOIN's uptrend from March has been decisively broken. Price rejected the key trendline and is now showing strong bearish momentum. Expect further downside, with a potential target around $0.50. Bears are firmly in control!
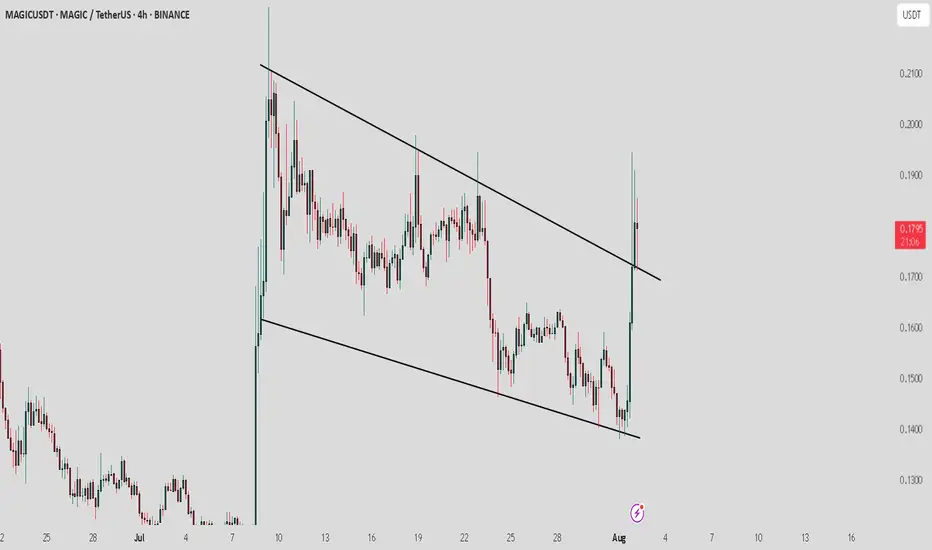
MAGIC/ USDT: Retest is in progress, keep a watch on confirmationMAGIC / USDT has broken out from the Trendline resistance and retest is still in progress . However, the market conditions are not ideal right now.
Bullish scenario : If the price holds above the breakout level and the retest is confirmed, the next target could be 0.19–0.21.
Bearish scenario : A failure to maintain above the breakout level may lead to a drop back to 0.15 or 0.13.
Pro Tip: Use tight stop-losses below the breakout point. Wait for confirmation before committing larger positions. Keep an eye on BTC dominance
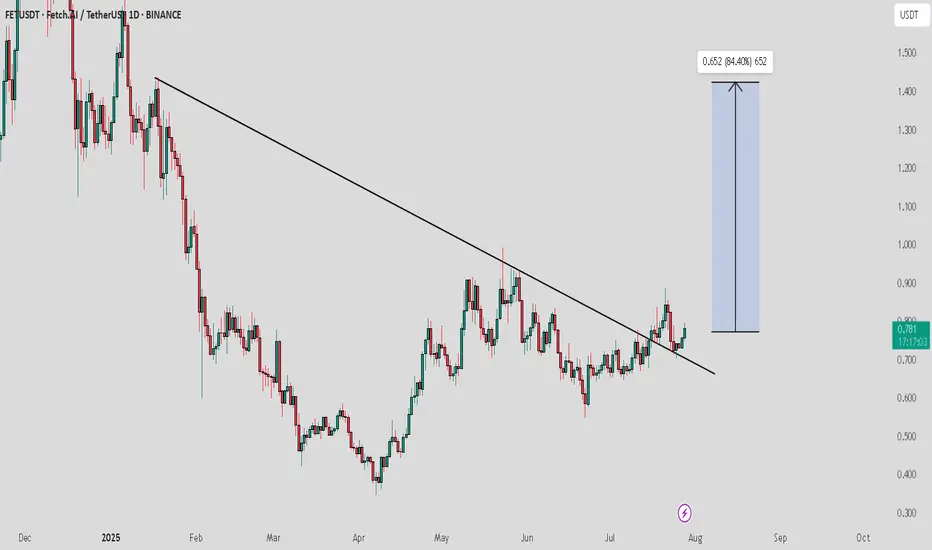
FET / USDT : Momentum building after successful retestFET/USDT has successfully broken out of the descending trendline resistance and is now holding strong after a successful retest. With momentum building, we are expecting a significant move towards the $1.5 level in the coming weeks.
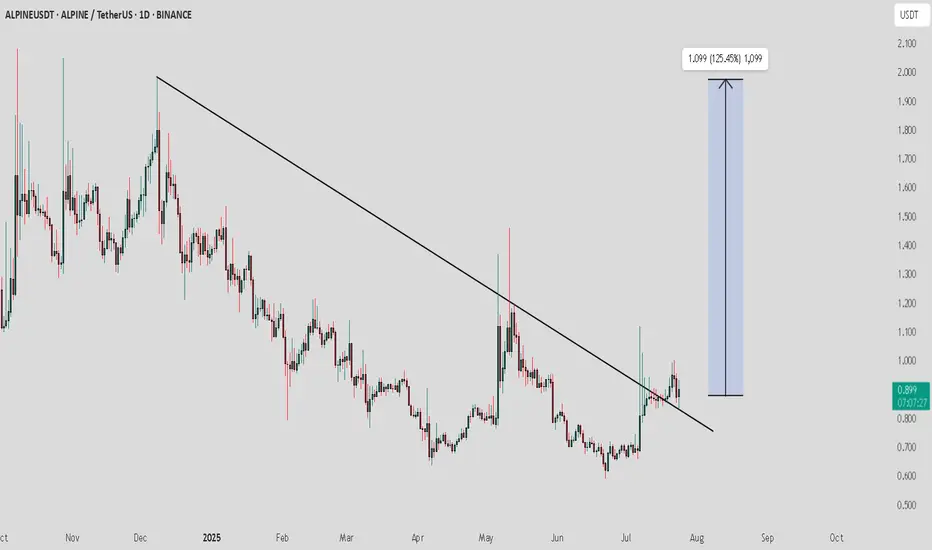
ALPINE / USDT : looking bullish ALPINEUSDT Analysis:
The price is currently retesting the downward trendline. This is a crucial point where the price may either bounce off or fail to hold the trendline, signaling the next major move.
Bullish Scenario:
Trendline Retest and Bounce: If the price holds above the trendline and shows bullish momentum, we could see a rise towards 1.099 (125.45% potential upside).
Confirmation: Look for strong buying volume during the retest to confirm the bounce.
Bearish Scenario:
Trendline Breakdown: If the price fails to hold the trendline and breaks below it, this could trigger a downward move.
Target: Watch for the next support levels to gauge the potential downside.