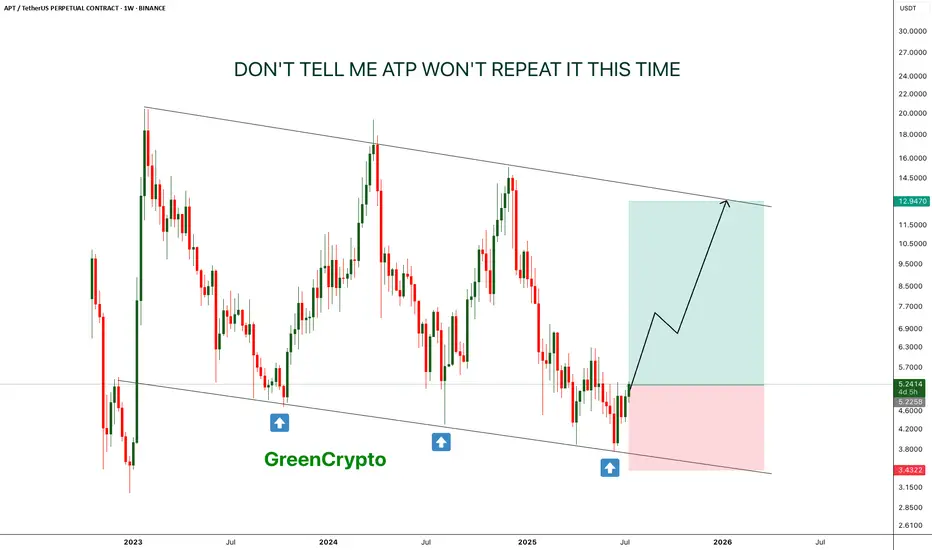
APT - Don't tell me this pattern won't repeat- This time is the charm, APT is is reversing from lower low on weekly chart.
- just like last two time, it is expect to forma new HL.
- there is a high chance that previous two patterns will repeat again
Entry Price: 5.22
Stop Loss: 3.4
TP1: 6.6632
TP2: 8.5059
TP3: 12.6945
Max Leverage: 5x
Don't forget to keep stoploss
Cheers
GreenCrypto
Reversal-patterns
AU Bears "Head" Down to Target .6570Here I have AUD/USD on the Daily Chart!
From Friday's High @ .67672 to its Low @ .66597, we can see we get the Confirmation of a strong reversal pattern with the Break of the Neckline of the Head & Shoulders!
Now what I'd like to see off the same High and Low of Friday is Price give us a 38.2% Retracement of the Low & Pullback to test the Neckline for potential Sell Entries.
( .67008 - .6697 )
Swing High of Head to Neckline = 126.9 Pips
Neckline - 126.9 = .6570 (Target)
Fundamentals:
AUD's undoing comes from a mix of a rise in Unemployment to 4.2% and Retail Sales ending August coming in @ 0%
With the horrible run of jobs reports for the USD to start September, it managed to recover to end the week and give the idea that a 50 bps Rate Cut is less likely sitting at a 30% change and a 25 bps Rate Cut more likely at a 70% chance at the Sept 18th meeting.
-RBA Interest Rate sits @ 4.35%
-Fed Interest Rate sits @ 5.5%
This upcoming week will be VERY news heavy for USD seeing as there is:
-Core CPI, CPI m & y on Wednesday, Sept. 11th
-Core PPI/ PPI m/m & Unemployment Claims on Thursday, Sept 12th!

Cup & Handle Forming!! - GUHere I have GBP/USD on the 1 Hr chart!
Price dipped down into the Support Zone that was recently used in the beginning of July making its Low @ 1.2707!
Afterwards, price came right back up to make an Equal High @ 1.28404 forming quite a popular Reversal Pattern, the Cup & Handle!!
Now this PA formed the "Bowl" and after the Equal High, using the Fib Retracement Tool, we can see Price made a 61.8% Retracement beginning the formation of the "Handle"!
This Higher Low tells us that if this Fib Retracement holds, we could be seeing the end of this Downtrend and the beginning of an Uptrend to the Potential Range Target of 1.29992 - 1.30502!
- Bullish Divergence @ Support
- Violation of Structure from LL to HL
- RSI ABOVE 50

Weekend Analysis Round Up- EUR/USD, AUD/JPY, DOGEHey Everyone!! Here is my Weekend Analysis Round Up for Market Open!!
1) EUR/USD - Head & Shoulders Pattern w/Potential Bearish Wedge as Continuation Confirmation!!
2) AUD/JPY - Possible Correction Wave based off new LOWER LOW!
3) Doge - Stuck in a Pennant?!

Double Bottom - UCADHere I have USD/CAD on the 1 HR Chart!
Price has outlined a very clear Double Bottom pattern with the two Lows!
RSI is giving us a Bullish Divergence which tells me price really wants to work higher from this point!
Price has now broken the Confirmation of Pattern!
With this PA of now Higher Highs, we look for the next Low to be Higher than the Low of the Double Bottom being our INVALIDATION!
Fundamentally this week:
USD - Richmond Index (Tue) Flash PMI (Wed) Advance GDP, Unemployment, Durable Goods (Thur) Core CPE (Fri)
CAD - NHPI (Tue) BOC Monetary Policy, Rate Statement & Press Conference (Wed)
*If price does come down to test this break, I suspect the Support Zone @ Confirmation will be enough to catapult price up into the overhead Resistance Zone and Above!

BTC's bulls are ready to break wallHello Traders!
Welcome back to another post with analyst Aadil1000x.
In the previous post, the chart was not complicated as today's charts. In this chart, we can see this consolidation phase is a set of many patterns and after deep focus and a close view, I have connected all patterns and now we are ready to play with the market.
Now we have a key reversal area at 24215 and there is a minor confusion about the move from this area. Most probably the move will be bullish but there is still a chance that it can dip from this area. We are not here to predict and gamble but to take action after a good reaction.
We will wait and see the reaction before taking action at the key reversal area.
Don't forget to hit the like button and follow to stay connected.

FRA40| Bearish Reversal Impulse Entry ;)Hey everyone :)
As we got a clean break of the Highs and that we got a reversal impulse now I'll be looking for Bearish continuation PA. The entry would be on the LTF bearish flag.


NZDUSD 4HR TIMEFRAMENZDUSD 4HR TIMEFRAME
Market Structure: Bullish
The purple rectangles that are placed are the equal highs/equal lows. I see a lot of liquidity where I placed the purple rectangles. Since it broke previous equal highs, I'm waiting for a retest right back toward the purple rectangle (resistance), then back up towards the green rectangle line which says (NEW TARGET AREA).
The blue line where the green rectangle is placed is my TP.
The buy setup is a 62 pip move.
However, if price reverses toward the downside, I'll wait until it breaks support (bottom purple rectangle), retest, then make an entry.
TP for sells are also placed & marked up. The sells are 83 pip move. If price goes either way, both setups are in place.
REMINDER: Always take profit/partial profit at TP1. Price majority of the time retests that area, goes back to entry, then smash TPS.

Trend Continuation Patterns & Reversal Patterns🚀💣Hi, friends! Let's keep learning?😉
Today we are talking about <> and <> of Technical Analysis 😊
- this girls try to tell You more details😉
Hope, It would be helpful for You♥️
🐂Bull flag🐂
The principle of bullish flag trading, like all technical analysis figures, is the same - a breakout of the control point is required. As soon as a breakdown has occurred, you can immediately post the target. The target in a bull flag will be the height of the pole.
There is one more feature of this figure - the canvas of the flag should be tilted against the main trend.
🐻Bear flag🐻
For the most profitable entry, it is better to enter into a deal with a pending order. As soon as the trade is entered, the take profit is placed at the height of the pole from the breakout point of the pattern.
🐂Bullish pennant🐂
The pattern trading rules are identical to the bull flag trading rules.
🐻Bearish pennant🐻
The trading rules are the same as for the bear flag .
💥Head & Shoulders Pattern💥
After the pattern has become clearly visible, namely, the right shoulder is clearly visible, the trader needs to wait for the neckline breakout. Breakouts occur on strong impulses with a sharp increase in volume . Therefore, in order not to miss the entry and enter at the best price, it's better to use a sell stop order.
To calculate where the price will go after the breakout of the pattern, it is enough to measure the height of the pattern (vertical from the maximum of the head to the neckline) and postpone it to the breakout point.
💥Inverted Head & Shoulders Pattern💥
An inverted head and shoulders pattern occurs in a downtrend and heralds an uptrend. The rules for working on a figure are similar to the previous ones.
It is worth noting that the head and shoulders pattern is rarely encountered in its pure form. Be careful!
💥 Double Bottom Pattern 💥
After you have identified the pattern on the price chart, you need to wait for the breakout of its resistance line. If the price has broken through the resistance, then the target will be the width of the pattern's range - the distance from the lowest point to the resistance.
💥Double Top Pattern 💥
A double top is similar to a double bottom . The only difference is that this pattern is reversed and occurs on uptrends.
The number of extrema in a pattern can be not only double, but also triple, and even more. But the rules of work will be identical for everyone - enter on a breakout, postpone the target to the height of the figure and wait for its execution.
💥Diamond💥
We measure the height and wait for the breakdown of the diamond. If a breakout has occurred, then the price movement target will be the height of the pattern from the breakout point.
💥Cup & Handle💥
Trades are opened on the breakdown of the "handle" upwards. Target is the height of the figure.
Thanks for Your attention🙏🏻
Stay in touch🧡
Sincerely yours Rocket Bomb🚀💣

Candlestick Reversal Patterns, Indicators, or Both?This chart demonstrates beautifully how better results might be obtained by using candlestick reversal patterns instead of just blindly following a lagging indicator.
DISCLAIMER: This is not a trading strategy or plan that anyone should use out of the box. This is not investment advice, but please establish your own entry and exit rules for the securities you want to trade. And, ideally, back test, and forward test them.
EXPERIMENT: Here, I am using a triangular moving average (TMA) with standard deviation bands. I thought I was very original with my TMA. But it turned out to be very similar to the popular, Chris Moody's CM Ultimate . But the TMA has been around a long time, so that figures. Not to be outdone so easily, I thought I'd try and see what it looked like by adding bands. But setting up the parameters is very subjective. I chose a length that I think lines up best with the trends that I want to capture. Then I set the bands such that they encompass most of the price action. It's not like Bollinger Bands that pretty much work with default settings every time. If there is enough interest though, I will consider releasing the indicator.
Notice that even with optimum settings, identifying candlestick reversals could identify a change in direction prior to the indicator. Yet using an indicator like this does help me to identify where to look for reversal patterns. I want to see candles with long tails, or candles that reverse the high or low. I also want to look back for areas of previous Support and Resistance, volume, shorter candles, and trend lines to anticipate where a reversal pattern may occur. Consolidations inside the wide bands or near the moving average are other places to look. Multiple points of confirmation could assist in identifying where to look for good trades and stops that best fit the overall position sizing and trading plan.
Note: I am neutral on DOG because the pattern looks incomplete to me. At my level of experience, I like to see a bit more confirmation.
What do you use? Candlestick patterns, indicators, or some other combination? I am just getting started with this. But I hope this helps you in your endeavors. Keep looking through charts in addition to studying patterns to become a master at identifying these reversals. If you have any other ideas to improve, please let me know in the comments.
Here's to your success!

<<Reversal Patterns of Technical Analysis>> Hello, my lovely and so clever friends! Today we are talking about <> 🧡
💥 Head & Shoulders Pattern 💥
After the pattern has become clearly visible, namely, the right shoulder is clearly visible, the trader needs to wait for the neckline breakout. Breakouts occur on strong impulses with a sharp increase in volume. Therefore, in order not to miss the entry and enter at the best price, it's better to use a sell stop order.
To calculate where the price will go after the breakout of the pattern, it is enough to measure the height of the pattern (vertical from the maximum of the head to the neckline) and postpone it to the breakout point.
💥Inverted Head & Shoulders Pattern 💥
An inverted head and shoulders pattern occurs in a downtrend and heralds an uptrend. The rules for working on a figure are similar to the previous ones.
It is worth noting that the head and shoulders pattern is rarely encountered in its pure form. Be careful!
💥 Double Bottom Pattern 💥
After you have identified the pattern on the price chart, you need to wait for the breakout of its resistance line. If the price has broken through the resistance, then the target will be the width of the pattern's range - the distance from the lowest point to the resistance.
💥 Double Top Pattern 💥
A double top is similar to a double bottom. The only difference is that this pattern is reversed and occurs on uptrends.
The number of extrema in a pattern can be not only double, but also triple, and even more. But the rules of work will be identical for everyone - enter on a breakout, postpone the target to the height of the figure and wait for its execution.
💥 Diamond 💥
We measure the height and wait for the breakdown of the diamond. If a breakout has occurred, then the price movement target will be the height of the pattern from the breakout point.
💥Cup & Handle💥
Trades are opened on the breakdown of the "handle" upwards. Target is the height of the figure.
Thanks for Your attention🙏🏻
Stay in touch🧡
Sincerely yours Rocket Bomb🚀💣
My previous work for You 💋
