NZDUSD - Follow The Bulls AGAIN!Hello TradingView Family / Fellow Traders. This is Richard, also known as theSignalyst.
📈NZDUSD has been overall bullish trading within the rising broadening wedge marked in blue.
This week, NZDUSD has been retesting the lower bound of the wedge.
Moreover, the green zone is a strong structure.
🏹 Thus, the highlighted blue circle is a strong area to look for buy setups as it is the intersection of the lower blue trendline and green structure.
📚 As per my trading style:
As #NZDUSD approaches the blue circle zone, I will be looking for trend-following bullish reversal setups (like a double bottom pattern, trendline break , and so on...)
📚 Always follow your trading plan regarding entry, risk management, and trade management.
Good luck!
All Strategies Are Good; If Managed Properly!
~Richard Nasr
Reversal

EURAUD – Channeling the Bears!EURAUD has been overall bearish 📉, trading inside a clear descending channel.
Price recently bounced and is now retesting the 1.7800 structure zone, which aligns with the upper bound of the channel. This area is acting as a strong confluence 🔑, making it a potential spot to look for short opportunities.
As long as price remains below this structure, sellers 🐻 are likely to stay in control, with downside continuation toward the channel’s lower bound.
Patience ⏳ is key here — waiting for bearish confirmation can provide a cleaner entry and reduce risk.
⚠️ Disclaimer: This is not financial advice. Always do your own research and manage risk properly.
📚 Stick to your trading plan regarding entry, risk, and trade management.
Good luck!
All Strategies Are Good; If Managed Properly!
~Richard Nasr

EURGBP – Battleground of Supply and Demand!EURGBP has been trading between clear supply and demand zones ⚖️, respecting both ends of the range.
After rejecting the 0.8750 supply zone, price turned lower, showing that sellers remain in control. Currently, EURGBP is hovering around the 0.8620 – 0.8640 demand zone, where buyers previously stepped in.
This area forms an important decision point 🔑:
- If demand holds, we could see a bounce back toward mid-range levels.
- If broken, a continuation lower would confirm supply’s dominance 📉.
Patience here is key ⏳ — waiting for confirmation at these zones can help filter out false moves and set up a cleaner trade.
⚠️ Disclaimer: This is not financial advice. Always do your own research and manage risk properly.
📚 Always follow your trading plan regarding entry, risk management, and trade management.
Good luck!
All Strategies Are Good; If Managed Properly!
~Richard Nasr

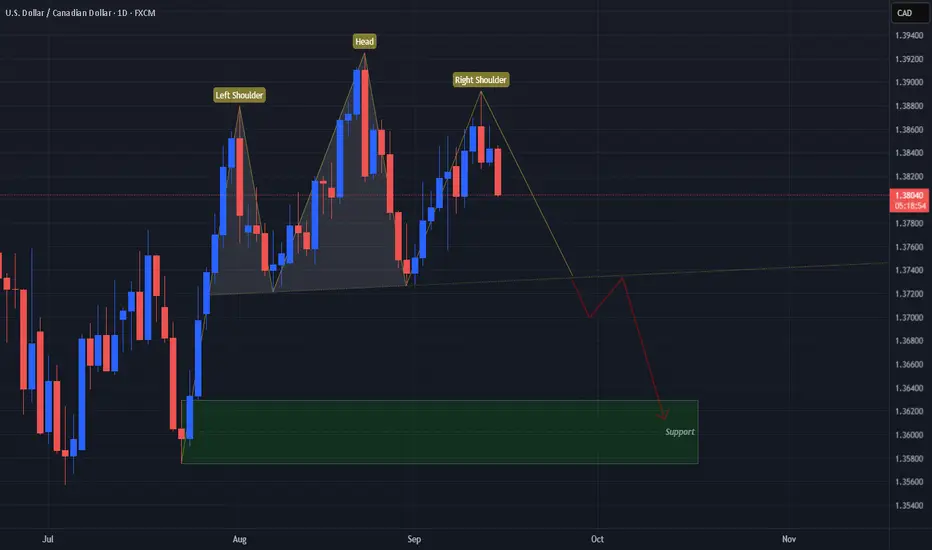
UCAD Dropping Signs of Potentially Strong ReversalOANDA:USDCAD has followed suit with last week so far with starting this week off continuing the decline in price from the Sept. 11th High beginning to form what looks to be a "Right Shoulder" or Lower High then the previous.
This strong triple Reversal Pattern is the Head and Shoulders!
Now the Right Shoulder was created but still has yet to form completely which will happen once price revisits the "Neckline" or Support Line price has been bouncing from to create the 3 peaks.
Once Price has Confirmed the Pattern, this should deliver potential Short Opportunities as a Head and Shoulders Breakout and Retest Scenario!
*The next suspected area Price will travel to if the Pattern is confirmed will be the Last Support Zone Price visited before beginning the formation of the Pattern.
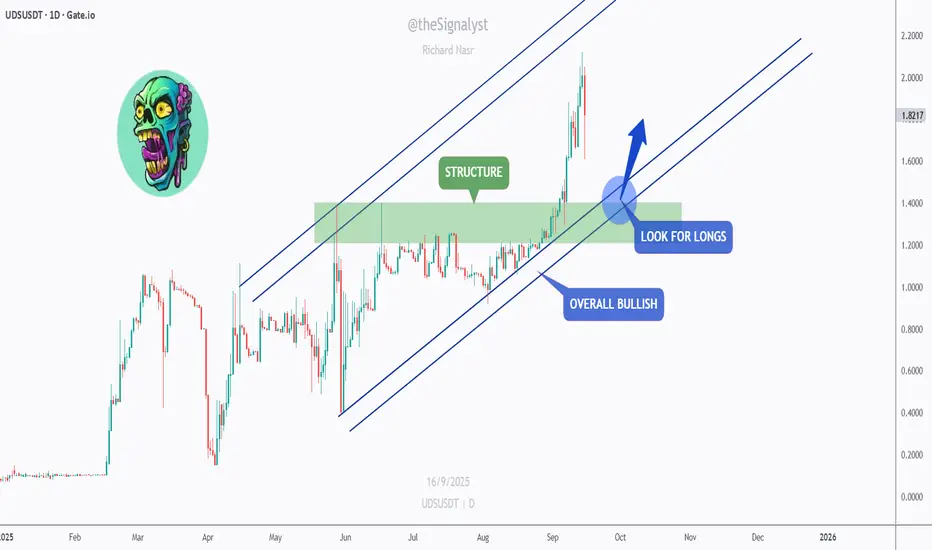
UDS – Bulls on the Move!Hello TradingView Family / Fellow Traders. This is Richard, also known as theSignalyst.
📈UDS has been overall bullish trading within the rising channel marked in blue.
This week, UDS has been retesting the lower bound of the channel.
Moreover, the green zone is a strong structure.
🏹 Thus, the highlighted blue circle is a strong area to look for buy setups as it is the intersection of the lower blue trendline and green structure.
📚 As per my trading style:
As #UDS approaches the blue circle zone, I will be looking for trend-following bullish reversal setups (like a double bottom pattern, trendline break , and so on...)
📚 Always follow your trading plan regarding entry, risk management, and trade management.
Good luck!
All Strategies Are Good; If Managed Properly!
~Richard Nasr
BTC – the $130K Roadmap!CRYPTOCAP:BTC is showing strong bullish structure both short-term and long-term 📈
After forming a clean inverse head & shoulders at support, price broke higher and is now trading within a rising channel.
🟢 Bullish short-term: As long as BTC holds above the $113,000 – $115,000 structure zone, buyers remain in control.
📊 Bullish long-term: Price continues to respect the major ascending channel, keeping the bigger picture bias to the upside.
🎯 Next target: If momentum continues, BTC could be on track toward the $130,000 resistance.
Patience here is key ⏳ — pullbacks into support could offer fresh continuation entries for the bulls 🐂.
⚠️ Disclaimer: This is not financial advice. Always do your own research and manage risk properly.
📚 Stick to your trading plan regarding entries, risk, and management.
Good luck!
All Strategies Are Good; If Managed Properly!
~Richard Nasr

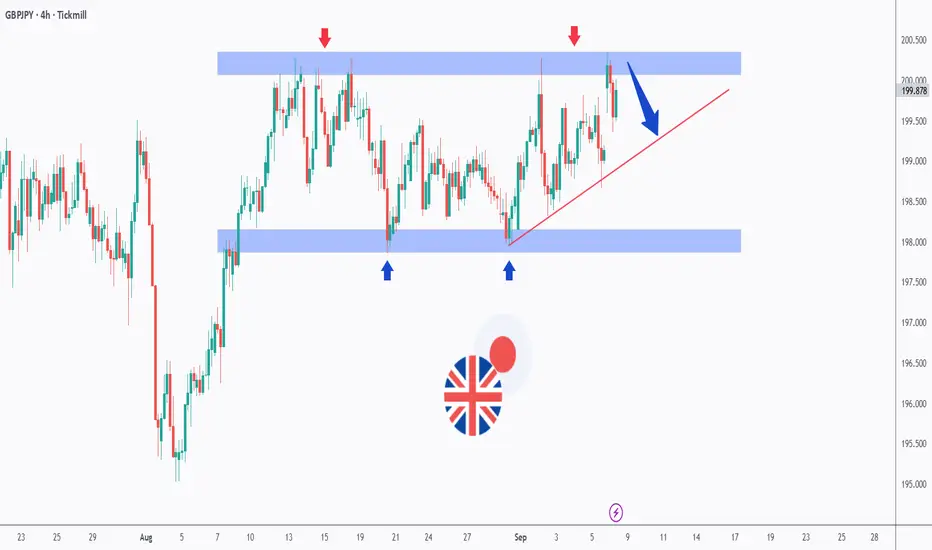
GBPJPY – Testing the Range Once AgainGBPJPY has been stuck in a wide range between 198.00 (support) and 200.50 (resistance) for several weeks now.
🔻 Sellers continue to defend the upper boundary (red arrows).
🔹 Buyers are stepping in around the 198.00 demand zone (blue arrows).
📈 Price is currently rejecting the resistance area once more while also sitting above the rising trendline (red).
If the resistance holds, we could see a rejection toward the lower bound of the range. On the other hand, a clean breakout above 200.50 would be needed for bulls to take full control. 🚀
This setup makes GBPJPY one of the key pairs to watch in the coming days.
Disclaimer:
This analysis is for educational purposes only and does not constitute financial advice. Always do your own research and follow your trading plan before making any investment decisions.
📚 Stick to your trading plan regarding entries, risk management, and trade execution.
Good luck!
All Strategies Are Good; If Managed Properly!
~Richard Nasr
Reverse Head & Shoulders Setup | Gold Spot | 15min | by Mohsen M
🔸 **Chart:** Gold Spot / USD (XAU/USD)
🔸 **Timeframe:** 15min
🔸 **Method:** Smart Money Concepts (SMC) + Pattern Recognition
🔸 **Focus:** Reverse H&S, Order Blocks, TLQ, BOS
---
## 🔍 Market Context:
- **Market Structure:** Bearish on higher TF
- **Short-Term Trend:** MSU (Market Structure Up)
- **Efficiency:** ✅ Confirmed — clean price delivery
- **Key Pattern:** Bullish **Inverse Head & Shoulders**
---
## 🧠 Technical Breakdown:
1. **Left Shoulder – Head – Right Shoulder** perfectly forming within a high-value demand zone
2. Price reacted strongly from **Order Block (OB)** + TLQ marked at the bottom wick (Head zone)
3. BOS confirms bullish attempt to shift structure
4. Anticipating neckline break at ~3345 level for further upside
5. Potential resistance and liquidity resting above 3400 (HH region)
---
## 📌 Trading Plan (Pre-London Open / Monday 1:30 AM UTC+3:30):
- **Entry Idea:**
Watch for bullish confirmation after price stabilizes above Right Shoulder zone (~3300–3320)
Or re-entry on a retest of neckline after breakout
- **Stop Loss:**
Below "Head" and OB zone (~3260)
- **Take Profits:**
- TP1: Neckline break zone (~3345)
- TP2: 3400 – Liquidity pool
- TP3: Final HH sweep (~3420+)
---
## ⚠️ Alternate Bearish Case:
> If price breaks below the "Head" zone and OB fails to hold,
> → Expect bearish continuation to the next liquidity zone near **VTA @ 3200**
---
## ✅ Summary:
This is a clean **bullish reversal setup** using SMC logic and a classic H&S pattern:
**OB + TLQ + BOS + Efficient Market + Clear Pattern ➝ High-Probability Setup**
Structure: 🟥 Bearish (macro)
Trend: 🔼 MSU (micro)
Efficiency: ✅ Efficient
Pattern: 🟩 Inverse Head & Shoulders
---
📊 Prepared by: **Mohsen Mozafari Nejad**

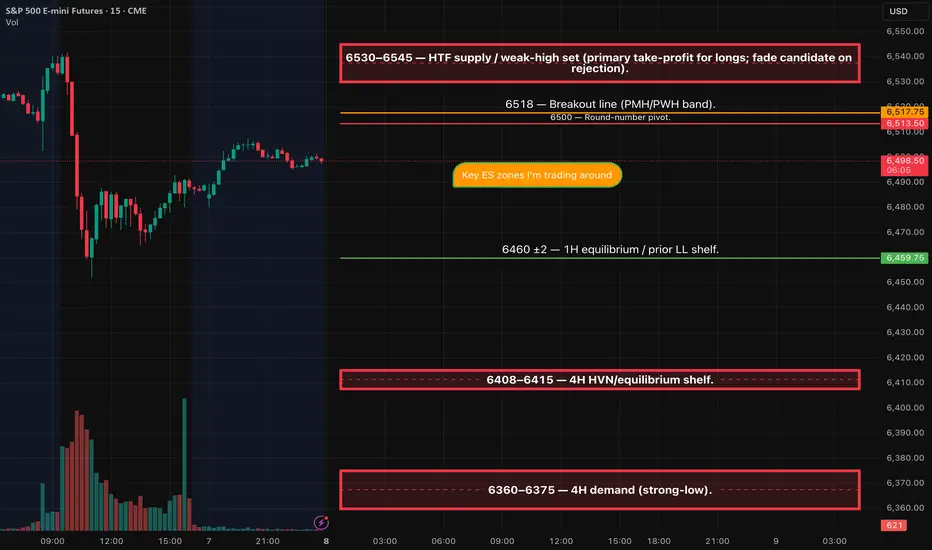
ES (SPX) Weekly: Levels & Setups - Sep 8-12, 2025Price is camped under a higher-timeframe supply/“weak-high” band. Trend remains constructive on the Weekly/Daily, but 4H/1H are coiling beneath resistance. I’m neutral into mid-week inflation data and will only engage on clean acceptance above the prior-high band or a rejection back into range.
Event stance: Two inflation releases hit 08:30 ET mid-week. I’ll be flat into the prints and wait for the first qualifying 15-minute close before arming anything
Key ES zones I’m trading around
6530–6545 — HTF supply / weak-high packet (primary take-profit for longs; fade candidate on rejection)
6518 — Breakout line (PMH/PWH band)
6500 — Round-number pivot
6460 ±2 — 1H equilibrium / prior LL shelf
6408–6415 — 4H HVN / equilibrium shelf
6360–6375 — 4H demand (strong-low)
Setup 1 — Breakout-Acceptance LONG
Trigger: 15m close > 6518, then two 5m bodies hold above.
Entry: 6520.5–6523.0 on the retest or break of bar-2 high.
Stop: tighter of (i) below the 15m trigger candle low, or (ii) below the last confirmed 5m swing; cap ≤ 6–8 pts.
• If neither option fits ≤ 8 pts from your fill, pass and wait for a cleaner micro HL.
TP1 (dynamic): first hard band (e.g., any workable print inside 6530–6545) that yields ≥ max(15, 2.5×SL) from your fill (front-run 0.25–0.5 pt if 2.5R is tight).
TP2/TP3: 6550, then 6570; trail by 15m/30m closes.
• Disqualifiers: any 5m body back ≤ 6518 before TP1; visible liquidity wall ≤ 5 pts beyond trigger; news window.
Setup 2 — SRR Rejection SHORT (Sweep → Recapture → Reversal)
Trigger: Sweep 6518–6530, fail, then 15m bearish close < 6518.
Entry: 6515.0–6518.0 on the retest from below.
Stop: tighter of (i) above the 15m trigger candle high, or (ii) above the last confirmed 5m LH; cap ≤ 6–8 pts.
• I f the correct structural stop is > 8 pts from your fill, skip until a micro LH tightens risk.
TP1 (dynamic): first hard band below that gives ≥ max(15, 2.5×SL) from your fill—usually 6500; if 2.5R isn’t met to 6500, promote to 6482, then 6460.
TP2/TP3: 6482, then 6460 (extend toward 6410 if momentum).
• Disqualifiers: no 15m bearish confirmation; any 5m body ≥ 6518–6522 after entry (use your exact line); news window.
BTC – Bulls Guarding the Key Zone!Bitcoin is retesting a major support zone 🛡️ that overlaps with the previous ATH breakout level.
This area has been acting as a strong demand zone, keeping the overall structure bullish despite recent corrections.
As long as this zone holds, we will keep looking for long opportunities 📈, with the next wave of momentum likely pushing BTC higher. If the bulls manage to reclaim the minor resistance ahead, we could see them fully take over and drive price back into an upward rally.
For now, this zone remains a crucial pivot — watch closely for bullish confirmation signals.
⚠️ Disclaimer: This is not financial advice. Always do your own research and manage risk properly.
📚 Stick to your trading plan regarding entries, risk management, and trade execution.
Good luck!
All Strategies Are Good; If Managed Properly!
~Richard Nasr

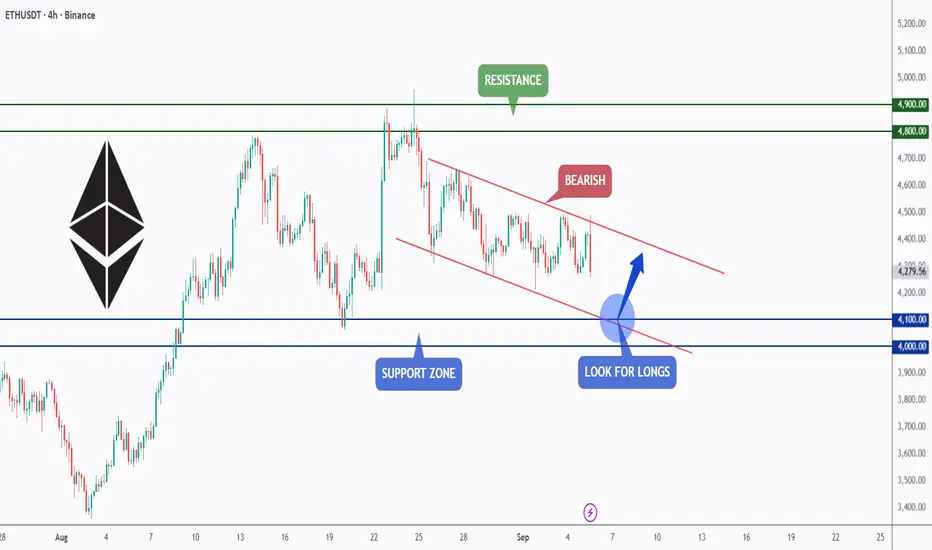
ETH – Watching the Falling Channel!Ethereum is currently trading within a falling channel on the 4H timeframe, showing short-term bearish pressure.
Price is approaching the support zone around the $4,000–$4,100 area, which also aligns with the lower boundary of the channel.
As long as this zone holds, it could act as a springboard for bullish momentum, offering a potential long setup.
A breakout from the channel would further confirm buyer strength and open the way toward the resistance zone near $4,800–$4,900.
⚠️ Disclaimer: This is not financial advice. Always do your own research and manage risk properly.
📚 Always follow your trading plan regarding entry, risk management, and trade management.
Good luck!
All Strategies Are Good; If Managed Properly!
~Richard Nasr
NZDCAD – Range Resistance in Play!📌 NZDCAD has been moving within a clear range structure between support and resistance zones on the 1H timeframe.
Price is now approaching the upper resistance area, where sellers have consistently stepped in to cap bullish momentum.
If this level holds, we could see a bearish reversal, driving price back toward the support zone near the lower boundary of the range.
This setup offers a classic opportunity to trade the swing from resistance back into support.
⚠️ Always remember: patience pays. Let the market come to you.
📚 Always follow your trading plan regarding entry, risk management, and trade management.
Good luck!
All Strategies Are Good; If Managed Properly!
~Richard Nasr

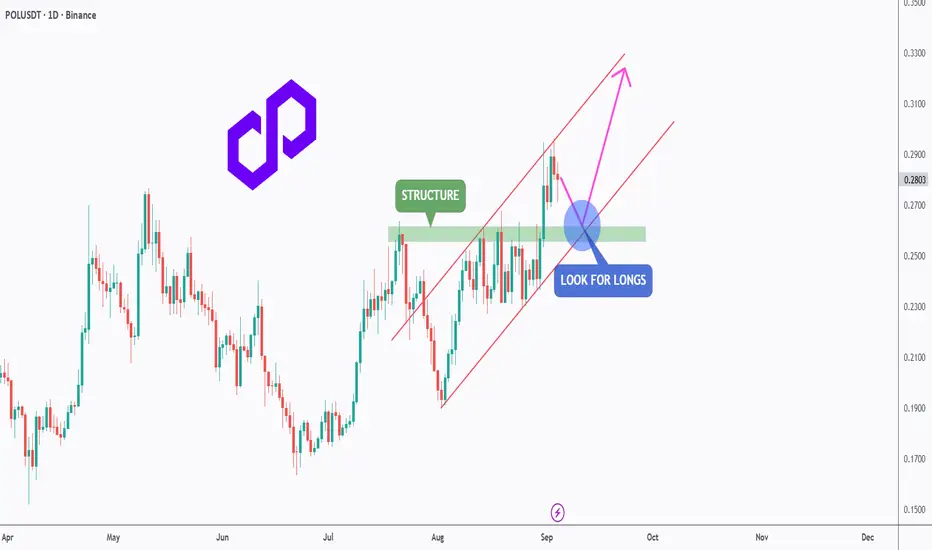
POL - Retest the Channel, Reload for the Next Leg!POLUSDT has been trading inside a clean ascending channel 📈, respecting both support and resistance levels.
After a strong push upward, price is now pulling back toward the previous structure zone around 0.26 – 0.27, which aligns perfectly with the lower bound of the channel.
This area forms a strong confluence (structure + channel support) 🔑, making it an ideal spot to look for long opportunities. As long as this zone holds, bulls 🐂 could regain control and push price toward the next resistance levels in the 0.32.
Patience here is key ⏳ — waiting for confirmation before entering can set up a high-probability continuation trade.
⚠️ Disclaimer: This is not financial advice. Always do your own research and manage risk properly.
📚 Always follow your trading plan regarding entry, risk management, and trade management.
Good luck!
All Strategies Are Good; If Managed Properly!
~Richard Nasr
ATG forming a right shoulder?Is this a textbook H&S pattern being formed? 643 is break out/neck line and 912 is the target. Looks like it and reversal will be know by September to November 2025.
This is not a solicitation to trade in ATG shares.

Breakout of Head & Shoulders on AJOANDA:AUDJPY has completed a strong triple reversal pattern, the Head and Shoulders!
Price currently has broken through the Neckline or Support line and we will want to see price close underneath to validate the breakout!
Once price has closed underneath Support, we will want to wait to watch for a retest of that breakout around 96.75 with rejection to signal a successful retest!
This could deliver a great shorting opportunity!

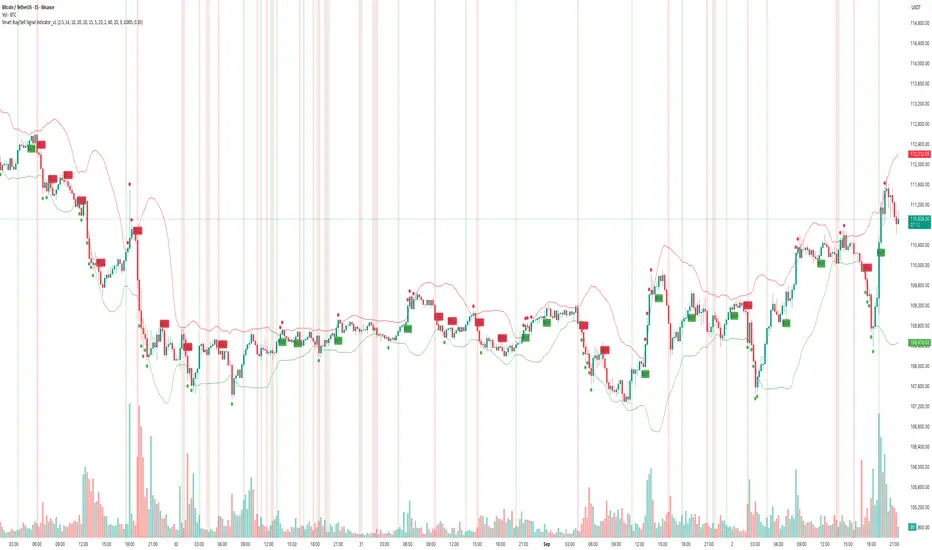
How to Use - Smart Buy/Sell Indicator — Real-Time & ReversalDescription
The chart above demonstrates how the Smart Buy/Sell Signal Indicator combines multiple conditions — Supertrend, RSI, ADX, Confirmation MA, and Bollinger Bands — to highlight potential trade opportunities in real time.
🔹 Core Signals
• Buy / Sell Triggers: Generated when trend, momentum, and volatility filters align.
• Reversal Clouds: Appear when RSI, ADX, and Bollinger extremes suggest potential exhaustion or traps.
🔹 Unique Aspect — Real-Time & Leading
Unlike many lagging tools, this indicator evaluates conditions during the live candle formation.
• If all rules align → signal appears immediately.
• If conditions fail before the candle closes → the signal disappears.
This design allows it to act as a leading signal generator, giving traders early heads-up rather than waiting for full candle confirmation. It emphasizes signal accuracy over repainting, by ensuring only valid conditions remain visible at close.
🔹 What Makes It Different
• Multi-factor confirmation (trend + momentum + volatility)
• Cooldown logic to avoid clustered signals
• Both continuation & reversal insights in one tool
• Adaptive to trending and sideways phases
📊 In the example above (BTCUSDT, 15m), you can see how signals align with both momentum-driven moves and intraday reversals.
⚠️ Note: This is an analytical tool, not financial advice. Performance varies across assets and timeframes. Always backtest and combine with risk management.
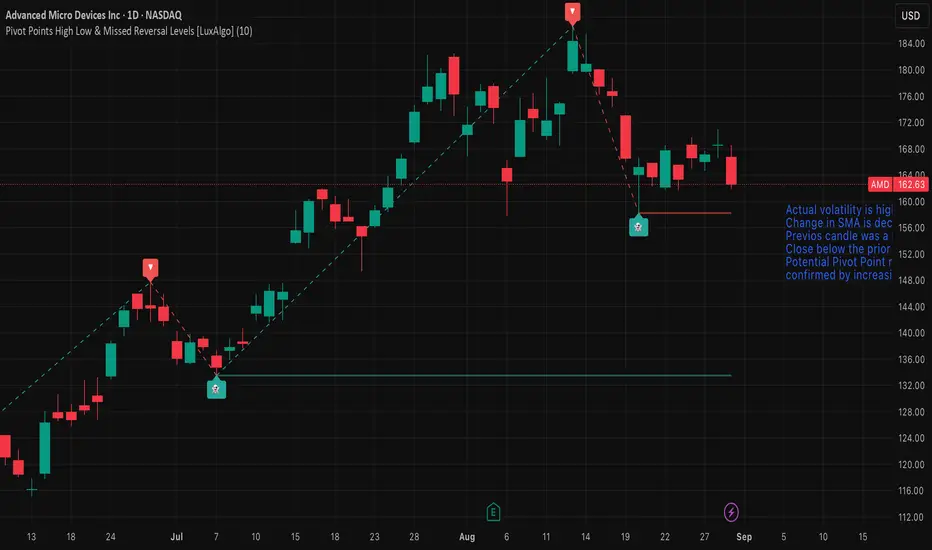
AMD — Watch for Pivot Reversal or Trend ContinuationMarket view
Actual volatility is high, confirmed by the Volatility Bars indicator.
The rate of change in the SMA is decreasing, suggesting momentum is weakening.
The previous candle was a Doji, indicating short-term indecision.
Price closed below the prior day’s low, adding bearish pressure.
A potential Pivot Point reversal is forming.
This reversal setup is confirmed by increasing Convolution Probability, supporting a higher chance of a directional move.
Trade plan
Long (trend continuation): buy on a break above the August 19, 2025 open.
Short (reversal): sell on a break below the pivot reversal at 158.25.
Stop-loss and position sizing: use volatility-based stops (e.g., ATR multiple) and risk no more than a small fixed percentage of capital per trade.
USDCHF - Demand Zone Meets Falling Wedge!USDCHF is approaching a key demand zone while trading inside a falling wedge pattern.
The price is now retesting the intersection of support and structure, a high-probability area where buyers may step in.
As long as this zone holds, I’ll be looking for long opportunities targeting a potential bounce back toward the upper boundary of the wedge.
⚠️ A break below the demand zone would invalidate this bullish setup and open the door for lower levels.
📚 Always follow your trading plan regarding entry, risk management, and trade management.
Good luck!
All Strategies Are Good; If Managed Properly!
~Richard Nasr

USDCAD – Shift in Momentum!USDCAD has moved from a strong bullish rally into a clear shift in momentum. After breaking structure with an aggressive drop, price is now moving inside a rising channel that looks more corrective than impulsive.
The previous bullish phase was defined by higher highs and higher lows, but the sharp decline highlighted a potential change in sentiment. Since then, the market has been consolidating, with price pushing higher in a slower and corrective manner.
As long as price remains inside this channel, the bias stays bearish, and I’ll be looking for shorts from the upper boundary around the 1.3880–1.3900 zone. A break below the lower bound near 1.3820 could confirm continuation to the downside.
This is a critical zone for USDCAD, where sellers may step in to regain control.
📚 Always follow your trading plan regarding entry, risk management, and trade management.
Good luck!
All Strategies Are Good; If Managed Properly!
~Richard Nasr

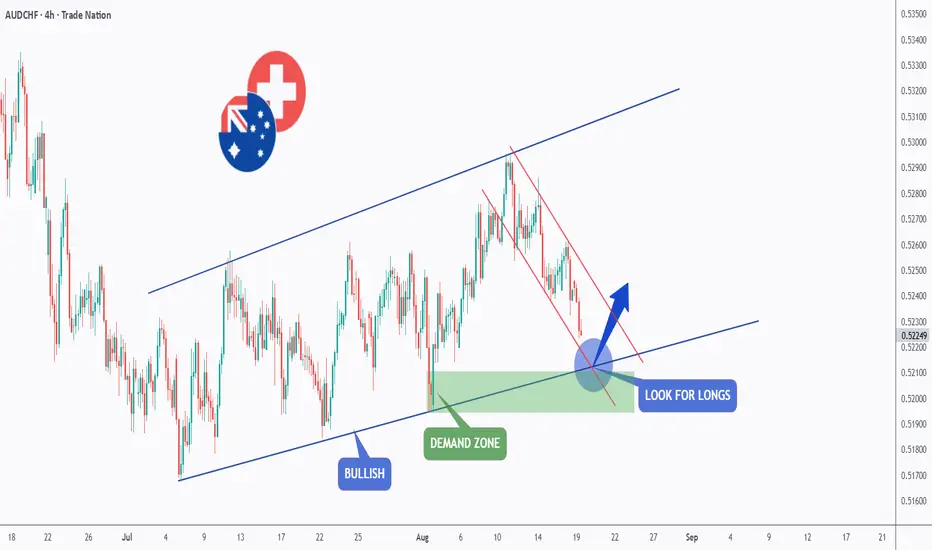
AUDCHF – Bulls Preparing for a Comeback?AUDCHF has been trading inside a broad ascending channel, showing a clear bullish structure. Recently, price pulled back within a corrective descending channel and is now approaching a key demand zone aligned with the lower bound of the channel.
🔎 If buyers step in here, we could see a potential reversal and continuation of the overall bullish trend.
👉 Plan: Look for long opportunities as price reacts around the demand zone and channel support.
📚 Always follow your trading plan regarding entry, risk management, and trade management.
Good luck!
All Strategies Are Good; If Managed Properly!
~Rich
Disclosure: I am part of Trade Nation's Influencer program and receive a monthly fee for using their TradingView charts in my analysis.
GBPJPY – Bulls Knocked Out, Bears Step In!After rejecting the 200.00 resistance, GBPJPY broke below key structure and shifted momentum to bearish.
Price is now retesting the broken support turned resistance, aligned with a descending trendline.
🔎 As long as this area holds, the bias remains bearish with potential for another downward leg.
👉 Plan: Look for short opportunities around the retest zone.
📚 Always follow your trading plan regarding entry, risk management, and trade management.
Good luck!
All Strategies Are Good; If Managed Properly!
~Rich
Disclosure: I am part of Trade Nation's Influencer program and receive a monthly fee for using their TradingView charts in my analysis.

AUD Nods To A Strengthening USD With A Strong ReversalOANDA:AUDUSD has completed and confirmed a strong Reversal Pattern, the Head and Shoulders!
Price this morning made a Breakout of the Neckline or Support of the Pattern.
Once Price makes a Retest of the Breakout of the Pattern, this will deliver Short Opportunities to take Price down to the next Support Zone @ .6525 - .6420!

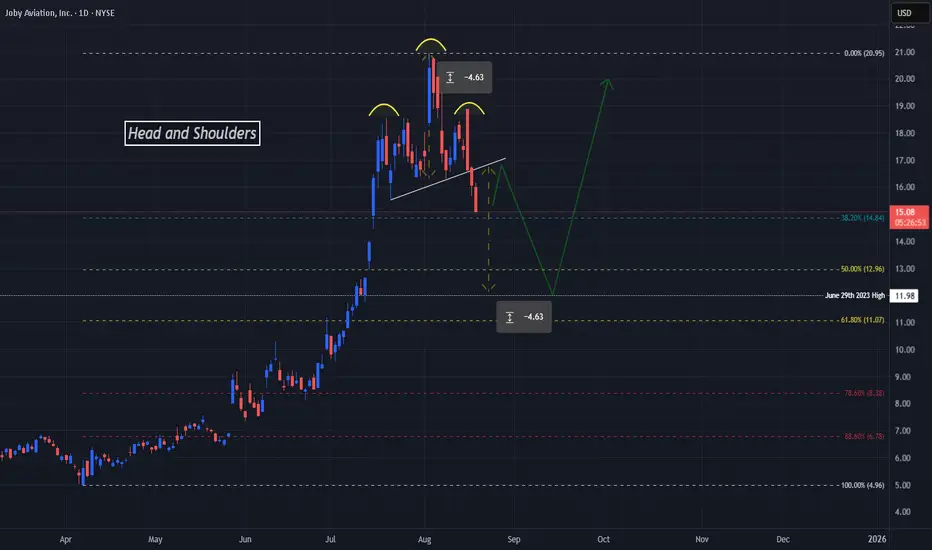
Reversal At New ATH Points To Next Potential Takeoff For JOBYNYSE:JOBY has been making impressive steps lately with reports coming out Friday, August 15th that the company has achieved a great milestone in being the first to fly a piloted electric vertical takeoff and landing air taxi or eVTOL from one public airport being Marina (OAR) to Monterey (MRY).
www.tradingview.com
To end last week and start this week we see price on NYSE:JOBY plummeting and this decline has confirmed a very strong reversal pattern, the Head and Shoulders!
Now, Price has made a solid breakout of the Neckline or Support of the Pattern so we can suspect a potential pullback to the Neckline for a Retest before moving down further in the coming days.
Based off the Potential Extension of a Confirmed Breakout and Validated Retest of a Head and Shoulders Pattern, we can suspect that Price will fall the same length as from the Head to the Neckline, being approx. $4.63, which would land Price not only right in the middle of the Fibonacci Golden Ratio Zone but also a Previous High from June of 2023 @ $11.98! --> This will be the next Buy Opportunity!
With NYSE:JOBY expanding by purchasing Blade Air Mobility who operated in lounges and terminals in the US and Europe and plans to deploy commercially in 2026, this could be a great stock to stock up on!
www.tradingview.com