XRP/USD 2-Week Chart Analysis: Is History Repeating Itself? 1. Overall Structure: The Fractal Recurrence (2017 vs. 2025)
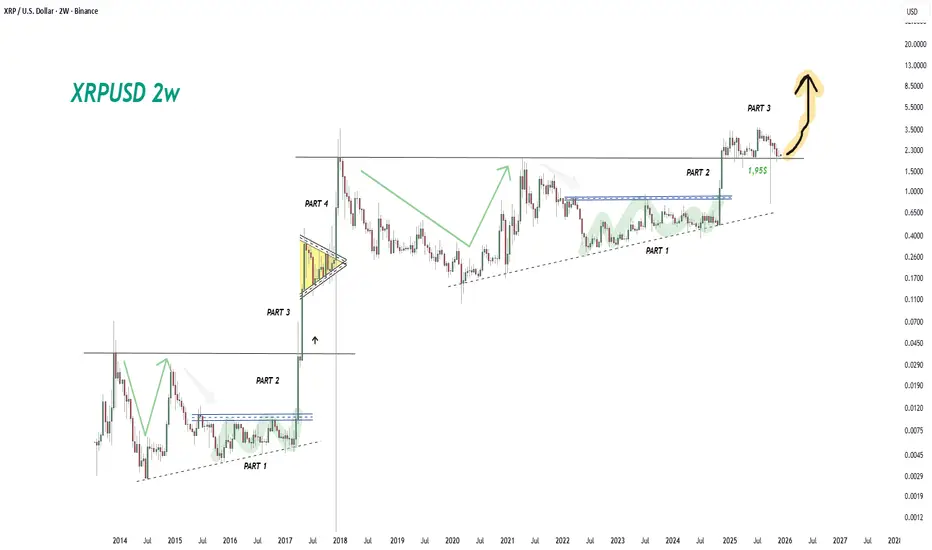
The chart’s main hypothesis is that the cycle experienced by XRP between 2014 and 2017 is almost an identical copy of the current cycle spanning 2021 to 2025.
Left Side (2014-2017): Depicts the "dead" period, accumulation, and subsequent vertical surge that preceded XRP’s legendary 2017 rally.
Right Side (Current Situation): Shows a similar "rounding bottom" formation, consolidation, and the recent breakout.
2. Segment-by-Segment Technical Breakdown
Let's evaluate the labeled "PART" segments on the chart individually:
PART 1 (Accumulation Phase):
In both cycles, this was a period where investor patience was tested, and the price was suppressed within a specific range (below the dashed blue lines) for an extended time.
In the current cycle, this process (2022-2024) lasted significantly longer. A fundamental rule in technical analysis states: "The bigger the base, the higher in space." This prolonged sideways movement indicates a massive build-up of energy that could intensify the magnitude of the eventual surge.
PART 2 (Breakout and Retest):
The moment the blue resistance area is broken to the upside.
The chart suggests we are currently at the tail end of, or have just completed, this phase. Price consolidation and sustained movement above the blue box confirms the official end of the downtrend and the start of a bull market.
PART 3 (Parabolic Rise - Discovery Phase):
This is the most critical juncture of the chart. In 2017, following "Part 2," the price rose in a near-vertical line, seemingly defying gravity.
The analysis contends that we are standing right on the precipice of this "vertical lift-off" in the current cycle. The large yellow arrow indicates an expectation for the price to accelerate rapidly on the logarithmic scale.
Critical Level: The $1.95 Support:
The $1.95 level, marked in green, is of vital importance. This was the previous major resistance. According to technical analysis, "Once resistance is broken, it turns into support."
The price currently holding above this level (performing a successful retest) is the most crucial confirmation point for the continuation of the uptrend.
3. Targets and Expectations
Considering the yellow arrow and the scaling on the right side of the chart:
Short-to-Medium Term: The first primary target is the range around XRP's All-Time High (ATH) of $3.30 – $3.84.
The Chart's Implied Target: If the 2017 fractal plays out precisely, the chart suggests a peak target between $9.00 and $13.00 (or potentially even higher).
4. Risks and Commentary from an Experienced Analyst
While the chart is visually compelling, as an experienced broker, I must add these nuances:
Market Cap Reality: The crypto market was much smaller in 2017. For XRP to hit $10+ now implies reaching a colossal market capitalization. While not impossible (logic often takes a backseat in crypto mania), expecting the exact "x100" moves of 2017 is mathematically more challenging.
Fundamental Catalysts (SEC and ETF): The success of this chart relies not just on technical data but on fundamental factors. SEC lawsuit closure, rumors of an XRP ETF, and Ripple’s stablecoin moves are the core elements that will fuel this "Part 3."
Volatility Warning: Parabolic rises (Part 3) are accompanied by very severe corrections (sudden drops of 30-40%). This is the most dangerous territory for leveraged trading.
Conclusion
Outlook: Extremely Positive (Bullish). Strategy:
If you currently hold XRP: A "Hold" strategy seems prudent as long as the $1.95 level is maintained. The trend momentum is extremely strong.
For New Entries: Retracements (retests) into the $1.95 - $2.10 range could be viewed as secure buying opportunities.
In summary: The chart indicates that XRP is at the moment of "breaking its chains" that has been long-awaited. If Bitcoin does not derail the broader market, double-digit targets ($10+) for XRP are technically on the table.
BONUS CHART:
XRP/DXY 1w
Ripple
XRP Review With Focus on Trend Shifts XRP is completing the previously formed bearish butterfly pattern on the global timeframe.
At the same time, a large bullish flag is visible in the chart structure, within which the price continues to move. The lower liquidity zone has already been fully engulfed, while the upper liquidity zone remains intact, making it potentially attractive for a subsequent test.
Also, each new correction forms a higher bottom, indicating a possible global trend recovery. If the lower boundary of this liquidity zone is broken, the structure could shift to a deeper downward movement.
Full breakdown with levels and graphs on the website

I think the only one Liking my post is me!This is my last hope for RIPPLE. If this support is lost and the descending triangle pattern proves valid and the price follows it, Dogecoin will fall below 1.8 cents for a long time. But since the crypto market often breaks rules and patterns, maybe this time it will reverse again and, after breaking the triangle, push the price back above 2.3 cents.
What do you think will happen? Leave a comment !

TradeCityPro | XRP Compressing at Key Support Ahead of Breakout👋 Welcome to TradeCity Pro!
In this analysis, I want to review XRP, one of the oldest cryptocurrencies, currently ranked 4th on CoinMarketCap with a $127 billion market cap.
🗓 Daily Timeframe
On the daily timeframe, XRP is sitting on a very important support zone and has entered a compression (squeeze) phase over the past few days.
⭐ The bottom of this compression is 2.0242, and the top is 2.2317.
✔️ If this compression breaks on either side, the price can begin a new impulsive wave.
🎯 So, if either 2.0242 or 2.2317 breaks, we can open a position.
🎲 However, one important point:
Breaking 2.0242 is just the first trigger for entering the major support zone.
⚡️ Breaking this support will not be easy, price has attempted to break it several times and failed.
💥 Because of that, a safer short entry would be to wait for a break of the support floor at 1.7864.
↗️ For a long position, if the 2.2317 zone breaks with strong increasing volume, we can enter a long setup.
⚖️ For XRP to turn bullish, it’s very important that the RSI stabilizes above 53.22.
💡 A break above this RSI level will be the first momentum confirmation for a bullish trend reversal.
📝 Final Thoughts
Stay calm, trade wisely, and let's capture the market's best opportunities!
This analysis reflects our opinions and is not financial advice.
Share your thoughts in the comments, and don’t forget to share this analysis with your friends! ❤️

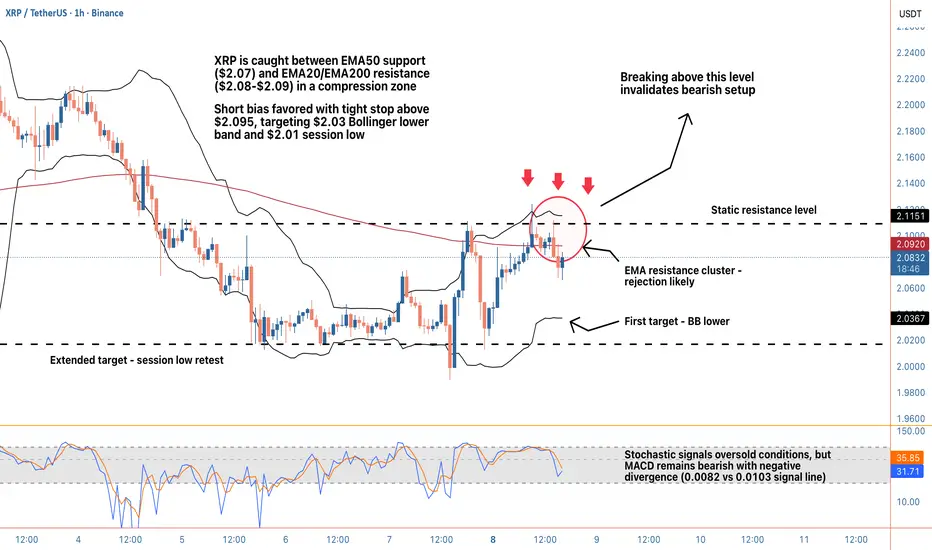
A short setupHey guys, XRP is navigating a tight compression zone on the 1-hour timeframe, trading at $2.07 and caught between critical moving average levels that are setting up a potential directional break. Price is sitting right on the EMA50 at $2.07, which has been acting as immediate support, but overhead we've got a resistance cluster formed by the EMA20 at $2.08, EMA200 at $2.09, and HMA55 also at $2.09. That's a lot of technical density above current price, and the repeated rejections from this zone over the past several hours suggest sellers are defending it aggressively. The 24-hour range spans from $2.01 to $2.12, and we're currently positioned in the lower half, about 6 cents off the highs and 6 cents above the lows.
The technical indicator suite is painting a mixed but ultimately bearish picture. Stochastic has crashed to 12.2, firmly in oversold territory, which on the surface might suggest a bounce is overdue. However, context matters here. The MACD remains in bearish configuration with the MACD line at 0.0082 sitting below the signal line at 0.0103, indicating momentum hasn't shifted despite the oversold reading. RSI at 48.5 is neutral, not providing much directional conviction, but it's worth noting we're not seeing bullish divergence that would typically accompany a reversal setup. The ADX at 33.5 confirms we're in a moderate trending environment rather than choppy consolidation, and when you combine that with the lower high formation visible in recent price structure, the trend bias leans bearish.
Volume analysis is critical here and it's telling a bearish story. Current volume sits at just $10.8M, roughly 50% below the average of $21.5M. That lack of participation during this consolidation phase suggests buyers aren't showing up with conviction, even at these relatively attractive levels. When price compresses near support without volume expansion, it often precedes a breakdown rather than a reversal. The wick analysis adds another layer: lower wicks comprise 55.5% of recent candle structures, showing there have been attempts to bid price higher, but the minimal 7.3% upper wicks tell us those rallies are getting faded quickly. That's classic distribution behavior where each bounce gets sold into.
Bollinger Bands provide additional context for potential targets. Price is currently trading just below the middle band at $2.07, with the upper band at $2.11 and lower band at $2.03. The bands are relatively tight, suggesting we're in a consolidation phase that's likely to resolve with a directional move soon. The MFI (Money Flow Index) at 43.0 sits below the midpoint, confirming that money flow is leaning negative but not extreme. This supports the thesis of a measured grind lower rather than a panic sell-off.
From a price structure perspective, the lower high formation is the key bearish signal. After tagging $2.12 in the 24-hour session, price has failed to reclaim that level and instead printed a lower high, which is textbook bearish price action. The internal market state shows a bearish bias with a trending regime and only 26.4% directional confidence, suggesting the move might not be explosive but rather a methodical drift lower. The alignment score of 4 and the bear stack dominating (4 bearish indicators vs 1 bullish) reinforce this directional lean.
For a trading setup, I'm looking at short entries on any bounce toward the $2.075-$2.08 zone, particularly if we see rejection wicks forming at the EMA20. The stop loss would sit just above the resistance cluster at $2.095, providing about 20 pips of breathing room while staying below the HMA55. A close above $2.095 would invalidate the bearish structure and suggest buyers are regaining control, so that's a logical invalidation point. First take profit target comes in at the Bollinger lower band at $2.03, offering approximately 4.5 cents of downside for roughly 2 cents of risk, which delivers better than 2:1 risk-reward. Second target would be the session low at $2.01, extending the potential reward to nearly 3.5:1 if we get full follow-through and momentum acceleration.
The key level to watch is $2.07, where the EMA50 and Bollinger middle band converge. If price breaks and holds below this level with volume confirmation, I'd expect acceleration toward $2.03 as there's minimal structural support in between. Conversely, if bulls want to flip the script, they need to reclaim $2.09 with conviction and push volume above that $21.5M average to prove there's genuine buying interest rather than just short-term bounce attempts. The 24-hour change of +1.41% shows we're still in positive territory for the day, but the intraday structure has deteriorated, and the failure to hold the EMA20 is a warning sign.
Risk management is crucial in this setup given the mixed signals from oversold indicators. While Stochastic at 12.2 suggests we're technically due for a bounce, trading against established bearish structure and weak volume is risky. The safer play is waiting for either a confirmed breakdown below $2.07 or a clear rejection from the $2.08-$2.09 resistance zone. If you're already short from higher levels, consider taking partial profits at $2.03 and trailing stops on the remainder toward $2.01. If you're looking to enter fresh, patience for a bounce into resistance offers better risk-reward than chasing current levels.
What are you thinking on this XRP setup? Are you fading the weakness for a bounce play off EMA50 support, or riding the bearish structure down toward those lower targets?
XRP: Likely to Move Lower Ripple’s XRP is expected to retrace further into the green Target Zone ranging from $1.03 to $0.38 as part of a blue downward impulse, which would complete the higher-level turquoise wave B. Afterward, wave C should drive price sharply higher, ultimately setting a new high for the larger wave (Y) above the resistance at $4.09. However, if bulls manage to push the altcoin above the $3.19 resistance and the $4.09 level in the near term—a scenario we estimate has a 30% probability—it would suggest that the turquoise alt.B wave has already been completed, and our Target Zone would no longer be reached.

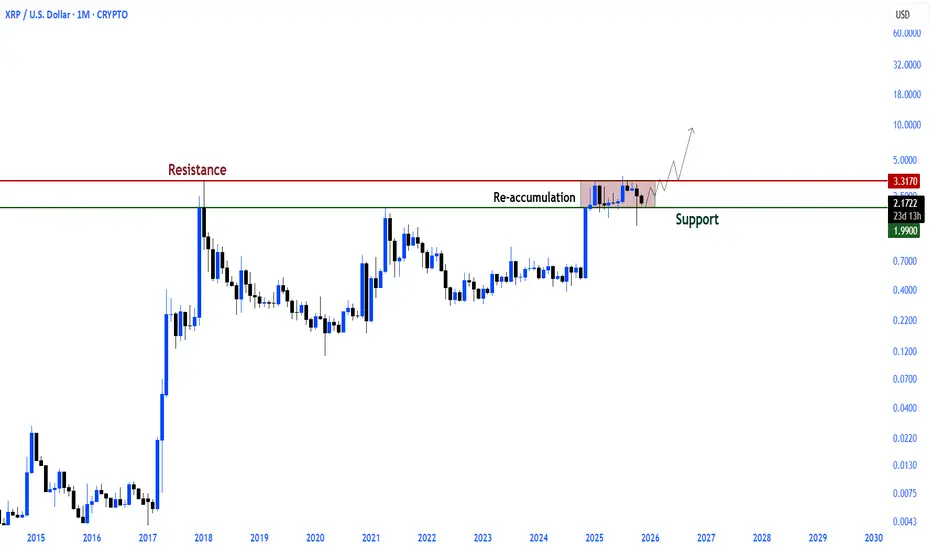
The table is clear in $XRP
Ripple is still in a clear re-accumulation phase between the $3.3 major resistance and the $1.99 support.
Unless the structure is broken, this silence will trigger a new leg.
XRP/USDT Professional Analysis – SMA Breakout Validated🌐 Professional XRP/USDT Trade Map — Breakout, Targets, Risk Controls
Asset: XRP/USDT – “RIPPLE VS TETHER”
Crypto Market Opportunity Blueprint (DAY/SWING Trade) 🚀📊
🔥 TRADE PLAN OVERVIEW
Plan: Bullish plan confirmed with Simple Moving Average breakout 📈✨
Entry: YOU CAN ENTRY ANY PRICE LEVEL 🟩🟢
This structure is built on momentum continuation + clean SMA upside confirmation.
🛡️ STOP LOSS GUIDANCE
Stop Loss: This is thief SL @ 2.0000
Dear Ladies & Gentleman (Thief OG's) — adjust your SL based on your strategy & your own risk.
⚠️ Note: I am not recommending you to set only my SL. It's your own choice; you can make money then take money at your own risk.
🎯 TARGET LEVEL – PROFIT MANAGEMENT
Target: TRIANGULAR Moving Average acts as a strong resistance + overbought zone + trap region.
📌 OUR target @ 2.3000 — kindly escape with profits before the trap activates.
⚠️ Note: Dear Ladies & Gentleman (Thief OG's), I am not recommending you to set only my TP. It's your own choice; you can make money then take money at your own risk.
🌍 RELATED PAIRS TO WATCH — CORRELATIONS & KEY POINTS
Monitoring correlated assets gives extra confirmation of trend strength, liquidity flow, and momentum shifts. Here are the pairs to keep an eye on:
💠 1. BINANCE:BTCUSDT – Bitcoin Controls Crypto Liquidity
Why watch it:
BTC is the macro driver of overall crypto momentum.
A bullish BTC → stronger inflow into alts like XRP.
If BTC rejects from key levels, XRP often slows or traps.
Key correlation:
Rising BTC dominance can limit XRP upside.
Falling dominance supports large-cap alt breakouts.
💠 2. BINANCE:ETHUSDT – Ethereum Trend Confirms Alt-Market Strength
Why watch it:
ETH often leads altcoin rotations; when ETH trends strong, major alts follow.
ETH breaking resistance = broader bullish environment for XRP.
Key correlation:
Strong ETH liquidity → better confidence for XRP swing trades.
💠 3. BINANCE:XLMUSDT – Directly Related Utility Sector Coin
Why watch it:
XLM and XRP often move with similar cross-border payment narratives.
When XLM surges first, XRP commonly follows with a delayed reaction.
Key correlation:
Positive XLM momentum strengthens confidence in XRP bullish setups.
💠 4. BINANCE:ADAUSDT – Risk-On Altcoin Indicator
Why watch it:
ADA rallies typically signal strong retail participation in altcoins.
Helps confirm whether the market is in alt season rotation mode.
Key correlation:
ADA strength → XRP follow-through probability increases.
💠 5. BINANCE:XRPBTC – Relative Strength Indicator
Why watch it:
If XRP/BTC is rising, XRP is outperforming Bitcoin → strong signal.
If XRP/BTC is dropping, XRP bullish trades may weaken or get trapped.
Key correlation:
XRP/BTC breakout = highest-quality long confirmation.
📌 SUMMARY FOR TRADINGVIEW READERS
This XRP blueprint delivers a clear bullish continuation setup powered by SMA breakout momentum, structured risk guidance, and a realistic trap-aware profit target. Monitoring correlated pairs amplifies your confidence, especially during critical breakout or overbought zones.

FireHoseReel | XRP Breaks Key Support, Eyes $1.99 Next🔥 Welcome To FireHoseReel !
Let’s jump into Ripple (XRP) market analysis.
👀 XRP 4H Overview
Compared to most coins in the market, XRP has experienced a sharper sell-off. Based on chart data, it has now broken its dynamic support and is currently moving toward the next dynamic support around $1.9928.
📊 Volume Analysis
XRP volume has declined due to the holiday period, so we rely more on past reactions. Previously, price attempted to defend this zone and bounce higher. This time, however, the level has been broken with a strong sell-off candle.
✍️ XRP Trading Scenarios
🟢 Long Scenario:
A breakout above the local high at $2.2454, supported by strong buying volume, could trigger a sharp upside move.
🔴 Short Scenario:
At the moment, a stop can be defined above the previous 4H candle. For a safer entry, wait for a reaction at $1.9928—if this support breaks with selling pressure, a short setup becomes valid.
🧠 Protect your capital first. No setup is worth blowing your account. If risk isn’t controlled, profit means nothing. Trade with rules, not emotions.

Will XRP Price Fall to $2 Again or Will This Explosion Save It?XRP is trading at $2.06 after two failed attempts to break the $2.20 resistance this week. The altcoin is now drifting toward the familiar $2.02 support level, which previously acted as a strong rebound point.
If XRP sees renewed investor confidence and a bounce from $2.02, the price could climb back to $2.20. A successful breakout above this resistance may open the door to $2.26, supported by the potential volatility surge indicated by the squeeze.
However, a breakdown remains a risk. Losing the $2.02 support would place $2.00 in immediate danger. A fall below that threshold could push XRP toward $1.94 or even $1.85, invalidating the bullish outlook and signaling deeper correction potential.

XRPUSD — WEEK 49 TREND REPORT (2D)XRP — WEEK 49 TREND REPORT
Ticker: COINBASE:XRPUSD BITSTAMP:XRPUSD — 12/01/2025 @ 2.02$
Timeframe: 2D
This is a reactive structural classification of XRPUSD based on the 2D chart as of this timestamp. Price conditions are evaluated as they stand — nothing here is predictive or forward-assumptive.
⸻
1) Current Trend Condition
• Trend Duration: +3 BARS (bearish)
• Trend Reversal Level: 2.06$
• Trend Reversal Level ( Confirmation ): 2.26$
⸻
2) Structure Health
• Retracement Phase:
• Testing Structure (approaching 38.2% @ 1.64$)
• Position Status:
• Unstable (price below both structural layers)
⸻
3) Temperature: Cooling Phase
⸻
4) Momentum: Bearish
⸻
Author’s Note
This analysis is fully reactive, not predictive. Market conditions, trend structure, and behavior are classified as they appear in real time. The objective is to identify where directional shifts first occurred, where structural integrity remains intact, and where it would begin to weaken if key levels were breached.
Predictive analysis projects outcomes that do not exist yet. Without price confirmation, prediction is built on baseless assumptions. This framework avoids that entirely by responding only to verified structural changes and live conditions.
The levels shown simply identify where the current trend structure first shifted and where it would begin to lose integrity if breached. Recognizing these boundaries allows for clearer interpretation of market behavior without relying on forward guarantees, speculative projections, or unsupported assumptions.
⸻
Methodology Overview
This classification framework evaluates directional conditions using internal trend-interpretation logic that references price behavior relative to its structural layers. These relationships are used to identify when price movement aligns with the framework’s criteria for directional phases, transition points, or regime shifts. Visual elements or structural labels reflect these internal interpretations, rather than explicit trading signals or preset indicator crossovers. This framework is observational only and does not imply future outcomes.

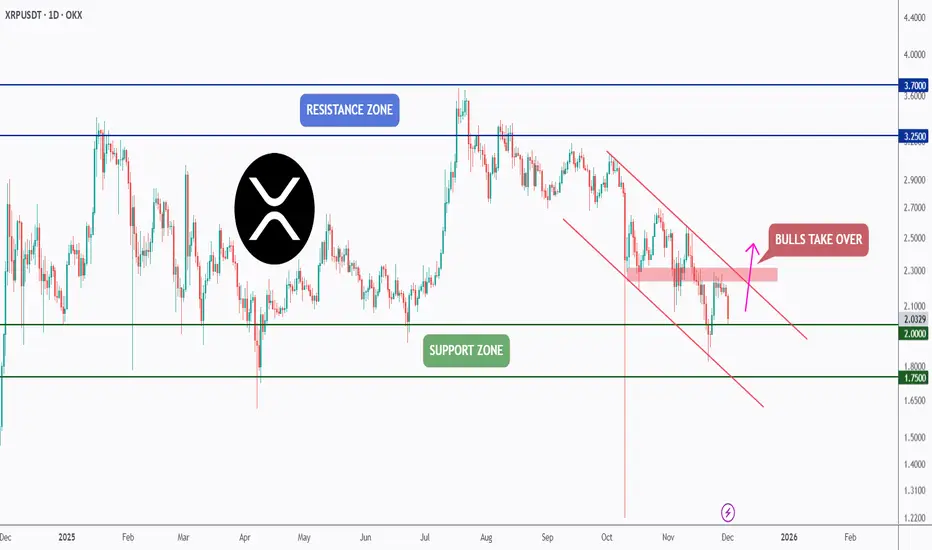
XRP - Support First, Breakout Second!📦XRP has been holding well above its key support zone , and as long as this level continues to act as a floor, we will be looking for long setups. Buyers have defended this zone multiple times, making it a critical area for a potential bullish reaction.
🏹However, for the bulls to fully take over, XRP needs more than just a bounce. A confirmed break above the falling channel and the last major high in red is needed to shift the momentum and open the door for a larger bullish leg.
Until then, the plan remains simple:
Support holds → look for longs.
Structure breaks → bulls take control.
Will XRP finally break free from this falling channel? 🤔
⚠️ Disclaimer: This is not financial advice. Always do your own research and manage risk properly.
📚 Stick to your trading plan regarding entries, risk, and management.
Good luck! 🍀
All Strategies Are Good; If Managed Properly!
~Richard Nasr
XRP Breakdown Risk: Triangle + Resistance = DropXRP( BINANCE:XRPUSDT ) is moving within a resistance zone($2.32-$2.19) and has shown notable reactions to the resistance line and the Potential Reversal Zone(PRZ) .
From a technical analysis perspective, it seems that XRP has formed a Symmetrical Triangle Pattern. If the lower line of this pattern is broken, it would align with our analysis.
Additionally, from an Elliott Wave theory standpoint, we expect the next corrective wave for XRP, and a break of that lower triangle line would confirm this expectation.
I expect that in the upcoming hours, XRP will begin a downward trend and test the support zone($2.16-$2.11). If it breaks through that support, we can expect further declines toward the next support zone($2.04-$2.00) and Cumulative Long Liquidation Leverage($2.04-$2.02).
First Target: $2.133
Second Target: $2.069
Third Target: $2.043
Stop Loss(SL): $2.330
Cumulative Short Liquidation Leverage: $2.30-$2.25
Cumulative Long Liquidation Leverage: $2.16-$2.13
💡 Please respect each other's opinions and express agreement or disagreement politely.
📌 XRP Analyze (XRPUSDT), 1-hour time frame.
🛑 Always set a Stop Loss(SL) for every position you open.
✅ This is just my idea; I’d love to see your thoughts too!
🔥 If you find it helpful, please BOOST this post and share it with your friends.

XRP/USD LONG SET UP TRADETitle: XRP/USD (RIPPLE) BUY
Asset: Crypto
Symbol: XRP/USD
Market Entry Price 1: $2.19
Stop Loss: $2.14
Take Profit 1: $2.24
Take Profit 2: $2.28 (close 25 %)
Take Profit 3: $2.34 (close 50%)
Take profit 4: $2.45
Status: ACTIVE

XRP RoadMap (1D)Let's take a look at Ripple to see what fluctuations it may experience over the next month or two.
We considered the upward move in 2024 as Wave A, the following correction as Wave B, and the third rise as a terminal 5-wave structure.
The sharp downward move is considered a post-pattern terminal, and now the waves we are in are regarded as a bearish cycle, forming an expanding/diametric/symmetrical triangle.
Whatever the larger pattern is, in aggregation it seems that the price will move downward from the red zone to the short-term targets marked on the chart.
The targets are marked on the chart.
A daily candle closing above the invalidation level will invalidate this analysis
For risk management, please don't forget stop loss and capital management
When we reach the first target, save some profit and then change the stop to entry
Comment if you have any questions
Thank You


XRP/USDT Analysis. Long Setup
XRP shows weak selling pressure, while cumulative delta is rising on the entire decline, indicating background buying activity.
We expect a test of the $2.17–$2.154 buy zone. If a reaction appears, we consider a long position toward the nearest local high.
This publication is not financial advice.

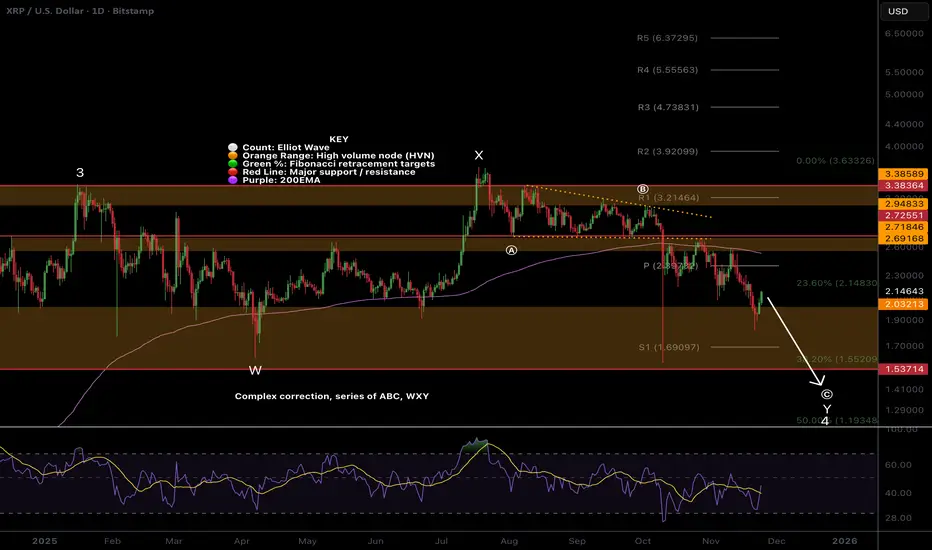
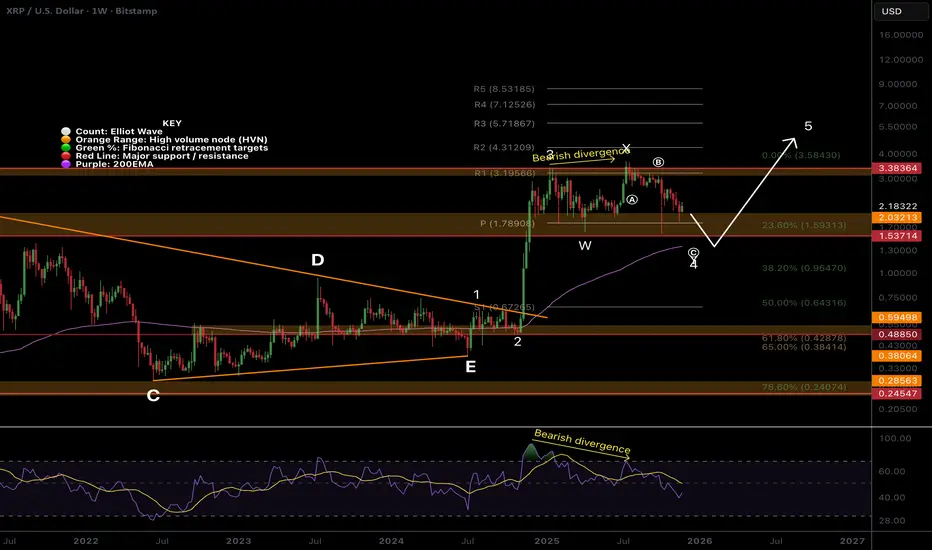
$XRP count changed, wave 4 underwayCRYPTOCAP:XRP Wave 4 appears to be a flat correction defined by the poke above the all-time high. Wave 4 is expected to end at the 0.382 Fibonacci retracement, also the weekly 200EMA ~$1.2.
The multi-year triangle is a penultimate move, so continuation in wave 5 to price discovery is my preferred count. For no,w price is stuck in a range aboev the weekly pivot.
🎯 Terminal target for the business cycle could see prices as high as $4.31 based on the weekly pivots
📈 Weekly RSI is bearish with room to fall after printing bearish divergence
👉 Analysis is invalidated if we fall below $0.64, as wave 4 can not go below 0.55 Fibs
Safe trading
XRP/USD Swing Trade Playbook — Bullish Breakout Profit Pathway📌 Asset:
XRP/USD – “Ripple vs U.S. Dollar” | Crypto Market Profit Pathway Setup (Swing Trade)
📈 Trade Plan (Bullish Bias)
Waiting for a HULL Moving Average breakout above 2.2500 to confirm bullish continuation momentum.
Once price breaks decisively, the structure opens room for a strong push toward the next liquidity zone.
🎯 Entry
Enter any price level AFTER a clean Hull MA breakout with candle body confirmation + volume uptick.
No breakout → No trade.
🛡️ Stop-Loss (Risk Protocol)
SL: 2.0500 — This is the Thief SL, designed to protect capital once breakout is confirmed.
Dear Ladies & Gentlemen (Thief OG’s), adjust your SL according to:
Your personal risk tolerance
Your system’s volatility rules
Timeframe-based noise filtering
You’re not required to follow my SL — trade safe, protect your bag. 🛡️
💰 Target (Exit Strategy)
Our next potential trouble zone — where the police (sellers) are waiting — stands near:
TP: 2.5500
This zone aligns with:
Overbought conditions
Previous liquidity sweep
Correlation pressure from broader crypto sentiment
Dear Ladies & Gentlemen (Thief OG’s), take profits based on your own system. Take money → Leave the market → Stay safe. 💸
🔍 Related Pairs to Watch (Correlation & Confirmation Signals)
1️⃣ BITSTAMP:BTCUSD – Bitcoin
Why watch it?
XRP often follows BTC’s trend.
A BTC breakout boosts liquidity across altcoins.
BTC above key moving averages = XRP tailwind.
2️⃣ BITSTAMP:ETHUSD – Ethereum
Why watch it?
Strong indicator of altcoin strength.
ETH momentum = altcoins tend to expand.
If ETH stalls while XRP breaks → caution (divergence).
3️⃣ COINBASE:XLMUSD – Stellar
Why watch it?
XRP & XLM share similar utility narratives.
High correlation during liquidity rotations.
XLM breakout → XRP often lags then follows.
4️⃣ BITSTAMP:XRPBTC Pair
Why watch it?
Shows whether XRP is outperforming BTC.
Rising XRP/BTC ratio = stronger XRP pump potential.
Falling ratio = breakout may fake out.
🧭 Key Correlation Notes
BTC strength = XRP stability + possible breakout fuel
ALT dominance rising → higher probability XRP joins the move
USD weakness boosts all crypto pairs priced in USD
Watch volatility cycles: XRP typically pumps after Bitcoin’s volatility cools

Ripple long term roadmap.This is my long term view.
* The purpose of my graphic drawings is purely educational.
* What i write here is not an investment advice. Please do your own research before investing in any asset.
* Never take my personal opinions as investment advice, you may lose your money.

Ripple Is Still Bullish Despite Recent Spike LowerRipple is still bullish despite the recent spike lower, which can act as a strong support from a technical and Elliott wave perspective.
Ripple is a blockchain-based digital payment protocol designed for fast, low-cost international money transfers. Its native cryptocurrency, XRP, helps facilitate transactions between different currencies, making cross-border payments quicker and cheaper compared to traditional systems like SWIFT.
Ripple sold-off recently and it made a huge spike lower due to the market manipulation, but these spikes usually act as a strong support. It still looks like a complex W-X-Y correction in wave IV on a daily chart, which can now resume the bullish trend within final wave V of (V).
In the 4-hour chart, we can see a massive spike down, but out of wave (B) triangle pattern, so it’s a penultimate move into wave (C) of Y. With the current strong rebound and recovery, seems like bulls are back in the game, and it looks to be forming a bullish setup with waves 1 and 2. So watch out for further rally within wave 3 of a five-wave bullish cycle, especially if jumps back into 2.7 area and later above 3.10 bullish confirmation level.

TradeCityPro | XRP Bulls Eyeing Key Support for Surge👋 Welcome to TradeCity Pro!
In this analysis, I want to review the XRP coin, one of the oldest cryptocurrencies, with a $124 billion market cap, currently ranked 4th on CoinMarketCap.
⏳ 4-Hour Timeframe
After the recent market decline, XRP was one of the coins that managed to recover well. It was supported at 1.8733, and with the activation of the 2.0383 trigger, the price made an upward move.
✔️ Currently, the price is at a very important support zone, and as you can see, it is reacting to this level.
💥 The RSI oscillator has moved close to the overbought zone. If it enters this zone, the momentum of this coin will increase significantly, and the price could continue its bullish movement, potentially reaching higher levels.
✨ If the support zone holds, we can open a long position.
For a more accurate trigger, it's better to wait until the price touches this level a few more times and then activate the trigger.
🔔 The next resistance zones for XRP are 2.3404 and 2.5508, which can be used as targets.
The main trigger for confirming the bullish trend on higher cycles will be the break of 2.5508.
🔍 If the price gets rejected from this level and moves back toward 1.8733, we can open a position if volume starts to increase, using a candlestick setup. Otherwise, we can enter with a break of 1.8733.
📝 Final Thoughts
Stay calm, trade wisely, and let's capture the market's best opportunities!
This analysis reflects our opinions and is not financial advice.
Share your thoughts in the comments, and don’t forget to share this analysis with your friends! ❤️

XRP count changed, wave 4 underwayPrice appears to have completed a WXY after the Oct 10th flash crash, but further downside is possible to complete wave 4.
Wave (B) completed a barrier triangle, which suggests the thrust down was the final move before reversal. Price has revisited the wick- expected price behaviour, and we are now looking for a bottom.
Price is below the daily 200EMA and pivot, which is bearish.
📈 Daily RSI reached oversold with no divergences
👉 Continued downside brings up the $1.75 High Volume Node EQ
Safe trading