Xrp - The path remains bullish!🔔Xrp ( CRYPTO:XRPUSD ) will still head higher:
🔎Analysis summary:
Looking at the overall picture, Xrp has still been consolidating for the past eight years. This does not mean however, that Xrp cannot break out and head much higher in the future. It simply all just comes down to an all time high breakout, together with the potential bullish triangle breakout.
📝Levels to watch:
$3.0, $1,7
SwingTraderPhil
SwingTrading.Simplified. | Investing.Simplified. | #LONGTERMVISION
Ripple

LTC/USDT | Litecoin Consolidating – Can Bulls Smash $150 RSTNCE!By analyzing the Litecoin (LTC) chart on the weekly (logarithmic) timeframe, we can see that after our last analysis, the price successfully reached the targets at $92.5 and $115. Currently, it is trading around $115.
The price now faces a strong resistance zone between $120–$150. Litecoin is consolidating and building enough momentum to attempt a strong breakout of this zone. If it manages to break through, the next bullish targets will be $155, $200, and $268.
Please support me with your likes and comments to motivate me to share more analysis with you and share your opinion about the possible trend of this chart with me !
Best Regards , Arman Shaban

XRP - Triangle Breakout, Eyes on 3.2?XRP broke out of its descending triangle on the daily and shifted the structure bullish. Price is now trading inside the 3.00–3.20 resistance band.
This zone is key 🔑. It’s prior supply and the top of the range. A clean daily close above 3.20 would open 3.40, then 3.60+ inside a fresh markup leg.
If buyers fail to clear it, I’ll watch for a healthy dip toward 2.80–2.90 (triangle base + demand) to reload. Bias stays bullish while the 2.70–2.80 floor holds.
What’s your plan - buy the break above 3.20 or wait for a retest into 2.80–2.90? 🤔
⚠️ Disclaimer: This is not financial advice. Always do your own research and manage risk properly.
📚 Stick to your trading plan regarding entries, risk, and management.
Good luck! 🍀
All Strategies Are Good; If Managed Properly!
~Richard Nasr

BTC/USDT | BTC Correction Done? Next Pump Loading…By analyzing the Bitcoin chart on the 4-hour timeframe, we can see that the price moved higher as expected, reaching around $118,000. After that, Bitcoin corrected down to the $115,000 demand zone. Once it touched this level, demand stepped in again and the price bounced back.
Currently, Bitcoin is trading around $116,000. If the price holds above the $114,400–$115,000 support zone, we can expect the start of another bullish wave.
Please support me with your likes and comments to motivate me to share more analysis with you and share your opinion about the possible trend of this chart with me !
Best Regards , Arman Shaban


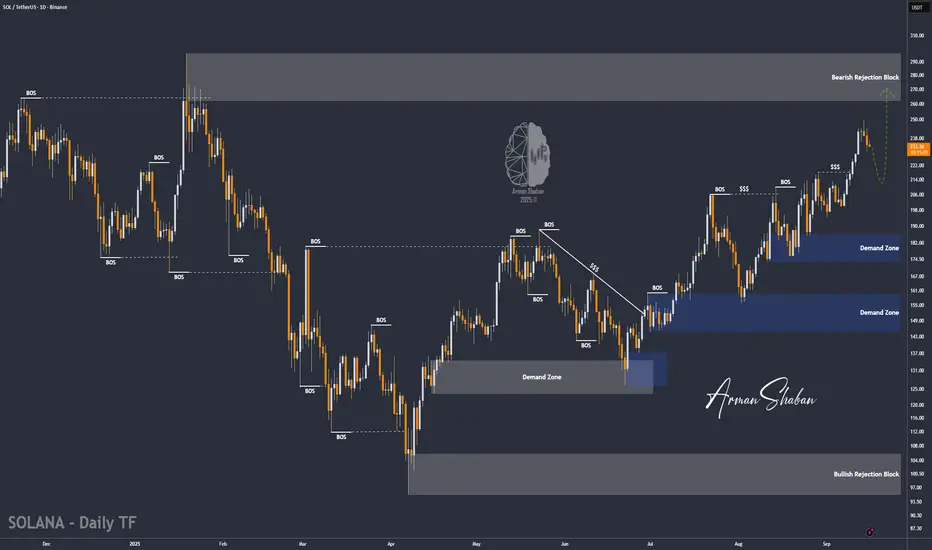
SOL/USDT | Solana Correction Over? Big Rally Loading Soon!By analyzing the Solana chart on the daily timeframe, we can see that after a correction, the price is now trading around $234. In the short term, I expect a small pullback, followed by another strong bullish move from this coin.
The key demand zone is between $210–$220, while the possible upside targets are $250, $260, and $296.
Please support me with your likes and comments to motivate me to share more analysis with you and share your opinion about the possible trend of this chart with me !
Best Regards , Arman Shaban
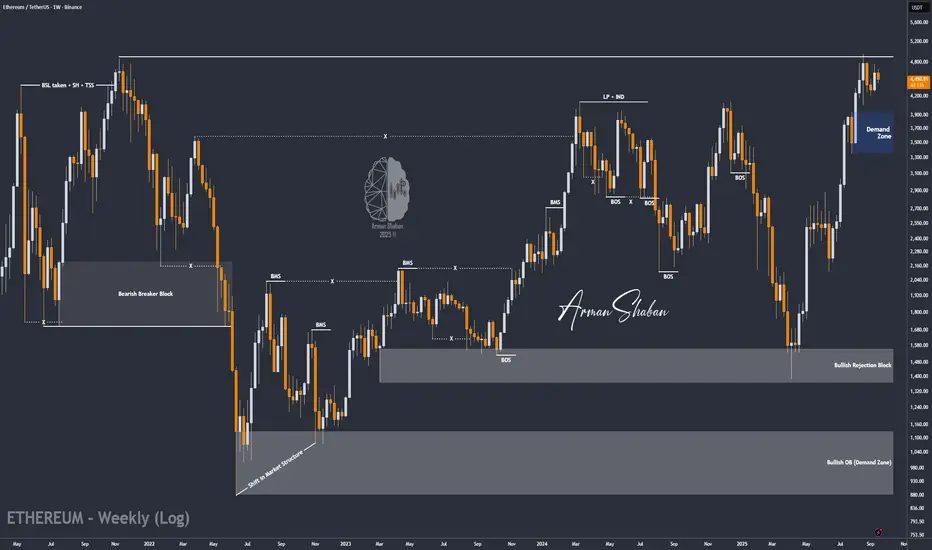
ETH/USDT | Ethereum Pullback Over? Next Stop New Highs! (READ)By analyzing the Ethereum chart on the weekly timeframe, we can see that after climbing to $4,700, the price pulled back and is now trading around $4,500. If ETH can hold above the $4,480 level, we can expect more upside.
However, today the market will be very volatile due to the Fed interest rate decision. With that condition in mind, the next possible bullish targets for Ethereum are $5,100, $5,500, and $6,000.
Please support me with your likes and comments to motivate me to share more analysis with you and share your opinion about the possible trend of this chart with me !
Best Regards , Arman Shaban
BTC/USDT | Bitcoin Rally Setup – Next Stops: $116.7K and Beyond!By analyzing the Bitcoin chart on the 4-hour timeframe, we can see that the price is currently trading around $115,500. As long as it holds above the key support zone of $113,700–$115,300, I expect Bitcoin to continue its bullish move toward higher levels.
The next possible upside targets are $116,700, $117,450, and $118,600. Longer-term targets will be shared in future updates!
Please support me with your likes and comments to motivate me to share more analysis with you and share your opinion about the possible trend of this chart with me !
Best Regards , Arman Shaban

#XRP is Approaching a Breakout | Will It Hold or Collapse? Yello, Paradisers! Is #XRP about to confirm a real breakout from months of sideways pain, or is this just another trap? Let’s dissect what’s happening with precision so you’re prepared either way:
💎After weeks of compression beneath a well-defined descending resistance, #XRPUSDT is about to break out. The breakout above this key trendline is now increasing the probability of a bullish continuation, especially with the 50EMA acting as dynamic support and reinforcing the bullish pressure.
💎Currently, the price is trading around $3.00, right above the breakout zone. If the market successfully retests this descending resistance as new support and holds, this would signal strong momentum building up for the next impulsive leg.
💎If that happens, the first upside target is the moderate resistance level at $3.66. A confirmed break above that could send #XRPUSD toward the strong resistance near $4.17, which aligns with the upper boundary of the visible volume profile.
💎On the flip side, the support zone between $2.69 and $2.48 now becomes critical. A retracement into this area could provide a high-probability bounce, but any breakdown and daily close below $2.4849 would invalidate the current bullish setup. In that case, price could unwind sharply, as the bullish structure would be broken, and sellers could regain control.
Stay patient, Paradisers. Let the breakout confirm, and only then do we strike with conviction.
MyCryptoParadise
iFeel the success🌴

Ripple Finished A Correction Within Bullish TrendRipple Finished A Correction Within Bullish Trend, as we see it recovering in an impulsive fashion, which can extend the rally from technical perspective and by Elliott wave model.
Ripple with ticker XRPUSD is waking up from projected support after an ABC correction in wave IV, so bulls could be back, as we see it breaking above channel resistance line and important 3.08 level. So after current short-term pullback, we may see more gains and another push toward all-time highs for wave V, possibly to the 4-5 area.

ADA/USDT | Cardano Targets $1 – Pump Ahead? Let's See!By analyzing the Cardano (ADA) chart on the 3-day timeframe, we can see that after our last analysis, the price corrected down to $0.78. Then, with renewed demand, it started rising again and has so far reached $0.89.
Based on the price action, if ADA can hold above $0.85, we could see a strong rally or even a pump. The possible bullish targets are $0.93, $1.00, and $1.05.
Please support me with your likes and comments to motivate me to share more analysis with you and share your opinion about the possible trend of this chart with me !
Best Regards , Arman Shaban

XRP AGAIN!!!Hello friends
As you can see, the price had a price action gap that has now come and filled this gap and this area has become a strong support that if this area is maintained, we will go for higher targets and if the price falls further in the two support areas, we can buy in steps with capital and risk management.
*Trade safely with us*

XRPETH chart heading to it’s next breakout targetI do think eth will be making decent gains here in the near future, but t looks like xrp will outpace those gains with its own gains based on the current chart pattern on the XRPETH chart. *not financial advice*

SOL/USDT | SOL Breaks 7-Month High – Still Bullish Above $218!By analyzing the Solana chart on the daily timeframe, we can see that the price is still pushing toward higher targets based on the main analysis. It has reached its highest level in the past 7 months and is currently trading around $225.
If the price holds above the key $218 level, we can expect further growth toward levels above $245. This analysis will be updated again. So far, the return from this setup has been more than 52% — I hope you’ve made the most of it!
Please support me with your likes and comments to motivate me to share more analysis with you and share your opinion about the possible trend of this chart with me !
Best Regards , Arman Shaban

DOGE/USDT | Dogecoin Bulls Eye $0.287, $0.32, and Beyond! (READ)By analyzing the Dogecoin chart on the daily timeframe, we can see that, as expected, the price was supported around $0.21, which brought strong demand. This move gave nearly a 20% return, hitting the target at $0.24, and the momentum is still strong. I believe the next target at $0.287 could be reached soon.
The key supply zones are $0.264–$0.289 and $0.305–$0.34. Based on the main analysis, the next possible targets are $0.287, $0.32, $0.41, and even $0.70.
Please support me with your likes and comments to motivate me to share more analysis with you and share your opinion about the possible trend of this chart with me !
Best Regards , Arman Shaban

ETH/USDT | Ethereum Eyes $5,100, $5,500 & $6,000 – New ATH AheadBy analyzing the Ethereum chart on the weekly timeframe, we can see that the price is still trading around $4,400. If it holds above the $3,900 level, I expect a strong bullish wave toward new targets and fresh all-time highs.
Given the current momentum, this bullish move could start soon, with possible targets at $5,100, $5,500, and $6,000.
Please support me with your likes and comments to motivate me to share more analysis with you and share your opinion about the possible trend of this chart with me !
Best Regards , Arman Shaban

XRP Up 4% as Fed Rate Cut Bets as Bulls Eye $3.00 BreakoutTitle: XRP Climbs 4% as Fed Rate Cut Bets Hit 99% — Bulls Eye $3.00 Breakout While Institutional Flows Dictate the Range
XRP extended its recent upside, gaining roughly 4% intraday as market-implied odds of a Federal Reserve rate cut surged to 99%. The move sent XRP back to the critical psychological level at $3.00, where it briefly tagged the handle before consolidating. While support has held firmly above $2.88, repeated failures near $2.99 underscore how institutional flows are increasingly dictating short-term ranges, with systematic and high-frequency participants leaning on predefined liquidity pockets. The big question now: Can bulls engineer a clean break and weekly close above $3.00 to unlock a sustained trend toward $3.30–$3.60?
Below, we unpack the macro catalyst driving crypto risk appetite, the microstructure of XRP’s order flow around $3.00, the key technical levels to watch on multiple timeframes, and how sector stories—from stablecoin settlement initiatives to real-estate tokenization narratives—might reinforce or derail momentum. We also briefly revisit the regulatory overhang and expert takes on whether the Ripple lawsuit paradoxically protected crypto market structure at a fragile moment.
1. Macro Tailwind: Fed Cut Probability at 99% Reignites Risk Appetite
• Policy backdrop: Markets now price a near-certainty of a 25-basis-point rate cut at the Fed’s September 17 meeting, according to interest-rate derivatives and futures-implied probabilities. In crypto, such a setup typically marginally lowers the discount rate on long-duration risk assets, boosts liquidity appetite, and narrows the opportunity cost of holding non-yielding tokens.
• Liquidity impulse: Crypto has historically responded positively to dovish inflections, especially when dovish signals coincide with risk-friendly cross-asset flows—softening yields, a weaker dollar, and compression in credit spreads. While a 25 bp cut is modest in isolation, the signaling effect—especially if paired with data-dependent guidance—can keep speculative positioning skewed to the upside.
• Caveat: With a 99% probability already priced, the risk of a “buy the rumor, sell the news” reaction grows. If the Fed underwhelms on forward guidance or flags stickier inflation risks, crypto could see a fast fade from local highs. That puts heavy emphasis on the path of real yields and the post-meeting press conference tone.
2. Market Microstructure: Institutions Framing the $2.88–$2.99 Range
• Range mechanics: XRP has established a resilient support shelf above $2.88, with responsive buying stepping in on each probe lower. Conversely, the $2.99–$3.00 area continues to attract supply. This behavior often reflects larger players managing liquidity with tight stop-clusters and iceberg orders near round numbers.
• Repeated failures near $2.99: Such failures typically indicate either (a) active distribution by larger holders who prefer to offload inventory into strength, or (b) systematic strategies (quant funds, HFT) sweeping micro-liquidity into offers and resetting the book to keep price contained until a new exogenous catalyst hits.
• Order book dynamics: Thick sell walls near $3.00 can be both a magnet and a lid. The magnet effect pulls price upward during risk-on waves, while the lid effect stalls rallies unless buyers are willing to consume stacked liquidity. A clean break often requires a combination of momentum ignition (positive macro headline, cross-asset tailwind) and absorption of passive offers.
3. Technical Landscape: Higher Lows Intact, $3.00 the First Gate
Intraday and hourly structure
• Trend context: XRP is trading above $2.90 and the 100-hour Simple Moving Average, keeping the immediate trend biased to the upside. A bullish trend line supports price near $2.93 (Kraken spot data), with a near-term defense zone down to $2.86–$2.88.
• Key intraday bullets:
o XRP price is facing hurdles and struggling to clear the $3.00 resistance.
o The price is trading above $2.90 and the 100-hourly SMA.
o A bullish trend line is forming with support near $2.930 on the hourly chart.
o The pair could continue to rise if it holds above the $2.860–$2.88 zone.
• Alternative micro-view: In earlier sessions, price action emphasized the $2.90–$2.92 band as an initial pivot. Dip wicks into $2.86–$2.87 have been bought, aligning with the 100-hourly SMA and trend-line confluence around $2.865–$2.93.
Momentum and RSI
• RSI stance: Hourly RSI has remained constructive, avoiding deep oversold prints even on pullbacks. That supports the “higher lows” narrative. If RSI holds above the midline on dips while price defends the trend line, bulls retain the initiative.
• Breakout momentum: A decisive hourly or 4-hour close above $3.00, followed by a successful retest holding $2.97–$2.99 as new support, would likely tilt momentum accounts long and invite fresh breakout buyers. Such a confirmatory structure reduces the probability of a false break.
Higher timeframes
• Daily chart context: The market is coiling beneath a psychological barrier. A daily close above $3.00 with expanding volume would project toward $3.15–$3.20 initially, then $3.30—a level that aligns with measured move projections from prior range widths.
• Pattern watch: A narrowing descending triangle under $3.00 has formed over recent sessions. While descending triangles are often bearish continuations, in crypto they can also resolve upward when macro tailwinds are strong. The critical tell is whether buyers keep front-running higher lows into the apex.
4. Scenario Map: Paths Above and Below $3.00
Bullish continuation (probability improves on Fed follow-through)
• Trigger: Clean 4-hour close above $3.00, ideally accompanied by rising volume and positive breadth across large-cap alts.
• Upside targets:
o $3.15–$3.20: First resistance band from prior supply and extension targets based on the local range height.
o $3.30: Key magnet if momentum persists; confluence with measured move from the $2.88–$2.99 box.
o Stretch target $3.45–$3.60: Requires continuation flow, favorable macro tone, and sector risk-on. A path to $3.60 likely needs cumulative breadth improvement and rotation from BTC or ETH dominance.
• Market structure tells:
o Flip of $3.00 to support on retests.
o Shallow pullbacks that hold the 20- and 50-period MAs on 1-hour/4-hour frames.
o Momentum divergence avoidance on RSI and MACD.
Neutral consolidation (base-building under resistance)
• Behavior: Price oscillates between $2.88 and $3.00, with volatility compressing. This can be constructive if it resolves higher. Watch for absorption at $2.92–$2.95: sustained bid depth indicates smart-money accumulation.
• Risks: Choppy stop-runs against both sides. Patience and disciplined entries near range extremes become important.
Bearish fade (news or liquidity shock)
• Triggers: Disappointing Fed guidance, risk-off in equities, or an adverse regulatory headline.
• Downside levels:
o $2.88: First defense. A clean break opens $2.86–$2.85 (trend-line and 100-hourly SMA cluster).
o $2.82–$2.80: Next liquidity shelf; loss of this area would weaken the intermediate uptrend.
o $2.72–$2.75: High-volume node from prior consolidation, potential swing-long reload zone if broader trend remains constructive.
5. Order Flow and Liquidity: What to Watch Around $3.00
• Liquidity pockets: Expect resting offers at $2.99–$3.02 and stop clusters just beyond. A burst through $3.02–$3.05 often reflects stop-fuel rather than sustained demand. The follow-through test is whether bid support appears on the first retest.
• VWAP and session profiles: Monitor intraday VWAP alignment. If price holds above session VWAP after the breakout, it signals strong participation; repeated reversion below VWAP suggests weaker conviction.
• Funding and perp basis: Elevated long funding rates without spot confirmation can forewarn of squeezes. A healthy breakout typically shows rising spot volumes and moderate-perp leverage.
6. Cross-Asset Check: Is Crypto-Wide Breadth Confirming?
• BTC and ETH: If Bitcoin holds or advances alongside XRP, breakouts tend to stick better. Conversely, a BTC pullback from resistance or ETH weakness can sap liquidity from alts and render XRP breakouts vulnerable.
• Dollar and yields: A softer DXY and benign real-yield backdrop would reinforce crypto appetite. Watch the 10-year real yield. A re-acceleration higher could cap upside in risk assets.
• Equities and credit: Positive equity momentum and stable credit spreads are supportive. Risk-off rotations often tighten crypto ranges or trigger downside wicks.
7. Narrative Catalysts: From RLUSD Payments to Real-Estate Tokenization
• RLUSD payments angle: Reports of an electric car maker tapping RLUSD for payments has refocused attention on enterprise-grade settlement rails and Ripple-adjacent stablecoin strategies. If RLUSD or similar fiat-linked tokens embed more deeply into commercial workflows, network effects could lift transactional relevance for XRP and related liquidity pools. Watch for on-chain settlement volumes and treasury adoption headlines.
• Real estate tokenization: The idea that real estate could unlock the next parabolic leg for XRP hinges on two levers: (a) tokenized asset issuance/settlement requiring high-throughput, low-cost rails; (b) institutional-grade custody and compliance frameworks. If pilot programs scale—fractionalized property claims, escrow automation, and cross-border closings—liquidity migration to chains and bridges that interoperate with Ripple ecosystem tools could grow. Concrete KPIs to track include tokenized asset market cap growth, settlement finality times, and custodial integrations with major brokers.
• Payments and remittances: Continued traction in corridors—especially where FX frictions are high—can underpin a fundamental bid for liquidity tokens. Macro volatility tends to increase remittance volumes, indirectly supportive for settlement networks if fees and speed remain competitive.
8. Regulatory Overhang: Did the Ripple Case “Save Crypto” or Just Buy Time?
• Expert discourse: Some analysts argue that the Ripple lawsuit, by forcing clarity on the application of securities laws to token distributions and secondary market activity, reduced systemic legal uncertainty at a critical juncture. The view is that the case delineated boundaries that prevented broader enforcement spillover into secondary liquidity for many assets.
• Counterpoint: Others caution that the landscape remains fragmented. Jurisdictional differences and evolving interpretations keep headline risk alive. Markets may have priced in a partial détente, but precedent is not monolithic, and appeals or parallel actions can re-introduce volatility.
• Trading implication: Regulatory catalysts tend to be binary and gap-inducing. Position sizing around major court dates and policy announcements should reflect that asymmetry.
9. Strategy Playbook: Traders’ Checklist Into and After the Fed
For breakout traders
• Entry logic: Wait for a 4-hour close above $3.00, then look for a retest of $2.97–$2.99 holding as support. Confirmation improves if the retest coincides with an intraday VWAP reclaim and rising spot volume.
• Risk: Place invalidation below the retest low or below $2.93 (trend-line confluence), depending on risk tolerance. Avoid chasing if funding spikes and spot-volume confirmation is lacking.
• Targets: Scale at $3.15–$3.20; trail remainder toward $3.30. Only pursue $3.45–$3.60 if momentum and breadth broaden.
For range traders
• Buy-response zones: $2.86–$2.88 with tight stops if trend line and 100-hour SMA remain supportive.
• Sell-response zones: $2.99–$3.00 if order flow shows absorption and lack of follow-through; cover quickly on decisive breaks.
• Tools: Footprint charts, delta, and cumulative volume profiles to gauge absorption vs. initiative buying.
For swing traders
• Thesis: As long as daily closes hold above $2.82–$2.85, the medium-term bias remains constructive. A weekly close above $3.00 turns the path of least resistance up toward $3.30–$3.60 over coming weeks, contingent on macro tone.
• Invalidations: A daily close below $2.80 suggests a breakdown from the base, opening risk to $2.72–$2.75.
10. Risk Management: Practical Guardrails
• Volatility budgeting: Size positions based on realized volatility. Consider scaling rather than all-in entries around binary macro events.
• Correlation traps: Avoid over-concentration in alts that move in lockstep. If you’re long XRP into the Fed, offset with cash or lower-beta exposures.
• Leverage discipline: Elevated funding and crowded longs can unwind fast. Keep leverage modest and stops hard, especially near psychological levels like $3.00.
• News reaction function: Predefine responses to three scenarios—dovish surprise, baseline cut with cautious guidance, or hawkish tilt. Adjust exposure automatically rather than emotionally.
11. What the Tape Is Saying Now
• Price behavior: XRP has surged through $2.88, probed $2.92, and repeatedly tested $2.99–$3.00. Each dip toward $2.86–$2.90 has found buyers, aligning with the 100-hourly SMA and ascending trend line near $2.93.
• Participation: The best breakouts in XRP historically come on broad-based alt strength and rising spot participation. Watch whether volumes cluster on green candles during NY hours; institutional involvement often intensifies then.
• Sentiment skew: Elevated expectations around the Fed cut can create asymmetry—good news may be “priced in,” while any disappointment can trigger fast downside to first supports.
12. Price Levels Summary
• Immediate resistance: $3.00, then $3.02–$3.05. A strong break above targets $3.15–$3.20 and $3.30.
• Immediate support: $2.93 trend-line, then $2.90, with a stronger shelf at $2.86–$2.88. Below that, $2.82–$2.85 and $2.72–$2.75.
• Momentum markers: RSI holding above midline on pullbacks; MACD on 1-hour/4-hour staying positive; rising OBV on rallies.
13. Frequently Asked Questions
Q: Why does $3.00 matter so much?
A: It’s a psychological round number clustered with offers, stop orders, and optionality hedging. Breaking and holding above it often forces systematic strategies to rebalance, creating momentum.
Q: How reliable is the Fed cut catalyst for crypto?
A: Cuts tend to support risk assets if they signal easier financial conditions ahead. However, when odds are near 100%, the market demands supportive guidance to avoid a fade. It’s the path of policy, not the single step, that matters.
Q: Could XRP reach $3.60 on this leg?
A: It’s possible if $3.00 flips to support, $3.15–$3.30 clears with volume, and macro remains benign. Realistically, $3.15–$3.30 is the first major test; $3.45–$3.60 would likely need follow-through and broader alt strength.
Q: How do institutional flows “dictate” the range?
A: Large players anchor liquidity at key levels, providing both buy-side and sell-side depth. They often fade extremes unless a meaningful catalyst forces them to move, resulting in repeated tests and rejections around known levels.
Q: Is the descending triangle bearish?
A: By textbook definition, yes. But crypto often violates textbook patterns when macro liquidity turns supportive. The resolution depends on who runs out of patience first—sellers defending the ceiling or buyers stepping up on higher lows.
14. Bottom Line
• The setup: XRP is coiled just beneath $3.00 after a 4–5% push, with $2.88–$2.93 acting as a dependable springboard. The hourly trend remains constructive above the 100-hour SMA, and RSI supports further upside if pullbacks stay shallow.
• The catalyst: A near-certain Fed cut anchors the macro bid, but with odds already near 99%, sustained upside likely requires reassuring forward guidance or a concurrent broad-based crypto risk-on.
• The trigger: A decisive close and hold above $3.00 is the primary unlock. If achieved, $3.15–$3.20 and then $3.30 come into view, with $3.45–$3.60 reserved for stronger momentum phases.
• The risk: Failure to clear $3.00 followed by a loss of $2.86–$2.88 would hand control back to sellers and invite a deeper test toward $2.80–$2.75.
As XRP consolidates under $3.00 and the descending triangle narrows, the next directional move will likely hinge on whether institutional sellers maintain the lid or capitulate to momentum post-Fed. Traders should remain flexible, respect key levels, and let the tape confirm the path.

1day xrp bullish pennantHard to tell which of these trendlines is the most valid top trendline and bottom trendline of this triangle/pennant so I have to include them all since any can potentially be. *not financial advice*

XRPUSD - Monthly Not Done Yet XRPUSD is looking for more with this nice almost like flag structure signaling a further breakout on the Monthly
This can be seen on the RSI in the green circles. Two peaks are created as price moves up. This pattern is repeating itself.
Very bullish, probably even leading alts into altszn

XRP — September 01, 2025.CRYPTOCAP:XRP #XRP #RIPPLE
The mighty XRP (once worshipped as the next big thing in crypto) shows, based on trader liquidation maps, that we've hit max pain for long traders.
From the current price, you could consider a spot position with a potential for a +20%-24% move.
Entry price: $2.6906 - $2.7519
Take Profit: $3.3500 (+20-24%)
➖➖➖
Short Max Pain = $3.3500
Long Max Pain = $2.6906

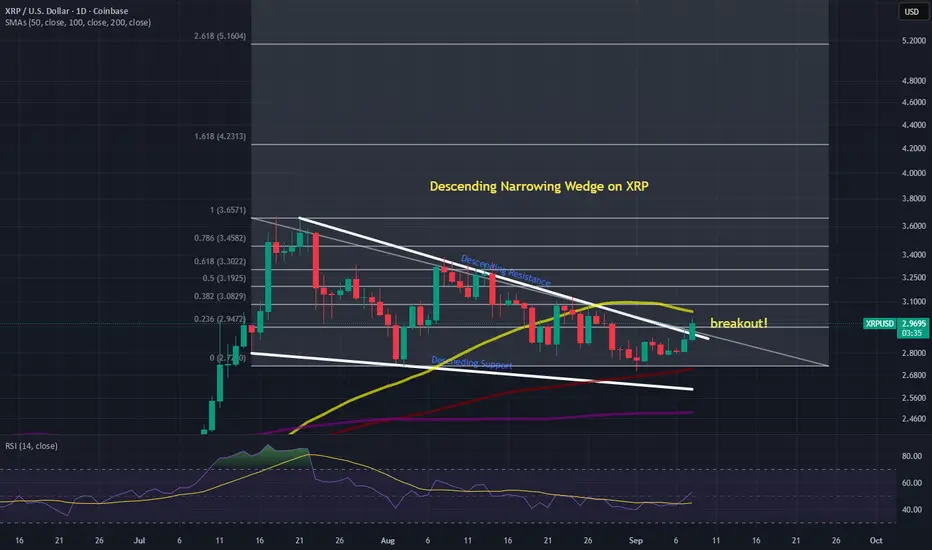
XRP Descending Narrowing Wedge Daily ChartXRP is currently breaking out of a descending narrowing wedge on the daily timeframe. XRP may meet some resistance at the 50 simple moving average as it approaches this level. I expect the price to fly after breaking this moving average. Seat belts everyone!
Not financial advice. Do your own DD.
Thanks for viewing the idea.
XRP: Lacks Momentum Despite Modest GainsRipple’s XRP is trading slightly higher today compared to last Monday, but it still hasn’t found real momentum. For now, it’s expected to continue moving upward toward resistance at $4.09 as part of turquoise wave B, before the correction of wave (2) is finally completed. The following magenta wave (3) should then drive gains above the $4.09 resistance level. If the altcoin manages to break directly above this level, this will suggest that wave alt.(2) has already wrapped up.

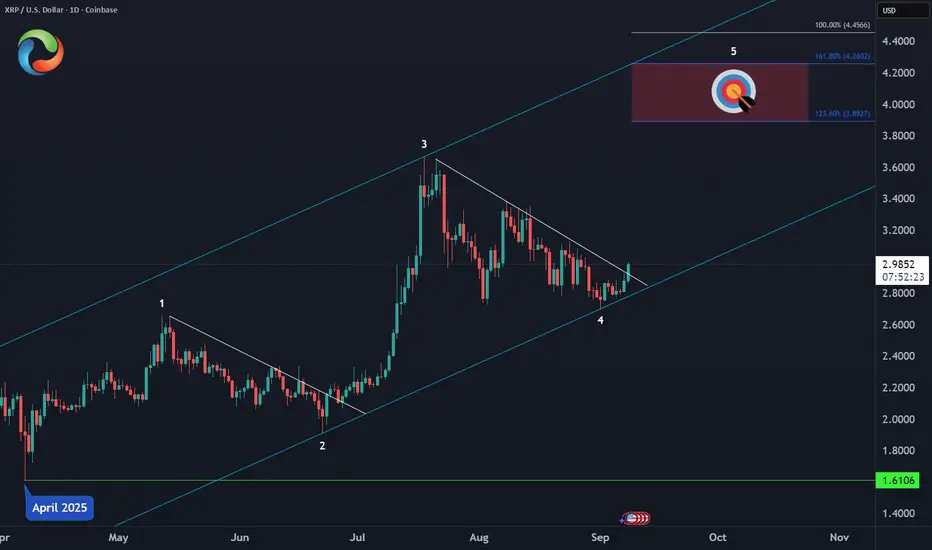
XRP – Next Upside Target🎯 CRYPTO:XRPUSD is poised to resume its impulsive cycle from the April 2025 low, with the minimum extension for wave 5 targeting the $3.89–$4.26 zone.
Structure remains constructive as long as price holds above the recent low, with potential for continuation in the coming sessions.