SUI M30 FVG Rejection and Continuation Setup📝 Description
On the M30 timeframe, CRYPTOCAP:SUI is pressing into a clear H1 supply / Order Block while still trading under a descending structure. The current pause under the zone looks like a controlled reaction rather than acceptance, keeping the probability of a downside continuation toward lower inefficiencies active.
________________________________________
📈 Signal / Analysis
Primary Bias: Bearish while below the 1.82 area
Preferred Setup:
• Entry: 1.8 (30m FVG rejection)
• Stop Loss: Above 1.815
• TP1: 1.784
• TP2: 1.764
• TP3: 1.745
________________________________________
🎯 ICT & SMC Notes
• Reaction inside an unmitigated H1 Order Block / supply
• Downside targets align with M30 inefficiency (FVG) and liquidity draws
• No bullish CHOCH/BOS confirmed to justify a reversal narrative
________________________________________
🧩 Summary
CRYPTOCAP:SUI is reacting at a higher-timeframe supply zone, and as long as price stays capped below the H1 OB, the move is treated as a pullback. Rejection from this area keeps TP1–TP3 in play, with 1.745 as the deeper draw.
________________________________________
🌍 Fundamental Notes / Sentiment
Stronger USD supports tighter financial conditions, reducing risk appetite. In this environment, risk assets like crypto remain vulnerable, keeping SUI biased to the downside.
________________________________________
⚠️ Risk Disclosure
Trading involves substantial risk and may result in capital loss. This analysis is for educational purposes only and does not constitute financial advice. Always apply proper risk management, predefined stop-loss levels, and disciplined position sizing aligned with your trading plan.
Riskoff

USOIL Sell Opportunity | Downtrend + Rising Venezuela Supply!Hey Traders,
In tomorrow’s trading session, we are closely monitoring USOIL for a potential selling opportunity around the 57.50 zone. USOIL remains in a well-defined downtrend and is currently in a corrective pullback, approaching a key trendline confluence and the 57.50 support-turned-resistance area, which could act as a strong rejection zone.
From a fundamental perspective, expectations that Trump’s takeover of Venezuela’s oil supply could increase global oil production may lead to higher supply in the market. According to basic supply and demand dynamics, an increase in supply—if not matched by demand—can put downward pressure on oil prices, reinforcing the bearish technical outlook.
As always, wait for confirmation and manage risk carefully.
Trade safe,
Joe.

Investment Grade VS High Yield AMEX:LQD is meeting the demand zone here. Looks like risk appetite will start to cool down from here. Flight to safety is starting to show signs.
With all the private credit out there I don´t think AI is the go to at this point in time. Gold is likely to be benefiting from this aswell as creditworthy companies.
High beta stocks is at a danger zone from my perspective.
BOJ´s rate hike could be the trigger on friday.
As always. This is not a financial advise. Always do your own research and investment decisions.

Head & Shoulders - IBOXX & Investment Grade Corporate Bond ETFWhen things like investment grade bonds looks top (ish). That´s when you know it´s time to really start thinking about exiting. To me this is another sign of a bubble.
Investment grade is supposed to be the most safest bets after treasuries.
The BOJ will decided the markets faith on friday. Most likely the spreads of the US & Japan 2 year yields will come closer to equilibrium and that could very well trigger the carry trade.
Im on high alert this time around. Im scaling down on risk and will watch what happens on friday.

BTC Risk-Off Drop: 84.6k Floor or 80.6k Test?
__________________________________________________________________________________
Market Overview
__________________________________________________________________________________
Bitcoin just absorbed a high-energy risk-off flush from the 90–92k supply shelf and is sliding toward a dense 84.6k demand cluster. Momentum remains down on HTFs; bounces are corrective unless key resistances are reclaimed.
Momentum: Bearish bias with a corrective bounce attempt; structure prints lower highs across HTFs and rejects 90–92k.
Key levels:
- Resistances (HTF): 88,500–89,000 (breakdown block) / 90,248–91,969 (4H supply) / 95,358 (1D Kijun).
- Supports (HTF): 86,000–86,200 (minor shelf) / 84,568–84,629 (ISPD cluster) / 80,619 (D Pivot Low).
Volumes: Very high on the daily selloff; moderate-to-normal on intraday rebounds.
Multi-timeframe signals: 1D/12H/6H/4H/2H/1H trends are Down; only notable exception is a 1D ISPD “BUY” context at 84.6k that requires a clear reversal signal to act.
Harvest zones: 84,600 (Cluster A) / 79,100–79,600 (Cluster B). These are the preferred dip-buying locations for inverse pyramiding when a ≥2H reversal prints.
Risk On / Risk Off Indicator context: NEUTRE VENTE — confirms the downside momentum and argues for fading rallies unless 88–88.5k is reclaimed with strength.
__________________________________________________________________________________
Trading Playbook
__________________________________________________________________________________
With HTFs pointing Down, the stance is defensive: fade rallies into supply and only buy the 84.6k floor on confirmed reversal.
Global bias: NEUTRAL SELL while below 90,248–91,969; invalidation for shorts on sustained daily close above 92,000.
Opportunities:
- Tactical buy: 84,568–84,629 test only on ≥2H bullish reversal; scale out into 86,200 then 87,600–88,000.
- Breakout buy: Reclaim and hold above 88,000–88,500 with follow-through into 90.2–92.0k; manage risk tightly.
- Tactical sell: Fade rejections at 87,600–88,000 or 90,248–91,969; targets 86,200 → 84,600 → 80,600 if momentum persists.
Risk zones / invalidations: A sustained close below 84,200 likely opens 80,619 then 79,100–79,600; a sustained daily close above 92,000 negates the near-term bearish read.
Macro catalysts (Twitter, Perplexity, news): BOJ tightening risk and yen volatility keep risk premia elevated; FOMC/dot plot can flip tone — wait for post-event persistence; ETF 7d flows negative despite a small daily inflow, limiting macro support.
Harvest Plan (Inverse Pyramid):
- Palier 1 (12.5%): 84,600 (Cluster A) + reversal ≥2H → entry
- Palier 2 (+12.5%): 81,200–79,500 (-4/-6% below Palier 1; Cluster B included) → reinforcement
- TP: 50% at +12–18% from PMP → recycle cash
- Runner: hold if break & hold first R HTF 90,248–91,969
- Invalidation: < 80,600 HTF Pivot Low or 96h no momentum
- Hedge (1x): Short first R HTF on rejection + bearish trend → neutralize below R
__________________________________________________________________________________
Multi-Timeframe Insights
__________________________________________________________________________________
Across the stack, structure is bearish with a corrective rebound; the 84.6k floor is the key battleground.
1D/12H group: Rejected 90–92k; drifting toward 84.6k. A clean ≥12H reversal at 84.6k could fuel a tradable bounce; failure exposes 80,619 then 79.1–79.6k.
6H/4H/2H group: Lower-high sequence intact; best sells at 88.5–89.0k and 90.2–92.0k. Breakdown retests under 86.0k stay valid with momentum.
1H/30m/15m group: Bounce is corrective into supply; very high volume printed on the leg down. Intraday long only on confirmed reversal at 84.6k; otherwise fade into resistance.
Major confluence: 84.6k is a tight 1D+30m floor cluster; 90.2–92.0k is dominant HTF supply. This confluence frames the range to harvest.
__________________________________________________________________________________
Macro & On-Chain Drivers
__________________________________________________________________________________
Risk-off impulses were amplified by yen-carry tremors and soft Asia data, while crypto flows remain mixed.
Macro events: BOJ tightening risk (2Y JGB near 1%) and USD/JPY volatility spilled into risk assets; FOMC/dot plot ahead can reset the volatility regime; energy/geopolitical tension adds a risk premium.
External Macro Analysis integration: The Dashboard flags the Risk On / Risk Off Indicator as BEAR with stress in credit (HYG) and high beta (ARKK) — this confirms the technical NEUTRAL SELL bias.
Bitcoin analysis: ~$4k air-pocket drop, ~$300M long liquidations; traders eye 82–80k on further stress versus an 88k reclaim to neutralize near-term risk; ETF 7d flows remain negative.
On-chain data: Liquidity thin; options skew defensive with heavy puts near 84k and elevated IV into December — rallies prone to fade without spot absorption.
Expected impact: Macro/on-chain backdrop supports a cautious, sell-rallies stance unless 88–88.5k is reclaimed and funding/spot absorption improves.
__________________________________________________________________________________
Key Takeaways
__________________________________________________________________________________
BTC is in a risk-off downswing, probing toward a high-quality 84.6k floor while HTFs remain bearish.
The trend is bearish-to-neutral below 90.2–92.0k; the most relevant setup is buying a confirmed 84.6k reversal or fading rejections at 88.5–89.0k and 90.2–92.0k. Macro risk from BOJ/FOMC and weak ETF flows argues for patience and tight risk. Stay methodical — harvest volatility, don’t chase.

Fear & Greed Index — Rebuilt as a Macro Oscillator for CryptoThe Fear & Greed Index is everywhere — a popular way to gauge market sentiment.
But it's usually just a mix of volatility, momentum, and social buzz...
📉 Not exactly macro.
This script is a technical reinterpretation of the Fear & Greed concept — but grounded in real, measurable economic behavior .
🧠 The Core Idea
This indicator is powered by the Copper/Gold ratio , a time-tested signal used by economists and institutional traders to track macroeconomic cycles:
- 🟢 When Copper outperforms → the economy is likely expanding → risk-on → Greed
- 🔴 When Gold outperforms → the economy may be contracting → risk-off → Fear
Copper represents industrial growth , while Gold signals defensive capital flows .
We track this ratio over time using a Z-Score oscillator to identify when sentiment is statistically stretched in either direction — highlighting moments of macro-level greed or fear.
📊 Why It Matters for Crypto
Crypto doesn’t live in a vacuum.
It's highly sensitive to the broader risk environment.
This oscillator gives you a macro lens to help:
- Anticipate bullish or bearish shifts in crypto markets
- Avoid common emotional traps at sentiment extremes
- Build entries or exits around macro confluence zones
It doesn’t tell you when to buy or sell — it tells you when the market context is shifting .
🔧 How to Use It
- Watch for the Z-Score entering > +2 (Greed) or < -2 (Fear)
- Use it to confirm broader risk-on/off behavior
- Combine with BTC or ETH price for potential lead/lag relationships
- Customize the tickers to test other macro pairs (e.g. SPX/VIX, BTC/DXY)
📈 Built with Pine Script v6
🔍 Default Tickers: CAPITALCOM:COPPER vs TVC:GOLD
📦 Fully customizable inputs, clean visual design, alert-ready
💡 Use this to trade with context — not emotion.
If you found this useful, give it a like and drop your feedback or improvements below 👇

BTC: Range below 114k — breakout soon or fresh rejection?__________________________________________________________________________________
Market Overview
__________________________________________________________________________________
BTC is range-bound below 112,600–114,000, with improving intraday momentum but a firm HTF supply shelf overhead. The broader backdrop stays constructive while supports hold, pending a liquidity catalyst.
Momentum: Range with a bullish skew 📈 if 112,600 breaks and holds.
Key levels:
- Resistances (12H–1D): 112,600–114,000, then 116,000.
- Supports (2H–1D): 111,000–110,300, then 108,600.
Volumes: Normal to moderate (1H–4H), acting as an amplifier on rejections/breakouts.
Multi-timeframe signals: 1D Up, while 12H/6H/4H remain Down; intraday (2H/1H/30m/15m) Up but capped under 112,600–114,000.
Risk On / Risk Off Indicator: Mixed read (NEUTRAL SELL vs NEUTRAL BUY) → overall neutral stance, waiting for flow confirmation; this aligns with a range rather than a trend.
__________________________________________________________________________________
Trading Playbook
__________________________________________________________________________________
Strategically, the dominant trend is neutral below 112,600–114,000; stay opportunistic: buy a clean breakout or tactically sell a clear rejection.
Global bias: Neutral with buy-on-breakout skew above 112,600; key invalidation if 1D closes below 108,600.
Opportunities:
- Breakout long: Close + retest above 112,600 targeting 114,000 then 116,000.
- Buy the dip: 111,000–110,300 (or 108,600) on a bullish 2H–1D rejection.
- Tactical short: Rejection at 112,600–114,000 aiming 111,000 then 110,300.
Risk zones / invalidations:
- Below 108,600 on a 1D close: HTF structure weakens → risk of acceleration toward 106,800.
- Above 114,000 on 4H/1D: invalidates range shorts and opens 116,000.
Macro catalysts (Twitter, Perplexity, news):
- FOMC and liquidity tone (potential QT end) as key driver.
- US equities at ATHs: supportive risk backdrop while it lasts.
- BTC spot ETF flows mixed: uneven tailwind, needs confirmation.
Action plan:
- Entry: 112,650–112,900 (clean break/retest on 1H–4H).
- Stop: below 111,900 (breakout play) or below 110,300 (dip play).
- TP1: 114,000; TP2: 116,000; TP3: 118,500 (if extension).
- Approx R/R: 1.8R to 2.5R depending on stop and scaling.
__________________________________________________________________________________
Multi-Timeframe Insights
__________________________________________________________________________________
Overall, HTFs stay rangey under a stacked resistance shelf, while LTFs press into the 112,600 pivot.
1D: Uptrend but capped beneath 112,600–114,000; a clean reclaim/hold would unlock 116,000.
12H/6H/4H: Down/corrective; countertrend bounces likely capped at 112,600–114,000 absent confirmed closes.
2H/1H/30m/15m: Rising structure with higher lows; continuation on break & hold of 112,600, otherwise rotation risk toward 111,000–110,300.
Major divergences: Mixed 1D Up vs 12H Down; raises the bar for confirmation (retest + volume) on any breakout.
__________________________________________________________________________________
Macro & On-Chain Drivers
__________________________________________________________________________________
Macro/on-chain is mixed: potential risk-on via liquidity, but demand signals remain cautious below resistance.
Macro events: Fed QT reportedly nearing an end (near-term), risk supportive; US indices at ATHs; FOMC next → primary liquidity tone driver.
Bitcoin analysis: Pinned between the 200D (~108.5k) and STH cost basis (~113.1k); a daily close above ~113.1–116.0k unlocks higher; loss of ~108.5k risks 100–101k.
On-chain data: Below STH cost basis, demand fatigue; elevated LTH distribution; cautious options → need flow impulse to validate a breakout.
Expected impact: Constructive technical bias contingent on a confirmed break; without liquidity impulse, the range can persist.
__________________________________________________________________________________
Key Takeaways
__________________________________________________________________________________
Range beneath 112,600–114,000 with improving intraday but HTF supply still in control.
- Trend: Neutral, bullish if a clean break above 112,600; key supports at 111,000–110,300 and 108,600.
- Setup: Break & retest > 112,600 toward 114,000/116,000; alternative is disciplined dip-buys on bullish wicks at 110,300–108,600.
- Macro: FOMC + liquidity tone (potential QT end) is the main trigger.
Stay patient: wait for confirmation (close + retest + volume) and let flows lead risk. ⚠️
Bitcoin Market Analysis – October 20, 2025⚡️Welcome back to today’s Bitcoin analysis.
The trigger we discussed in the previous update has been activated, and the V-pattern we’ve been talking about throughout the week has finally formed, confirming the expected reversal structure.
🚀As mentioned earlier, the overall trend remains bullish, and once we see a clear stabilization above the 111,000 and 113,000 zones, it will serve as confirmation of our bullish continuation scenario.
📈The 111,000 zone could also provide another entry opportunity for those who missed the long setup around 107,000 — as long as the structure holds and buyers continue to defend this level.
🌕At this stage, it’s important to wait for fundamental confirmation.
If the broader market sentiment turns risk-on, Bitcoin could easily push toward new upside targets in the coming sessions.
---
> Disclaimer:
This content is for informational purposes only and does not constitute financial or investment advice. © DIBAPRISM
Larry D.Kohn

US–China Tensions Put Pressure on AUDJPY Near 98.600!!Hey Traders,
In today’s session, we’re closely watching AUDJPY as price approaches the 98.600 zone, aligning with a key resistance level within the broader downtrend. After a short-term corrective move higher, the pair now faces an area that has historically acted as a turning point for sellers.
From a fundamental perspective, global sentiment appears to be tilting toward risk aversion once again.
Ongoing US–China tensions have reignited geopolitical uncertainty, with markets increasingly pricing in the possibility of further escalation. In such an environment, high-beta currencies like the AUD tend to underperform, while safe-haven flows favor the JPY.
If risk sentiment deteriorates further, AUDJPY could see renewed downside momentum from this resistance region.
Key zone: 98.600 — confluence of structure resistance and trend alignment.
Bias: Bearish while below this level.
Trade safe,
Joe.

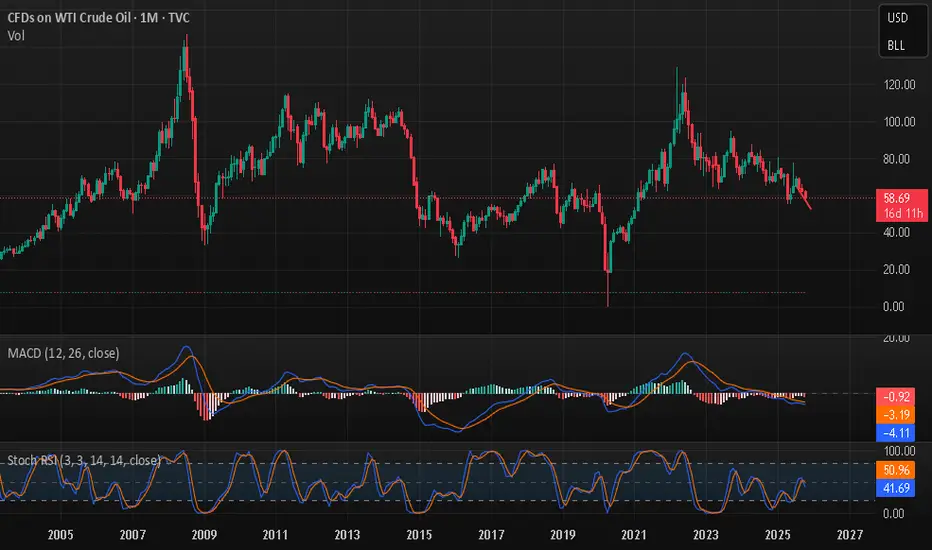
Why Oil’s Drop Fuels a Global Risk-Off SentimentWTI Crude Oil Monthly Technical Outlook: Below $60 and the Broader Market Implications
As the fourth quarter of 2025 unfolds, the WTI Crude Oil (USOIL) chart offers a critical perspective on the state of global supply-demand balance and its broader impact on market sentiment. Trading near $58.5 per barrel, oil prices have fallen below a key psychological threshold, and while the move may seem technical at first, its implications reach far beyond the energy market.
The combination of weakening momentum indicators, rising supply projections, and softening global demand paints a nuanced but important story: oil’s slide below $60 is no longer just a chart event, it’s a macro signal about global growth, supply dynamics, and investor positioning.
Technical Overview: Momentum Loss Deepens
The monthly chart for WTI shows a clear picture of fatigue after multiple failed rebound attempts over the past 18 months. Since peaking near $130 in early 2022, prices have formed a persistent pattern of lower highs and lower lows, reflecting an extended process of distribution.
In recent months, WTI has failed to sustain moves above $70, with sellers consistently stepping in on rallies. The October bar extended losses toward the $58 level, marking the weakest monthly close since mid-2023.
Structurally, this decline puts WTI in a critical support zone between $55 and $57, which coincides with the base that previously stabilized prices in late 2023. Should this zone fail, the next major support rests around $50 per barrel, aligning with a key Fibonacci retracement of the 2020–2022 rally.
On the upside, the resistance band remains in the $65–$68 range, a descending trendline that has capped every rebound since early 2024. A decisive monthly close above that zone would be the first confirmation of renewed strength, but momentum indicators are still leaning toward continued weakness or sideways consolidation.
MACD and Stochastic RSI: Weakening Momentum Signals
The MACD (12,26,9) indicator remains subdued below the zero line, underscoring a prolonged loss of upside momentum. The histogram has recently turned red again, indicating that the MACD line may cross below the signal line, a potential confirmation that sellers still control the trend.
Meanwhile, the Stochastic RSI, which measures RSI velocity, has rolled over from midrange levels and is pointing lower again. Its failure to sustain a rebound above 50 shows that bullish energy has faded.
If this oscillator drops below 30, it would confirm a continuation of weak-to-neutral price action through the rest of Q4. Historically, such conditions precede prolonged consolidation phases, where volatility contracts before a new trend forms.
Together, these indicators portray a market not in full capitulation, but clearly lacking conviction for an upside breakout.
Fundamental Picture: Oversupply Meets Slowing Demand
While technical signals reveal a loss of momentum, the fundamental backdrop provides stronger clues about why oil has struggled to maintain value above $60. Recent data from major energy agencies, including the International Energy Agency (IEA), the U.S. Energy Information Administration (EIA), and multiple Reuters reports, converge on one central theme:
the global oil market is entering a surplus phase, with supply growth outpacing demand.
Large Oversupply Projections
Read full analysis on my website
darrismanresearch com
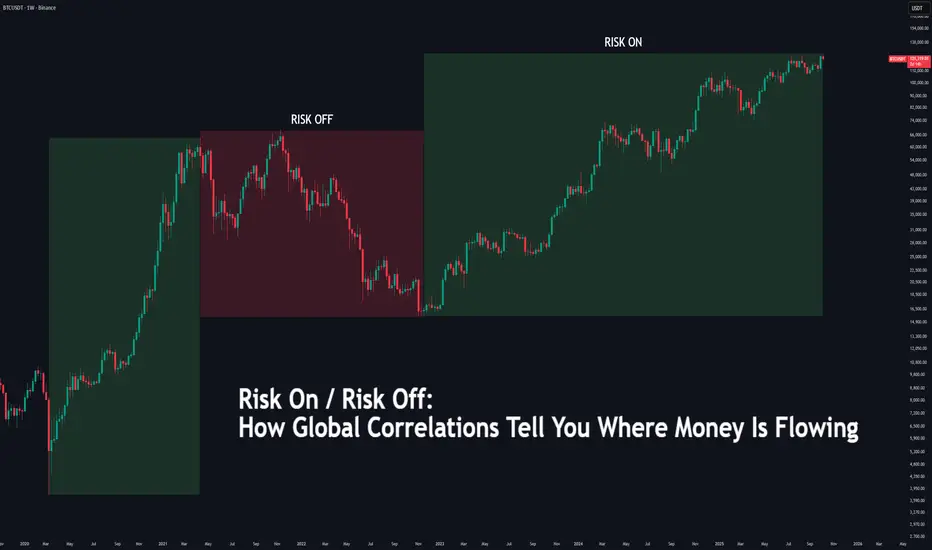
Risk On/Off: How Global Correlations Tell You Money Flow🔵 Risk On / Risk Off: How Global Correlations Tell You Where Money Is Flowing
Difficulty: 🐳🐳🐳🐋🐋 (Intermediate+)
This article is for traders who want to understand how global capital flow affects market behavior — from equities and crypto to gold and bonds. Learning to read “Risk On” and “Risk Off” regimes helps you anticipate big shifts before they hit your chart.
🔵 INTRODUCTION
Markets are not independent islands — they are connected by one universal force: liquidity flow .
When investors feel confident, they move capital into riskier assets like stocks and crypto — this is called Risk On .
When fear dominates, capital flows back into safety — bonds, gold, and the U.S. dollar — known as Risk Off .
Recognizing this rotation allows traders to align their bias with the flow of global capital rather than fighting it.
🔵 WHAT IS “RISK ON”
Risk On is a market environment where investors seek higher returns, volatility is subdued, and capital flows into assets with greater reward potential.
Typical Risk-On behavior:
S&P 500, Nasdaq, and other equities trend higher
Bitcoin and crypto assets outperform traditional markets
U.S. Dollar Index (DXY) weakens as money moves abroad
Bond yields rise moderately as investors leave safe assets
Gold often consolidates or declines
In simple terms: Money chases opportunity.
🔵 WHAT IS “RISK OFF”
Risk Off describes defensive conditions — fear rises, volatility expands, and liquidity seeks safety.
Typical Risk-Off behavior:
S&P 500 and risk assets decline
Bitcoin and altcoins drop sharply
DXY strengthens as investors move into USD
Bond yields fall as money enters treasuries
Gold rallies as a safe-haven hedge
In simple terms: Money runs to safety.
🔵 HOW TO DETECT RISK SHIFTS
Market regimes don’t flip instantly — they rotate through correlated behavior.
To identify the shift between Risk On and Risk Off, monitor key macro instruments together:
DXY (Dollar Index): Rising DXY = Risk Off sentiment, Falling DXY = Risk On.
SPX / NASDAQ: Strong uptrends = Risk On, persistent weakness = Risk Off.
BTC vs DXY: Inverse correlation; BTC strength with DXY weakness = liquidity expansion.
Bond Yields (US10Y): Rising = optimism, Falling = risk aversion.
VIX Index: Below 15 = complacent Risk On, Above 25 = fearful Risk Off.
🔵 THE GLOBAL LIQUIDITY CYCLE
Liquidity always moves in phases — expansion, acceleration, contraction, and reset.
Phase 1 – Liquidity Expansion: Central banks inject liquidity → Risk On begins.
Phase 2 – Overextension: Assets rally strongly, leverage increases, volatility stays low.
Phase 3 – Liquidity Contraction: Monetary tightening or policy shocks trigger Risk Off.
Phase 4 – Repricing & Reset: Markets bottom as new liquidity returns.
Understanding this rhythm helps traders avoid confusion when markets seem “irrational” — because they’re not, they’re simply rotating through the liquidity cycle.
🔵 USING RISK ON/OFF IN TRADING
Even technical traders benefit from recognizing global risk regimes.
By aligning with the dominant liquidity direction, setups gain higher probability.
Crypto traders: Use SPX, DXY, and VIX correlations to confirm momentum.
Stock traders: Track gold and yields to gauge investor confidence.
Forex traders: Trade USD pairs according to global sentiment.
Swing traders: Filter trade bias by checking the current global regime.
Tip: When correlations align (e.g., DXY up, SPX down, BTC down), expect trend continuation.
When they diverge, volatility or reversals are likely.
🔵 ADVANCED TOOLS TO WATCH
Global Liquidity Index: Track combined balance sheets of the Fed, ECB, BOJ, and PBC.
Stablecoin Supply (Crypto): Expanding supply = liquidity entering market.
Yield Curve (10Y–2Y spread): Falling = caution, Rising = recovery.
Funding Rates: Confirm risk sentiment via leverage buildup.
🔵 CONCLUSION
All markets are connected through liquidity.
Risk On and Risk Off regimes describe how that liquidity rotates between return and safety. By tracking global correlations — equities, bonds, gold, DXY, and crypto — traders gain a powerful macro filter to stay on the right side of momentum.
Liquidity creates direction. Correlation confirms conviction.
If you learn to read the global flow, your technical analysis will finally make sense in the bigger picture.
Do you track global correlations in your analysis? What’s your favorite Risk-On or Risk-Off indicator?
BTC to 42k 2025 possibly lower
### 🔎 **1. Sentiment & Behavioral Data**:
- **App Rank + Google Trends Overlay**:
Elevated app rank + Google Trends spikes historically mark **local tops or overheating**, often preceding significant cool-downs.
- Current period mirrors previous euphoric cycles.
- RSI (monthly) also elevated → supports reversion.
---
### 🧊 **2. Macro Liquidity Conditions**:
- **BTC vs Global Liquidity Index**:
- Historically tightly correlated.
- Current divergence: **BTC is at ATH territory**, while **Global Liquidity Index is still suppressed**.
- Suggests **unsustainable move**, and vulnerability if liquidity tightens.
---
### 🏦 **3. ETF Flow Structure**:
- **Monthly Flows:**
- Net positive ($780M), **but cooling**.
- Feb had negative net flows (~ SEED_TVCODER77_ETHBTCDATA:4B out), March stabilizing but still tepid inflows.
- Sign of **diminishing marginal demand** from institutional flows → could fail to support current prices if retail demand slows.
---
### 🔥 **4. Liquidation Heatmap (Hyperliquid)**:
- **Heavy liquidation clusters**:
- Between **$86K - $90K** → currently being tested.
- **Liquidity vacuum below ~$80K** with significant liquidation levels → ideal for a **"liquidity hunt" wick** if downside opens up.
- Reinforces potential **swift downside mechanics** via cascading leverage.
---
### 📈 **5. Technical Structure & Smart Money Concepts**:
#### BTCUSD (Weekly View):
- Price hitting **regression model’s upper red band** (mean reversion zone).
- Momentum indicators (MACD, ST Oscillator, Squeeze) all **bearish divergent**.
- Fair Value Gaps (FVGs) below ($66K– GETTEX:52K ) + large Weekly OBs → **magnet zones**.
#### BTCUSDT.P (Perpetual Futures):
- RSI and volume profile show clear **bearish divergence**.
- Weekly CHoCH (Change of Character) + potential **lower high forming**.
- Price sitting in **high liquidity zone** with **weak support below**.
#### BRN/BTC Ratio:
- Shows **macro risk-off positioning** still in play (low oil/energy relative to BTC).
- Risk that this reverses → capital rotation *out of crypto* and into commodities.
---
### ⚠️ **Conclusion: Near-Term Bearish Bias**
Your thesis is still anchored in the **broader structural bull market**, but the current **micro-structure is highly vulnerable** to a **mid-cycle correction**, driven by:
- Overheated retail metrics.
- Bearish divergence across momentum tools.
- Depleting ETF inflows.
- Liquidity + liquidation setups ideal for **fast downside moves**.
- Macro conditions (liquidity and cross-asset risk ratios) not supportive of continued vertical price expansion **without correction**.

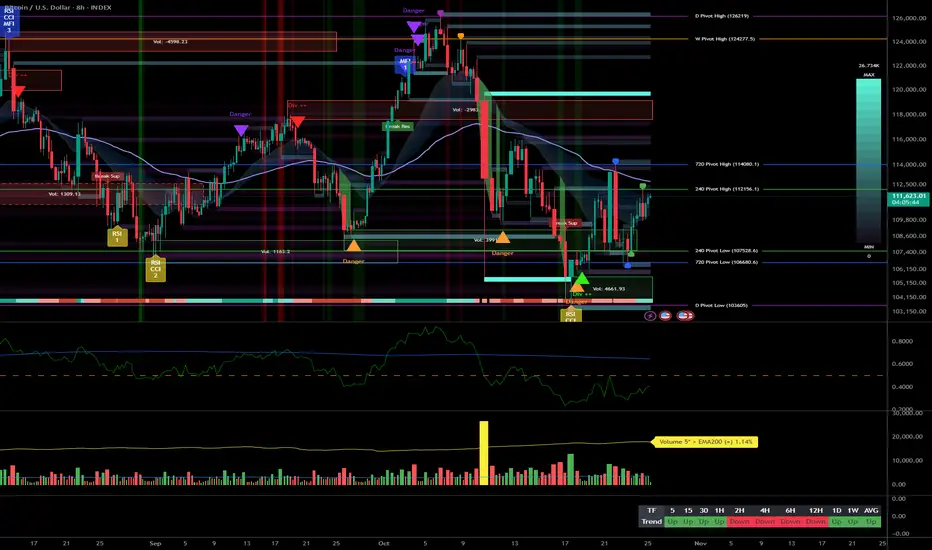
Bitcoin tight range below 113.24–114k, FOMC in focus__________________________________________________________________________________
Market Overview
__________________________________________________________________________________
BTC is ranging tightly: repeated rejections below 113,24–114,0k while 111,956 support still holds. Momentum is split with 1D/12H constructive and 4H–6H still leaning lower.
Momentum: range ⚖️ — bounces above 111,956 but a firm 113,24–114,0k cap stalls extensions.
Key levels:
• Resistances (D/12H/4H): 113.24–114.0k · 114.8k (extension) · 121–124k (HTF).
• Supports (D/12H/4H): 112.2/111,956 · 110,086 · 107,026.
Volumes: broadly normal to moderate; very high spikes on LTF during rejections around 113.2–113.3k.
Multi-timeframe signals: 1D/12H held (constructive), 4H–6H down (pressure at the cap), 1H/LTF counter‑trend pops.
Risk On / Risk Off Indicator: NEUTRAL SELL 🟠 — slight sell bias that aligns with the ceiling at 113.24–114.0k.
__________________________________________________________________________________
Trading Playbook
__________________________________________________________________________________
Strategic stance: as long as 113.24–114.0k caps price, favor defensive range-trading; switch to pro‑breakout only on confirmed acceptance.
Global bias: overall = NEUTRAL SELL (mild) while below 113.24–114.0k; invalidated on 12H close above 113,241 with volume.
Opportunities:
• Defensive buy at 112.2–111,956/110,086 → aim 113.2–114.0k; stop < 110,086.
• Rejection short at 113.24–114.0k → aim 112.2 then 111,956; stop > 114.3k.
• Bullish breakout on 4H/12H close > 113,241 + successful retest → aim 114.8k then 121–124k; stop below 113.1 (failed retest).
Risk zones / invalidations:
• Break below 110,086 ⚠️ re‑opens 107,026 and invalidates range longs.
• “Fake breaks” above 113,241 without volume expansion → trap risk.
Macro catalysts (Twitter, Perplexity, news):
• FOMC in focus (high odds of a rate cut) → potential volatility around pivots.
• Firm USD → headwind for risk assets, capping BTC near resistance.
• Asian risk tone constructive (Nikkei record) + adoption (BBVA custody, KuCoin Pay) → medium‑term structural support.
Action plan:
• Defensive Long: Entry 112.2–111,956 | Stop < 110,086 | TP1 113.2 | TP2 114.0k | TP3 114.8k | R/R ~1.5–2.0R.
• Rejection Short: Entry 113.24–114.0k | Stop > 114.3k | TP1 112.2 | TP2 111,956 | TP3 110,086 | R/R ~1.3–1.8R.
• Breakout Long: Entry on 4H/12H close > 113,241 + retest | Stop < 113.1 | TP1 114.8k | TP2 116.0k | TP3 121–124k | R/R ~1.8–3.0R.
__________________________________________________________________________________
Multi-Timeframe Insights
__________________________________________________________________________________
Higher timeframes hold structure, mid timeframes weigh on momentum, and LTFs rotate quickly near range edges.
1D/12H: constructive above 111,956, yet 113.24–114.0k is still the lid; acceptance > 113,241 would unlock 114.8k then 121–124k.
6H/4H: bearish tilt with frequent rejections below 113.2–114.0k; “normal” volumes → prefer selling range highs until 114.0k is absorbed.
2H/1H: tactical “buy the dip” while 111,956 holds, but no trend confirmation without a close > 113,241.
30m/15m: very high volume on rejections at the cap → “fake break” risk; scalping window between 112.0–113.3k.
__________________________________________________________________________________
Macro & On-Chain Drivers
__________________________________________________________________________________
Macro is mixed (strong USD vs Asian risk‑on) with FOMC risk ahead; on‑chain supports a consolidation narrative with cooler TradFi flows but improving adoption.
Macro events:
• FOMC: rate cut expectations → directional impulse possible, but also whipsaw risk.
• Strong USD: short‑term headwind for BTC, consistent with capping near resistance.
• Nikkei 225 at record highs: constructive Asian risk tone partly offsets USD drag.
Bitcoin analysis:
• Adoption/flows: BBVA (custody via Ripple) and KuCoin Pay (on‑chain payments) support future demand; Metaplanet adds to “corporate accumulation.”
• Critical zones: reclaiming 114–116k is needed to re‑ignite momentum; below 110,086 risks a 107,026 retest.
On-chain data:
• Accumulation between 108–116k; STH profitability ~60% → fragile without a push above 114–116k.
• ETF/futures inflows cooling → limited near‑term conviction.
Expected impact:
• Range likely persists while 113.24–114.0k holds; upside requires a high‑volume breakout, otherwise expect rotations and traps.
__________________________________________________________________________________
Key Takeaways
__________________________________________________________________________________
BTC is range‑bound with a credible cap at 113.24–114.0k and a defended floor at 111,956.
- Trend: neutral to slightly bearish while 4H–6H remain down and 113,241 isn’t reclaimed.
- Best setup: rejection shorts at 113.24–114.0k or defensive longs at 112.2–111,956 with tight risk.
- Key macro: FOMC ahead, with a firm USD acting as a near‑term brake.
Stay nimble: trade the edges, and only chase breaks backed by volume. 🔔
Fade 112k, buy 109.5/108k on signals__________________________________________________________________________________
Market Overview
__________________________________________________________________________________
BTC is consolidating mid‑range within 104k–116k after a clean rejection below the weekly pivot high (~112k). Intraday momentum tilts bearish while higher timeframes remain range‑bound.
Momentum: 📉 Bearish within a range — sellers active at 111.95–112.15, defensive bids lower.
Key levels:
• Resistances (HTF/MTF) : 111.95–112.15 (weekly), 113.5–114.0 (MTF), 115.5 (gate before 118k/121k).
• Supports (HTF/MTF) : 110.2–110.5 (MTF), 109.3–109.8 (MTF), 107.9–108.1 (HTF).
Volumes: Overall normal; moderate pickup on 1H retests of range edges.
Multi-timeframe signals: 2H–6H point Down; 12H–1D more neutral; LTF (15–30m) show range rebounds — consistent with selling 112k rejections and tactical buys at 109.3–109.8 / 107.9–108.1.
Risk On / Risk Off Indicator: SELL (mild risk‑off) — aligns with the bearish bias as long as 112k caps price.
__________________________________________________________________________________
Trading Playbook
__________________________________________________________________________________
In a range with MTF selling pressure, favor sell‑the‑rip and defensive buys on absorption. 🎯
Global bias: NEUTRAL SELL below 112k; key invalidation on a strong close >112.5k.
Opportunities:
• Tactical sell : Fade 111.95–112.15 on signal; target 110.5 then 109.6. (Stop >112.5)
• Defensive buy : Bid 109.3–109.8 on wick/absorption; target 111.1 then 111.9. (Stop <109.3)
• Breakout buy : Only above 112.5 on confirmed retest; target 114.0 then 115.5. (Stop ≈112.0)
Risk zones / invalidations:
• A reclaim >112.5 invalidates the sell bias and opens 114k–116k.
• A clean break <109.3 exposes 108.0 then 106.8/104k.
Macro catalysts (Twitter, Perplexity, news):
• Fed: Waller favors a cut vs Kashkari cautious; Beige Book “little change” — dovish tone would favor 112k/114k tests.
• US labor: ADP/claims/ISM Services today — strong surprises can trigger a break of the 110.3–111.3 micro‑range.
• Inflation mix: Oil <$60 (disinflation) but US tariff risks linger — likely keeps us ranging until 114k–116k is reclaimed.
Action plan:
• Short 112k rejection : Entry 111.95–112.15 / Stop 112.6 / TP1 110.5, TP2 109.6, TP3 108.0 → R/R ≈ 2.0–3.0.
• Defensive long 109.5 : Entry 109.3–109.8 / Stop 109.2 / TP1 111.1, TP2 111.9, TP3 112.5 → R/R ≈ 2.0–2.5.
__________________________________________________________________________________
Multi-Timeframe Insights
__________________________________________________________________________________
HTFs are range‑bound while MTFs (2H–6H) drift lower; LTFs attempt technical rebounds.
1D/12H: Range 104k–116k intact; 111.95–112.15 capping; 107.9–108.1 as base — below 112k, risk skew toward 110.5 then 109.5.
6H/4H/2H: Lower highs in place; prefer selling retests 111.3–111.6 and 111.95–112.15 toward 110.5/109.5.
1H/30m/15m: Micro‑range 110.3–111.3; long scalps from 110.3–110.6 with confirmation ; moderate volume pickup on edge retests.
Key divergences/confluences: Mild risk‑off + MTF Down = bearish confluence below 112k; absence of extreme volume tempers squeeze risk until 114k–116k triggers.
__________________________________________________________________________________
Macro & On-Chain Drivers
__________________________________________________________________________________
Macro is dovish‑but‑uncertain while on‑chain points to a digestion range — a setup favoring tactics over trends.
Macro events: Fed split (Waller pro‑cut, Kashkari cautious), Beige Book steady; JOLTS down with ADP/claims/ISM due — directional volatility risk. Oil <$60 and soft Swiss CPI = disinflation, but US tariffs keep inflation risks alive.
Bitcoin analysis: Broke below daily Ichimoku and retested as resistance; hesitation under a double‑top neckline; 30‑day realized vol low = uncertainty without panic. US spot ETF net inflows +$300.5M (Sept 3) with muted price response.
On-chain data: Accumulation 108k–116k (URPD) and lost high cost‑basis → 104.1k–114.3k corridor; STH ~60% in profit = fragile; neutral funding and slowing ETF intake = capped momentum.
Expected impact: While 112k isn’t reclaimed with volume, bias stays NEUTRAL SELL ; above 114k–116k, risk‑on resumes.
__________________________________________________________________________________
Key Takeaways
__________________________________________________________________________________
A controlled range persists with an active 112k ceiling and selective dip‑bidding lower.
- Overall trend: 📉 tactical bearish within a HTF range.
- Top setup: Fade 111.95–112.15 with invalidation >112.5 and targets 110.5/109.6/108.0.
- Macro key: Fed‑lean dovish but labor/ISM data could swing momentum toward 112k or down to 109.5.
Stay disciplined: trade the range, protect stops, and let closes above 112.5 and 114–116k speak. 🧭

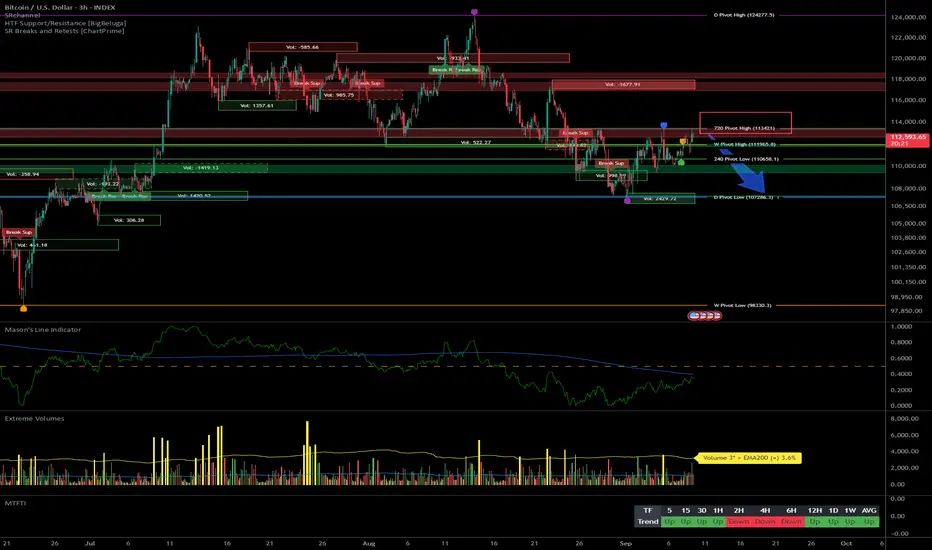
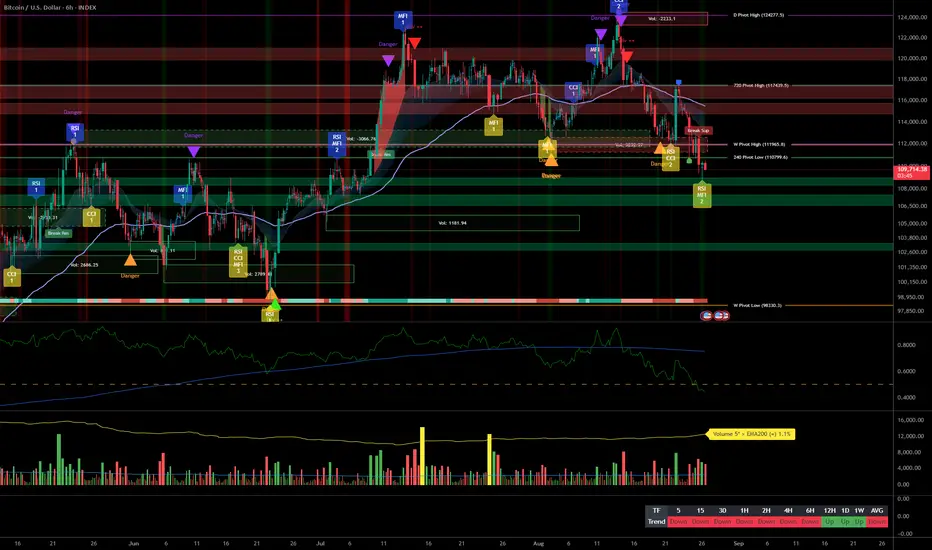
Risk-Off in play: fragile bounce until 111k is reclaimed__________________________________________________________________________________
Market Overview
__________________________________________________________________________________
BTC remains in a controlled pullback after the 124,277 rejection, compressing above 109k and gravitating toward the 107,100 HTF pivot. Sellers keep the upper hand, but a technical bounce can emerge if key supports hold.
Momentum: Bearish 📉 with lower highs/lows; selling pressure dominates below 111k.
Key levels:
– Resistances (HTF/LTF): 110.6–111.0k • 111.9k (W) • 114–115k (D)
– Supports (HTF): 109.0–109.3k • 107,100 (240 PL) • 103,000 (former demand)
Volumes: Moderate on 2H–6H, Normal on 1D → no capitulation; likely low‑range chop/wicks.
Multi-timeframe signals: LTF (15m–2H) trending down; 4H/2H show local bullish divergence (ISPD = BUY) near 107.1k; overall trend bias still Down.
Risk On / Risk Off Indicator: SELL (sell bias) — confirms the bearish momentum; a move to NEUTRE ACHAT would better support a bounce.
__________________________________________________________________________________
Trading Playbook
__________________________________________________________________________________
Below 111k, sellers drive the tape; favor “sell the rip” while keeping a tactical long only on clean reactions at support.
Global bias: Mildly bearish below 111.0k; main invalidation on a 4H close > 111.0k.
Opportunities:
– Fade the 110.6–111.0k bounce with a tight stop; target 109.6k then 109.0k.
– Tactical long on a strong 107.1k reaction (wick rejection + 2H/4H reclaim > 110.6k), target 111.9k.
– Continuation short if 4H/D closes below 107.1k toward 103k.
Risk zones / invalidations:
– A firm break below 107.1k invalidates longs and opens 103k, then 96.3k.
– A confirmed reclaim above 111.9k invalidates most shorts and opens 114–115k.
Macro catalysts (Twitter, Perplexity, news):
– Powell signaling a possible September cut but data‑dependent → solid prints help reclaim 110.6k+.
– US data (Durable Goods, Consumer Confidence) → negative surprises raise odds of a 107.1k break.
– Trade tensions (tariffs/supply‑chain) → risk premium, can cap rebounds.
Action plan:
– Long Plan (tactical): Entry 109.2k and 107.3–107.1k / Stop < 106.8k / TP1 110.6k, TP2 111.9k, TP3 114–115k / R:R ~2.0–2.5R.
– Short Plan (fade or breakdown): Entry 110.6–111.0k OR after 4H close < 107.1k / Stop > 111.2k (fade) or >108.2k (break) / TP1 109.6k (fade) or 103k (break), TP2 109.0k or 99–98k / R:R ~1.8–2.5R.
__________________________________________________________________________________
Multi-Timeframe Insights
__________________________________________________________________________________
Most timeframes lean bearish, with 4H/2H contrarian hints at a major HTF support.
1D/12H/6H: Lower highs/lows under 111k; magnet toward 107.1k; 114–115k only after a firm reclaim > 111.0k.
4H/2H: Bullish divergence (ISPD = BUY) around 108.8–109.3k/107.1k; only buy if 110.6k is reclaimed, then 111.9k tests.
1H/30m/15m: Trend favors sell‑the‑rip; fade 110.4–111.0k; watch liquidity sweeps sub‑109k to 108.6k; need a volume regime shift to reverse.
__________________________________________________________________________________
Macro & On-Chain Drivers
__________________________________________________________________________________
Macro turns more easing‑friendly yet data‑dependent, while institutional BTC demand persists despite deleveraging.
Macro events: Powell hints at a possible September cut (data‑dependent); RBA minutes tilt dovish; trade tensions (tariffs/undersea supply) → tactically supportive for risk unless inflation/geopolitics flip risk‑off.
Bitcoin analysis: US spot ETF inflows (+$219M on Aug 25) signal resilient institutional demand; players like MicroStrategy near ~3% of supply → steady float absorption.
On-chain data: CEX reserves ~3.27M BTC with recent net outflows; ~1,703 BTC moved from Coinbase Institutional to custody → accumulation bias, but high derivatives OI = squeeze‑prone.
Expected impact: If easing narrative and inflows persist, reclaiming 110.6k/111.0k becomes more likely; risk‑off shocks raise the odds of a 107.1k break.
__________________________________________________________________________________
Key Takeaways
__________________________________________________________________________________
Market sits in controlled range‑down, anchored by a key HTF pivot.
– Trend: Bearish/cautious below 111k, bounce potential if 107.1k holds.
– Top setup: “Sell the rip” at 110.6–111.0k; “Buy the dip” only on a clean 107.1k reaction and reclaim > 110.6k.
– Macro: Easing bias (Fed/RBA) helps a reclaim, but US data and trade tensions can cap risk.
Stay disciplined: trade confirmations and respect invalidations.
Bitcoin Critical Test Strong SELL Setup & Support at 112k__________________________________________________________________________________ Market Overview
__________________________________________________________________________________
BTCUSDT is entering a critical transition phase, with bears firmly in control and persistent compression around major weekly supports.
Momentum : Clear bearish trend 📉 as selling flows dominate and every rally gets rejected under resistance; no major signs of trend reversal at this stage.
Key levels :
Resistances ( HTF & MTF grouped ):
- Zone 121,500 – 124,700 $ ( D/240/HTF )
- 116,800 – 118,000 $ block ( 240/4H/1H )
- 114,600 $ intraday pivot
Supports :
- Critical pivot zone 111,980 – 113,000 $ ( W/HTF )
- Lower cluster 109,000 – 110,000 $
Volumes : Volume remains normal on high timeframes but defensive spikes are seen on 30min/15min, highlighting a lack of bullish capitulation and no sustained buying flows.
Multi-timeframe signals : All major timeframes (D, 12H, 6H, 4H) show pronounced bearish bias; a few brief bottoming attempts on 1H/4H lack structural strength. No compelling bull signals across the board.
Risk On / Risk Off Indicator context : “Strong sell” Risk On / Risk Off Indicator bias is confirmed across all timeframes, directly supporting the bearish momentum; no current macro/technical element challenges this view.
__________________________________________________________________________________
Trading Playbook
__________________________________________________________________________________
With a dominant bearish environment, strategy remains defensive—ready to sell failed bullish recoveries.
Global bias : Strong SELL as long as the chart remains under 116,800 $; any clean break below 111,980 $ invalidates the short-term reversal scenario.
Opportunities :
- Sell into failed rallies under 114,600 – 116,800 $ (tight stop recommended)
- Tactical scalps on weak intraday bounces towards 114,600 $
Risk zones / invalidations :
- Bear extension likely if 111,980 $ zone breaks cleanly—targets 110,000 $
- Sustained move above 116,800 $/118,000 $ = short squeeze threat; instant stop required
Macro catalysts (Twitter, Perplexity, news) :
- UK inflation re-acceleration sustains central bank uncertainty and a risk-off tone.
- Broader sell-off in Tech/Equities weighs on crypto beta, amplifying the defensive backdrop.
- Tether's latest stablecoin growth reflects dry powder, but structural demand hasn't returned yet.
Action plan :
- Entry: Short setups preferred below 116,800 $; confirm on failed test at 114,600 $
- Stop: >118,000 $
- TP1: 112,000 $ ; TP2: 110,000 $ ; TP3: 109,000 $
- R/R estimate: 2.5–3 depending on entry; tactical adjustments during FOMC minutes or major Powell speeches.
__________________________________________________________________________________
Multi-Timeframe Insights
__________________________________________________________________________________
All timeframes display a strong alignment to the downside, with only minor short-term volume divergences.
1D/12H/6H/4H : Price stays pressured below 116,800 $/118,000 $ with repeated rejections; support cluster 111,980–113,000 $ is key. No reversal patterns identified.
1H/30min/15min : Short-term volume spikes during defensive rebounds. Buyers quickly absorbed; attempted recoveries sold. 113,000 $ area offers tactical scalping but overall macro trend remains short-biased.
Major confluences : All timeframes focus on the same weekly support and highlight repeated failures under identical resistance blocks, reinforcing the SELL scenario until further notice.
__________________________________________________________________________________
Macro & On-Chain Drivers
__________________________________________________________________________________
Macro and on-chain drivers reinforce the technical bearish stance.
Macro events : UK inflation uptick revives global rate caution, Tech/Equities correction intensifies the risk-off mood, and all eyes are on FOMC minutes/Powell for major volatility; no bullish catalyst is evident.
Bitcoin analysis : Institutional flows are drying up, structural support lost with an “air gap” visible on-chain down to 110,000 $. Opportunistic accumulation between 112–114k $ remains insufficient as profitability drops.
On-chain data : Weak demand, defensive buying at local supports (113,000 $), negative ETF flows; intermediate capitulation phase is in progress, with further selling risk if 110–112k $ breaks.
Expected impact : The combination locks in a dominant SELL bias, confirmed by technical readings; all rallies are tactical and made to be faded.
__________________________________________________________________________________
Key Takeaways
__________________________________________________________________________________
BTCUSDT is locked in a bearish trend, defined by risk-off sentiment across both technical and macro/chain contexts.
In summary: trend remains bearish, the clearest setup is a strictly-managed short around key resistance, with invalidation above 116,800 $. Macro drivers, including global risk aversion and waning structural demand, weigh heavily—no bull catalyst has emerged.
Stay disciplined, monitor reactions at weekly support, and manage risk dynamically as new macro events unfold.
__________________________________________________________________________________

Bitcoin Macro Tailwind Meets Short-Term Volatility Battle__________________________________________________________________________________
Market Overview
__________________________________________________________________________________
Bitcoin’s momentum remains bullish on higher timeframes, but the price action is currently stalling below a critical resistance cluster, fueling volatility and intraday shakeouts.
Momentum 📈: The prevailing swing structure remains bullish, driven by robust mid/long-term trends; however, there is clear momentum fatigue with shallow corrections appearing on lower timeframes.
Key levels:
• Major resistances : 122,450–123,300 (primary pivot battle zone across daily/4H/12H), 119,812 (intermediate historic resistance now contested)
• Main supports : 119,812–118,050 (multi-TF pivotal demand zone), 114,967 (1D/4H pivot, also Weekly support)
• These zones are critical: breaking above 123,300 could spark a fast move toward 127k, while holding above 119,800/118,000 keeps the bullish structure intact.
Volumes: Normal to moderate on primary timeframes, but very high short-term spikes on 15min underline active volatility traps.
Multi-timeframe signals: Medium/long-term TFs (1D, 12H, 6H, 4H, 2H, 1H—all Up) confirm the bullish bias; however, the Risk On / Risk Off Indicator shifts to SELL on the 30min/15min, reinforcing near-term caution.
Risk On / Risk Off Indicator context: “Neutral sell” on the broader trend, flipping to SELL at short-term extremes—underscoring the need to defend positions as volatility rises into resistance.
__________________________________________________________________________________
Trading Playbook
__________________________________________________________________________________
The strategic backdrop favors bullish setups as long as price action holds major support, but discipline and swift reaction are needed while Bitcoin hovers under vital resistance.
Global bias: “Neutral buy” as long as 119,812/118,000 holds; any solid break below 118,000 flips the swing outlook neutral or bearish.
Opportunities:
• Tactical buy on structured pullback into 119,812/118,050 – key swing entry zone.
• Conditional breakout trade above 123,300 – sets up an extension toward 127k, especially if shorts get squeezed.
• Defensive scalp only on volatility flushes and rapid reclaim above 120,156/119,812.
Risk zones / invalidations:
• Confirmed breakdown below 119,812 is the first warning sign—opens risk of a retest of 118,000 or deeper.
• Sustained loss of 118,000 = neutrality/bearishness resumes, opportunity for strategic selling may appear.
Macro catalysts (Twitter, Perplexity, news):
• Accelerating global liquidity (US M2 surge, China credit) underpins the risk asset backdrop.
• Geopolitical easing (Ukraine truce, G7 signals) reduces systemic threats; tailwinds for risk markets.
• Looming short squeeze ($6B in shorts at 125k) could fuel explosive breakout moves if resistance breaks.
Action plan:
• Entry : Staggered buying into 119,812/118,050 or confirmed breakout above 123,300.
• Stop : Below 118,000 (key swing stop).
• TP1 : 122,450, TP2 : 123,300, TP3 : 127,000 short squeeze extension.
• R/R: Moderate to high; optimal if entered near support or confirmed clean break.
__________________________________________________________________________________
Multi-Timeframe Insights
__________________________________________________________________________________
Multi-timeframe analysis shows strong trend alignment on higher frames, contrasted by rising volatility and trap risk on the intraday scale.
1D/12H/6H/4H: Bullish structure and trend intact, with broad support at 119,812/118,050; strong resistance cluster at 122,450/123,300 preventing further upside for now. Each dip to support has triggered buyer defense and recovery.
2H/1H: Sideways consolidation at the upper range, above key supports. Corrections remain shallow unless 119,800/118,000 break.
30min/15min: Clear divergences—momentum shifts bearish, volume spikes, trap risk is high. These signals warn against chasing breakouts prematurely and demand patience.
The underlying theme: The pivotal zone between 118,000 (support) and 123,300 (resistance) is where momentum for the coming days will be defined—traders must monitor reaction closely rather than anticipate.
__________________________________________________________________________________
Macro & On-Chain Drivers
__________________________________________________________________________________
Macro and on-chain trends offer fundamentally bullish support for Bitcoin, although short-term volatility and positioning require active risk management.
Macro events:
• Global liquidity is on the rise (US M2, China credit), supporting higher valuations for risk assets.
• Market expectation for US Fed rate cuts, bullish macro calendar, and reduced credit spreads—all positive for risk-on sentiment.
• Easing geopolitics (Ukraine diplomacy, G7 moves) lowers the threat of sudden shocks, adding stability.
Bitcoin analysis:
• Strong institutional inflows and treasury allocations, growing support from large funds.
• Key short squeeze level at 125k—liquidation of $6B in shorts could drive a rapid extension if resistance is breached.
• Bitcoin dominance dropping below 60% hints at capital rotation into alts but can also revert quickly if the market overheats.
• Institutional custody solutions and secure insurance ramping up, supporting greater adoption.
On-chain data:
• Profitability among holders is very strong; minimal signs of forced selling or capitulation.
• No major signs of excessive euphoria; volatility implied to be low—a classic contrarian prelude to a volatility spike.
Expected impact: These drivers underpin the swing-long bias but demand precise execution and tactical caution around major resistance traps and volatility spikes.
__________________________________________________________________________________
Key Takeaways
__________________________________________________________________________________
Bitcoin remains in a mature uptrend but is stalling beneath heavy resistance, requiring patience and disciplined execution.
The global trend is bullish as long as 119,800/118,000 zone holds—these are structurally critical. The most relevant setup is a conditional breakout play above 123,300, targeting 127k if momentum and shorts align, but caution is needed due to heightened short-term trap risks. Macro tailwinds (liquidity surge, geopolitics improving) give deeper support but don’t remove the need for vigilance as intraday volatility remains acute.
Stay nimble: avoid chasing into resistance, wait for signals of real flow, and prepare for fast reversals near the key battle zones.

AUD/JPY: Fading the Rally at a Major Resistance ZoneWhile AUD/JPY has been in a clear uptrend, the rally is now approaching a significant technical ceiling where sellers have previously stepped in. We see a compelling opportunity for a counter-trend short, betting that this resistance level will hold and that the current bullish momentum is showing signs of exhaustion.
This trade is for those watching for a market turn, offering a well-defined risk-to-reward setup for a swing position.
🤔 The "Why" Behind the Short Setup
📰 The Fundamental Risk
The Australian Dollar is a "risk-on" currency, meaning it performs well when global markets are optimistic. The Japanese Yen, however, is a classic "safe-haven" asset that strengthens during times of uncertainty. With the upcoming high-impact Australian CPI data, any sign of economic weakness could disappoint the market, increase pressure on the RBA, and trigger a "risk-off" move that would benefit the Yen and send AUD/JPY lower.
📊 The Technical Ceiling
The chart tells a clear story. The price is currently testing a major resistance zone. Attempting to short near a strong ceiling like this provides a strategic entry to capture a potential trend reversal. We are essentially betting that the trend's multi-week momentum will stall and reverse from this key technical juncture.
✅ The High-Clarity SHORT Trade Setup
📉 Pair: AUD/JPY
👉 Direction: Short
⛔️ Entry: 96.716
🎯 Take Profit: 92.080
🛑 Stop Loss: 98.907
Rationale: This setup plays for a significant swing move. The wide stop loss is designed to withstand volatility from news events, while the deep take profit targets a full reversal back to major support levels seen earlier in the year.

NZD/JPY: Bearish Wedge Before RBNZ CatalystThis is a high-conviction trade idea for NZD/JPY , where a perfect storm of technical and fundamental factors is aligning for a significant short opportunity. The setup is clean, the reasoning is strong, and we have a clear catalyst on the horizon. 🚀
Fundamental Analysis 🌪️
The macro picture is the primary driver here, creating a powerful bearish case.
1️⃣ Monetary Policy Divergence (🇳🇿 vs 🇯🇵): This is the core engine of the trade. The Reserve Bank of New Zealand (RBNZ) is dovish, signaling rate cuts amid a fragile domestic economy. In stark contrast, the Bank of Japan (BoJ) is hawkish, having started a historic policy normalization to combat persistent inflation. This fundamental clash is strongly bearish for NZD/JPY.
2️⃣ Risk-Off Catalyst (🇺🇸): The market is nervous ahead of the July 9th US tariff deadline . This uncertainty is creating a classic "risk-off" environment, which typically strengthens the safe-haven JPY and weakens risk-sensitive currencies like the NZD.
3️⃣ The RBNZ Decision (🏦): The main event on July 9. The market expects a "dovish hold," meaning even if rates are unchanged, the forward guidance will likely be very cautious, highlighting economic risks and signaling future cuts. This is the catalyst that could trigger the sell-off.
Technical Analysis 📉
The 4H chart provides crystal-clear confirmation of the fundamental weakness.
1️⃣ Bearish Rising Wedge: Price is being squeezed into a classic bearish reversal pattern. This shows that buying pressure is exhausted, and the market is preparing for a move to the downside.
2️⃣ Key Resistance Zone: The wedge is pushing directly into a heavy supply zone between 87.80 and 88.00 . This area has acted as a firm brick wall 🧱, rejecting multiple attempts to move higher.
3️⃣ RSI Momentum: The RSI below the chart confirms the weakening momentum. It's failing to show strong bullish power, which supports the price action and signals that the uptrend is running out of steam. 💨
The Trade Plan 🎯
Based on this analysis, the plan is to enter with a limit order to get an optimal entry price on a potential final spike into resistance.
Direction: Short (Sell) 📉
Order Type: Limit Sell
Entry: 87.80 📍
Stop Loss: 88.40 🛡️
Take Profit: 86.00 💰
Risk/Reward Ratio: 1:3 ⭐⭐⭐
This setup presents a rare confluence of fundamental divergence, technical weakness, and a clear catalyst.
Trade safe and manage your risk.

Upward Momentum, Caution Near 106,500–110,000 Resistance__________________________________________________________________________________
Technical Overview – Summary Points
Momentum: Strong bullish bias on mid/long-term (1D-4H), short-term "Down" divergences (1H/2H). Overall alignment, no capitulation/euphoria signals.
Key supports / resistances: Supports at 103,300/102,600 (D Pivot Low, 720 Pivot). Major resistances: 106,480–109,952. Price compression under daily/weekly resistance, technical rejection risk.
Volumes: Normal to moderately high, 1H abnormal volumes signal possible squeeze.
Multi-TF: Bullish confluence 1D–6H, short-term Down divergences, caution required for late long entries under resistance.
Risk On / Risk Off Indicator: "Strong Buy" signal consolidated across all timeframes except 15min (neutral ST), sector bullish.
ISPD DIV: Neutral on all TFs – no behavioral overheating or exhaustion.
__________________________________________________________________________________
Strategic Summary
Overall bias: Bullish HTF setup (1D–4H), buy opportunities on dips towards 103,300/102,600, stop <102,000.
Risk zones: 106,480–109,950 = resistance cluster, active management required. Technical invalidation below 102,000.
Macro catalysts: Window of increased volatility 15:00–16:00 UTC (CB Consumer Confidence & Powell speech). Middle East geopolitics = “wildcard”, caution on any escalation.
Action plan: Buy on pullback, manage actively >106,000, mandatory protection during news hours, reassess post-macro-volatility.
__________________________________________________________________________________
Multi-Timeframe Analysis
1D & 12H: Upward momentum confirmed, solid supports, no exhaustion signals, Risk On / Risk Off Indicator "Strong Buy".
6H–4H: Technical and behavioral confirmation, constructive volumes, caution near immediate resistances.
2H–1H: Short-term downside divergence, 1H very high volumes = potential squeeze or shakeout, active caution required under resistance.
30min–15min: Consolidation/digestion; Risk On / Risk Off Indicator neutral at 15min, no impulsive entry point yet.
Summary: Robust up-structure on HTF, buy-side strategies on dips favoured, active management imperative near resistance and macro volatility events.
__________________________________________________________________________________
Fundamental, On-Chain & Macro Risks Analysis
Macro news: No immediate catalysts except USD news (CB Consumer Confidence, Powell) at 15:00-16H00 UTC, source of temporary volatility – no prevailing trend in question at this stage.
On-chain / Market: High volumes, institutional leadership, no “retail” panic, no flush/fomo, healthy structure.
Leverage: OI >$95B, stablecoin dominance, risk contained except on external triggers (macro, geopolitical).
Geopolitics: Middle East context = spike risk, active management mandatory on escalation.
__________________________________________________________________________________
Summary:
• Dominant bias Up (buy on dips >102,600), active management below major resistances (106,500–110,000).
• Key stop <102,000 (invalidation).
• Increased risk window: 15:00–16:00 UTC (USD news).
• Monitor leverage, adjust exposure ahead of key catalysts.

BTC/USD Trading Setup – Bear Trap & Reversal PlayBTC has followed a former volatility setting where an initial sharp dump was followed by a reversion to prior levels with shrinking volatility, only to see another leg down extending 7% beyond the first drop. This pattern indicates a liquidity sweep before a potential structural shift.
Adding to the pressure, political instability has fueled market uncertainty, leading to a broad risk-off sentiment. Notably, gold is also at risk of a correction, and BTC is likely to dump alongside it rather than act as a hedge . This suggests a macro-driven selloff across multiple asset classes before any meaningful recovery.
BTC has now tested the 90K region five times, making it a key inflection point. A final dive below this level for a liquidity grab is highly probable before any major reversal. The tightening volatility percentages provide insight into an impending expansion phase, signaling that a significant move is approaching.
This setup presents an ideal bear trap opportunity. A final shakeout below 90K could lead to liquidity absorption, setting up a strong long-term positioning for a recovery. Smart entries on the final flush could offer a highly favorable risk-reward play for bulls.

Fundamental Analysis of EURUSDEURUSD is trading in the support area which has been respected by the price action since December of 2022. Similarly, there is an area of resistance.
There are two scenarios based on the current geopolitical tension and the policy of the new administration in the US.
Scenario#1: Risk OFF or USD depreciates against EUR and other currency pairs
The new US administration will take charge in Jan 2025, and by that time if the Scenario#2 has not happened then the EUR should appreciate significantly against USD. The new administration is expected to be business friendly. The US economy should get an ultra-boost because of lower taxes and less regulations.
There are many other promises made by the winning party like the increase in import tariffs on all the countries, deportation etc., maybe those promises were to attract voters. We don't know how it will play out, so we go with the simple approach that republican party means less regulation, hence business friendly.
Scenario#2: Risk ON or USD appreciates against EUR and other currency pairs
This scenario could play out even before the new administration takes charge!!! We don't know if it is a bluff from Russia or a real threat, but the fear of nuclear war can be frightening. Whenever there are major escalations in the world, the USD appreciates and that is as simple as 1 + 1 = 2, right?

Risk-On or Risk-Off? Stocks vs. Bonds Introduction:
With stocks reaching new all-time highs and market sentiment edging into euphoria, it's an opportune time to revisit a classic risk-on/risk-off indicator: the ratio between stocks AMEX:SPY and long-term bonds NASDAQ:TLT . This ratio provides a clear view of investor sentiment:
Risk-On: When SPY outperforms TLT, investors favor equities for their higher potential returns.
Risk-Off: When TLT outperforms SPY, it reflects rising risk aversion and a move toward safer assets like bonds.
Analysis:
Uptrend Intact: Currently, the SPY-to-TLT ratio remains in a clear uptrend, defined by a series of higher-highs and higher-lows. This sustained upward momentum signals continued confidence in equities.
Ascending Channel: The ratio is also rising within an ascending price channel, a bullish continuation pattern. As long as this structure holds, the market can be interpreted as firmly in risk-on mode.
What to Watch:
Channel Support: A breakdown below the channel’s lower boundary would be the first sign of caution.
Higher Highs: If the ratio continues to push upward, it would confirm further bullish sentiment in equities.
Conclusion:
The SPY-to-TLT ratio is a key barometer for risk appetite, and its sustained uptrend within the ascending channel is a clear signal of the market’s risk-on posture. As long as this trend holds, equities remain in a favorable position. However, traders should stay vigilant for any signs of a breakdown, which could hint at rising market caution. Are you aligned with this risk-on outlook, or do you see potential cracks forming? Share your thoughts below!
Charts: (Include charts showing the SPY-to-TLT ratio, the ascending price channel, and key trendlines for support and resistance)
Tags: #SPY #TLT #RiskOn #RiskOff #Stocks #Bonds #TechnicalAnalysis #MarketTrends
