Overbought with Potential Support and Resistance LevelsLooking at the chart for RLC, we can see that the current price is at 1.973, with a 4-hour timeframe. The RSI is showing a value of 77, indicating that the coin is overbought at the moment. Looking at the Fibonacci levels, we can see that the 0.5 Fibonacci level is at 1.606, while the 1 Fibonacci level is at 1.657. These levels could act as potential support levels if the price were to fall.
On the other hand, the upper Bollinger band is at 1.982, indicating a possible resistance level if the price continues to rise. The lower Bollinger band is at 1.422, which could serve as a solid support level if the price were to drop significantly. The middle Bollinger band is currently at 1.703, and it may also act as a support level in the future.
Looking at the volume oscillator, we can see that it is currently at 13%, which is not too high but not too low either. The MACD is showing a value of 0.094, which is a positive sign. The stochastic oscillator is quite high at 95, indicating that the coin is in overbought territory.
The hourly EMA 50 is at 1.666, which may act as a support level if the price were to fall. The On-Balance Volume (OBV) is currently at 247.766M, which is a good sign and indicates that the volume is increasing as the price rises.
Based on the chart analysis, we can identify some key support and resistance levels. The 0.5 Fibonacci level at 1.606 could act as a solid support level if the price were to drop. The lower Bollinger band at 1.422 could also serve as a strong support level. On the resistance side, the upper Bollinger band at 1.982 may act as a solid resistance level if the price continues to rise. Additionally, the 1 Fibonacci level at 1.657 could also serve as a potential resistance level.
Overall, the indicators suggest that the coin is currently overbought and may see a correction in the near future. However, the increasing volume and positive MACD are encouraging signs for the long-term trend of the coin.
RLC

Rlc: Double bottom patternWith the double bottom playing out and the RSI giving a divergence move and the Neckline has broken with a nice retest we are confirmed to hit the upper part of the down trend

iExec RLC Should Resume Bullish Move SoonIf we successfully remain above the neckline, we should go for the weekly's inverted HS pattern targets at 1064 and 1490.
We nearly hit 1064 on the first move up after crossing the neckline, and then nearly lost the neckline after closing below it briefly.
There is also a golden cross on the 50/200 day EMA and this is our 2nd time approaching a cross back in the other direction, the first unsuccessful. If this 2nd attempt at a death cross is also unsuccessful, the bull case gets much stronger, and 1490 could be easily exceeded. Not pictured is the golden cross on the 50/200 day MA, which is still golden ;)

Weekly Falling Wedge Breakout & TargetsSimple weekly chart here, RLC broke out of a falling wedge earlier in the year, with targets around 4.32 and 5.76.
Note - Last time OBV rose to these levels we saw a spike up to 10-12 dollars. We also see golden crosses on the 50/200 day EMA and MA

Lrc Breaking bullish pennant Formed Bullish Pennant In h4 timeframe Incase Of breakout expecting 30 to 35% bullish Move
Look For buying Opportunities After breakout


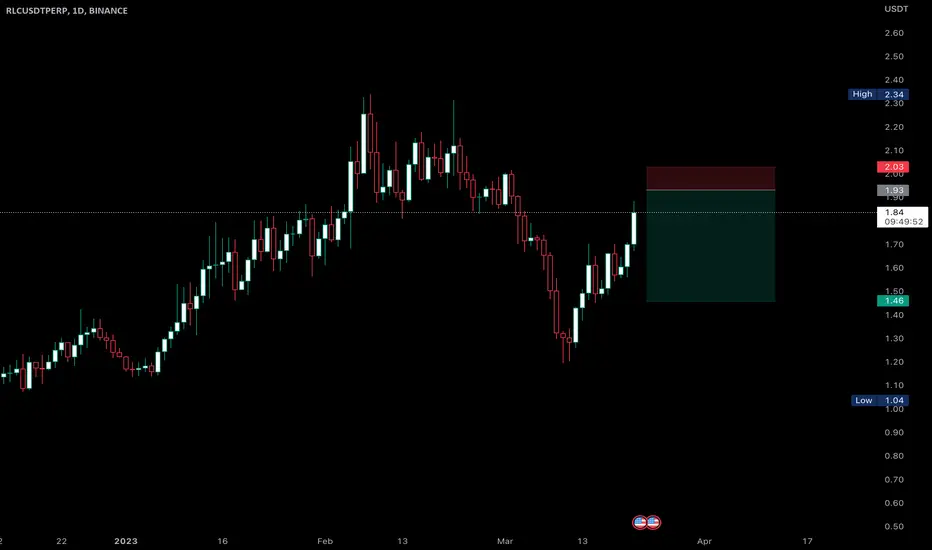
RLCUSDTPLZ DO NOT SELL MY SIGNALS
1-Apply your own risk management.
2-Daily and Weekly Targets
3-Hunt the profits at any level you see convenient for you.
4-Green Zone for entry,
5-Red Level Exit by OCO
6-Yellow levels are targets.
have a good day guys.

RLC IS BULLISHHi, dear traders. how are you ? Today we have a viewpoint to BUY/LONG the RLC symbol.
For risk management, please don't forget stop loss and capital management
When we reach the first target, save some profit and then change the stop to entry
Comment if you have any questions
Thank You

✴️ iExec RLC (Update by request)This is a reply to @kush23456 in the comments section, this might be useful to others that follow RLCUSDT.
It looks quite ready to move forward.
First, here is RLCUSDT weekly:
- Last week it moved above EMA50 and this week EMA100 and EMA10.
- This is happening after 5 weeks of correction and within a higher low.
- These are strong reversal signals but the week is still young.
On the daily timeframe you get many more confirmations:
- The high volume yesterday confirms the bullish action that is present in the past 11 days.
- The correction low closed in a hammer and Doji and then strong up.
- There is also a V shaped recovery pattern.
This is a mixture of recovery signals followed by multiple confirmations.
It is already growing and set to move higher.
At this point one would look for an invalidation point since the bulls already confirmed having the upper hand.
If RLCUSDT moves and closes daily below EMA300 (1.536) you can say the bullish momentum weakens but still there.
If it moves below MA200 ($1.36) more weakness but the bullish bias remains intact.
As long as it stays above the 10-March low, the potential is 100% up.
We should see additional growth based on the current chart.
I hope that helps.
Namaste.

RLC SHORT TRADE IDEAShorting RLC based from Open-Interest, Liq predictions, and intuition.
Short may take a while to fully close with profits, also FOMC tmr so set a strong SL nearby just in case if they release anything under a .5 bps
iExec RLC price will be able to repeat the growth as in 2020 ?What is iExec RLC?
iExec is a provider of decentralized computing based on the blockchain. Blockchain is used to organize a marketplace network where people can monetize their computing power, as well as applications and even datasets.
This is done by providing on-demand access to cloud computing resources. IExec can support applications in industries such as: "big data", healthcare, artificial intelligence (AI), rendering, and fintech.
Application vendors can monetize their algorithms, and data providers who own valuable datasets can make them available for use through iExec
So why should you pay attention to RLC if the price stays above $1.30 in the coming days/weeks?
the project was founded in 2016, and the RLCUSD, RLCUSDT trading pair has been on crypto exchanges since 2017 (it has survived more than one crypto winter, and is still developing)
RLC token reached its maximum price at the peak of the DeFi boom, as it is directly related to the DeFi sector.
RLC token can be used in the field of "artificial intelligence (AI)," and the hype around it is only gaining momentum.
_____________________
Did you like our analysis? Leave a comment, like, and follow to get more

Long RLCNot sure wtf RLC is but getting some confluence on the charts. Most other dog shit pumped off the 1 hour 200 D MA already but RLC is lagging, going to see if I can catch a pop here. Tight Stops. Cup and handle confirmed, really tracking the 200 Moving, also holding the HTF purple trend line. Think we get a pop. Not advise.

RLC CAN DROP AGAINHi, dear traders. how are you ? Today we have a viewpoint to SELL/SHORT the RLC symbol.
For risk management, please don't forget stop loss and capital management
When we reach the first target, save some profit and then change the stop to entry
Comment if you have any questions
Thank You

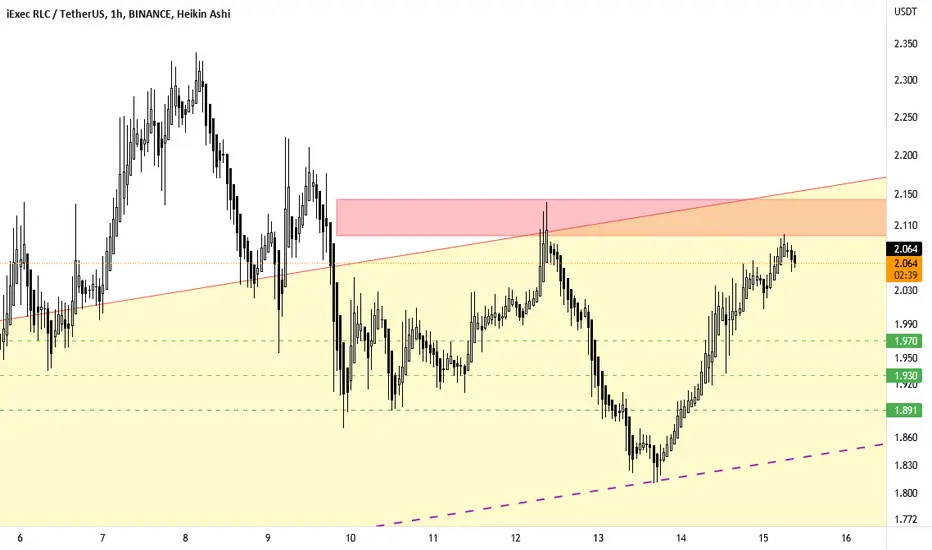
SasanSeifi💁♂️ #RLCUSDT /4H HI TRADERS ✌ The possible scenario of RLCUSDT is specified. As you can see, the price is currently trading in the range of $2 . According to the behavior of the candles, we can expect the price to grow to the range of $2.077 / $2.13 / $2.21.We have to see how the price will react to the 2.077 range. In case of stabilization above the range of 2.077, the target of 2.21 can be considered.
❎ (DYOR)...⚠⚜
WHAT DO YOU THINK ABOUT THIS ANALYSIS? I will be glad to know your idea 🙂✌
IF you like my analysis please LIKE and comment 🙏✌

RLC Bullish patternHello guys , i think we will see big pump here bcs fundamental is very positive and chart looks very good !
Hit me like if you agree !

rlcThe upcoming resistance zone reacted to it. If it wants to correct, then one of the green lines is suitable for support, and otherwise we have to wait for the failure of this resistance.
Rlc breaks bulish flag Bulish Flag breakout has already confirmed Retesting In process Incase of Successful retest Expecting another bulish Impulse
Incase Of Successful Retest expecting 20 to 25% bulish Move

Long term idea on RLCBTCMy first HODL idea. Please provide your thoughts BINANCE:RLCBTC
SELL 75pct at 30000 sat
SELL the rest at the rest at 100k sat

one of my RLC hold betsrlc has two important resistances that, if broken, cannot work below them.
the first 4.28
and the second 7.15

TOP ASSETS of the AI NARRATIVE | PART 2In the comments of “Top AI assets part 1” you mentioned some more promising projects, the main product of which is AI. We decided to tell you more about them and check their metrics
iExec RLC
iExec is considered as a project with the AI narrative, but it is partly wrong. The main specialization of iExec is providing computing power and organizing the market around this sector.
iExec forms large volumes of data and if we check their products, we will see that these volumes of data are being used actively but we have to understand that this is a side line of their business. In general, iExec as a project is more like Flux than any project in the AI narrative.
Metrics of the $RLC token:
Price: $1.75
ATH price: $11.6
Market.cap: $141m
ATH market.cap: $800m
FDMC: $152m
Over the past 2 months, the $RLC token has grown more than 2 times.
We do like iExec as a project with its own goals and values and that’s why we listed it on our platform for trading
Vectorspace AI
The team focuses on creating AI and ML solutions in space biosciences, general life science and capital markets. So far the team has launched two products:
A financial product for protecting investment portfolios and finding stock and cryptocurrency market correlations for long or short trades.
A product for biosciences in a Protein Relationship Networks area.
Metrics of $VXV token:
Price: $0.57
ATH price: $18.1
Market.cap: $27m
ATH market.cap: $347m
FDMC: $28m
Over the past 2 months, the $VXV token has grown more than 2 times.
Matrix AI Network
Project that focuses on an AI integration directly into the crypto. Matrix has 4 main products:
Mania - a platform for trading AI algorithms in an NFT type
Airtist - a generative art creation platform for NFT
Manta - an automatic machine learning platform
Matrix - an AI service platform
Metrics of $MAN token:
Price: $0.02254
ATH price: $1.7
Market.cap: $4.8m
ATH market.cap: $6m
FDMC: $22.5m
Over the past 2 months, the $MAN token has grown more than 4 times.
Numeraire
Platform for Data Science and Machine Learning specialists. Project supports DS and ML specialists, conducts predictive ML contests and builds its own progressive community.
Metrics of $NMR token:
Price: $16.7
ATH price: $84
Market.cap: $98m
ATH market.cap: $487m
FDMC: $183m
Over the past 2 months $NMR has grown by 64%
Streamr
A project for data transferring within web3. Streamr is primarily an infrastructure project, preparing the basis for the data economy.
Metrics of $DATA token:
Price: $0.03308
ATH price: $0.3102
Market.cap: $25m
ATH market.cap: $223m
FDMC: $28m
Over the past 2 months $DATA has grown by 50%
Conclusion
As we’ve told you earlier, the benefits that AI offers, along with its increasing adoption and application, guarantee the expansion of AI projects and a profitable market.
Let us know in the comments about more AI projects we should look at. Share your investing or trading experience with such projects.Thanks for reading!

RLC 2023 chartHere we can see RLC formed a cup & handle very well so far unless if that support is broken then it will become invalidated.
The first target will be $2.6


Long RLC/usdtWith the current AI narrative RLC is lagging behind. I think it' s going to catch up soon!
