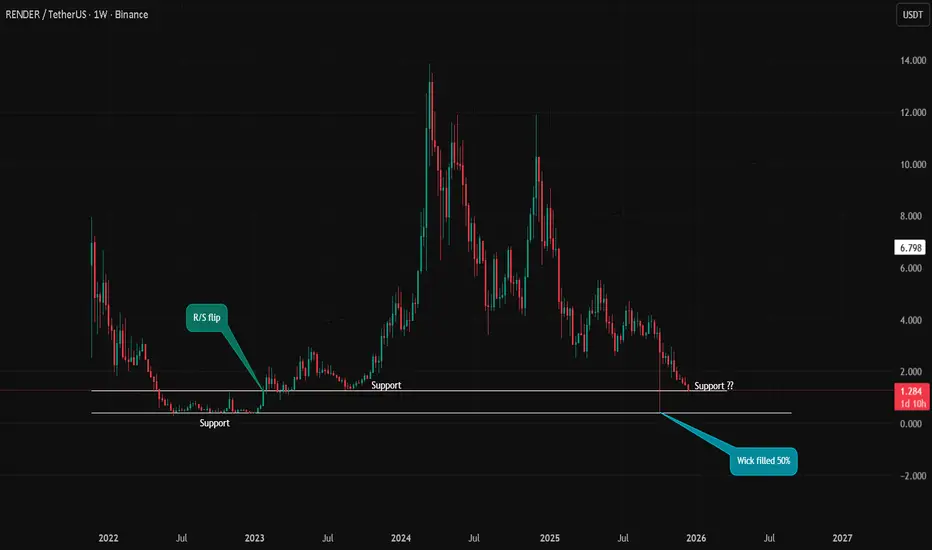
RNDR – Weekly Structure Price is currently trading at a major HTF support zone around $1.20–$1.30.
This level previously acted as strong support and resistance, making it a key decision area.
The recent downside wick has been partially filled (~50%), which often signals temporary demand, but structure is still bearish on the higher timeframe.
Key levels to watch:
Support: $1.20 – $1.30
Next downside risk: If this level fails → possible continuation lower
Bias:
As long as price holds above support → potential range / relief bounce
Weekly close below support → bearish continuation scenario
Patience is key here. Let price confirm direction before entering.
Not financial advice. Always manage risk.
MrC
Rndr
RNDER is trying to form its pivot bottom. RNDR is consolidating in a triangular formation. The bias is to the downside. However, this could be the last consolidation for swing failure that causes the reversal—time to focus.
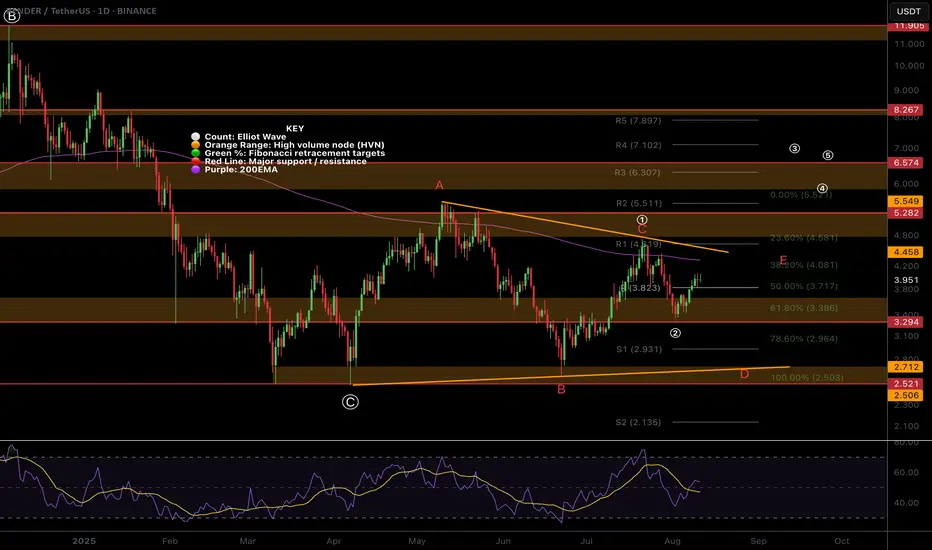
$RENDER bearish triangle or motif wave?I have 2 local Elliot Wave counts for CRYPTOCAP:RENDER the bearish triangle yet to complete wave D which would result in a final thrust down before a new macro uptrend and a (1) (2) with wave (3) started.
The overlapping and slow price action does not suggest RENDER is in a wave as it is not moving impulsively.
Many alts have failed to move from the bottom while others have shined like ETH and XRP etc..
Either this is the new normal behaviour for 'alt season' or we are not actually in alt-season yet with a big move lower around the corner!
Safe trading
RNDR Trade Setup – Double Bottom & Support ReclaimRender (RNDR) has shown strong resilience by forming a double bottom and reclaiming the key $4 level, signaling potential strength. We’re now watching for a sweep into downside liquidity (sub-$4 wick), with a daily close still holding above $4—this would confirm a strong long opportunity.
🔹 Entry Zone:
$3.50 to $4.00
🎯 Take Profit Targets:
🥇 $5.64
🥈 $6.70
🛑 Stop Loss:
Daily close below $3.00

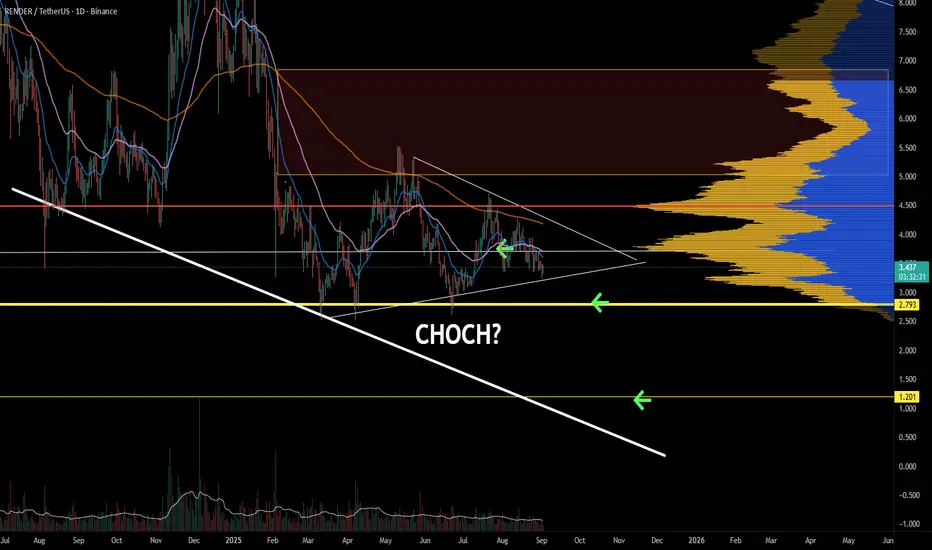
Render getting ready for a reversal? RNDR price action got strong support twice at a good inflection point. Momentum and trend oscillators are diverging and in the bullish control zone. Market structure may confirm a choch.
Full TA: Link in the BIO

RNDR Long Swing Setup – Double Bottom at Key SupportRNDR has formed a textbook double bottom at the $3.00 high-timeframe support, hinting at a potential trend reversal. The strong bounce off that level shows bullish intent, and we’re now eyeing the $3.50–$4.00 zone for a potential throwback entry, turning old resistance into new support.
📌 Trade Setup:
Entry Zone: $3.50 – $4.00
Take Profit Targets:
🥇 $5.25
🥈 $6.60
Stop Loss: Daily close below $2.70

ALTS Shine, +55% INCREASE !! FTM | RNDR | Render and Fantom have made steep increases over the past two weeks.
In the past two weeks, FTM increased a whopping 55%:
And RNDR increased around the same amount:
This naturally makes it likely to see a correction soon, which may be the ideal time to get into the accumulation boat - or just for a swing trade.
________________________
GEMINI:RNDRUSD CRYPTO:FTMUSD

RNDRUSD - W Pattern BreakoutRNDR Looks as if it has formed a double top but it is secretly a W pattern waiting to form within this wedge / triangle structure
Still bullish as long as price stays above the dotted white line
Bullish on this daily timeframe

RNDR SHORT/LONGWe had a strong reaction from $3.5, with a bounce of nearly 50%. Currently, the price is at a support level of around $4.1.
From here, the price could either consolidate or gradually move lower toward $3.5, possibly even $3, as the Stoch RSI still has room to go down.
However, a short-term rally toward the 21 EMA on the daily timeframe ($5.6) is also possible.
I'm considering entering a short if the price makes a fakeout above the 21 EMA, targeting at least $4. After that, if the setup aligns, I would look for opportunities to scale into long positions. We also need to remember that on February 11, RNDR will release 0.10% of its total supply into circulation.
This could add some selling pressure, so it’s worth considering when evaluating potential price movements.

RNDR Chart AnalysisLets break it down:
Structure and Price Action:
**Rising Wedge Formation**:
The chart shows a **rising wedge**, which is typically a bearish reversal pattern. Price is currently trading near the lower boundary of the wedge, increasing the likelihood of a breakdown.
**Red Resistance Zone**:
The price rejected the key **red resistance zone** between $10.0–$11.0, indicating strong selling pressure.
**Higher Lows**:
Despite rejection at resistance, the price has maintained **higher lows**, signaling bullish attempts to sustain the uptrend.
**Bearish Momentum Developing**:
Price is now testing the rising support line. A breakdown here could lead to a reversal toward lower levels.
Support and Resistance:
**Immediate Resistance**: $10.0–$11.0 (red resistance zone where sellers are dominant).
**Key Support Levels**:
$8.50: Rising support line and psychological level.
$7.50–$7.00: Green order block area where buyers previously stepped in.
Below $7.00: Strong support near $5.50–$5.00 (historical support zone).
Indicators:
Moving Averages (EMA 20/50/100/200):
Price remains above the **EMA 20** ($8.96) and EMA 50 ($7.82), showing bullish bias in the short-term trend.
The **EMA 100/200** at $7.03 and $6.68, respectively, provide stronger long-term support.
Money Flow Index (MFI):
**58.08** indicates neutral momentum but leaning slightly toward bullish, suggesting buyers still have some control.
Stochastic RSI:
The Stochastic RSI is currently near **oversold territory** (11.56), suggesting a potential bounce from support levels.
However, if price fails to hold support, oversold conditions can persist, leading to further downside.
Volume:
Volume during the recent move upward has been declining, suggesting weakening bullish momentum.
Watch for a volume spike on any breakout or breakdown to confirm direction.
Pattern Analysis:
The **rising wedge** pattern signals caution as it leans bearish. A breakdown below the wedge's lower trendline would confirm a reversal.
Rejection at the red resistance zone strengthens the bearish outlook unless bulls regain control.
Probabilistic Outlook:
Bearish Breakdown (Primary Scenario):
If price breaks below the rising support line (~$8.50), bearish momentum will increase.
Key downside targets:
**First Target**: $7.50 (order block zone).
**Second Target**: $7.00–$6.50 (EMA 100/200 levels).
**Third Target**: $5.50–$5.00 (major historical support).
Bullish Continuation (Alternate Scenario):
If price reclaims $10.0–$11.0 with strong volume, the uptrend will resume.
Key upside targets:
**First Resistance**: $11.50.
**Second Resistance**: $12.00–$12.50 (previous highs).
Key Signals to Watch:
A breakdown below the rising support line (~$8.50) = **Bearish confirmation**.
A breakout above $10.0–$11.0 resistance = **Bullish continuation**.
Volume spike during breakout or breakdown will confirm the move.
Conclusion:
The chart shows a **rising wedge** with weakening bullish momentum, increasing the probability (~65–70%) of a bearish breakdown. A decisive break below $8.50 would target lower levels at $7.50 and beyond. Conversely, a breakout above $10.0–$11.0 could invalidate the wedge and continue the uptrend toward $12.00.

Render Network RENDER Long: EWT Analysis & Cycle Peak Targets+ Possible overextended Wave 5 count now?
Trading within Wave (3) of Wave V impulse.
Any major peaks in RENDER have extended as high as the following fib extensions...
The target is the peaks of the parallel channel, confluence with the fib extensions targets:
- 1.414
- 1.618
Last Rally for Cycle Wave V (five) topping around Nov/Dec 2025 being a blow off top.

RNDR | BULLISH ALTS | RNDR Incoming ATH Render has been one of my top alts since Jan 2024, and it hasn't disappointed, currently standing at 140% increase, and if you account for the ATH in March, 245%.
As Bitcoin trades range we're patiently waiting for Ethereum to make a new ATH. This will encourage the rest of alts to make a final push up, that is AFTER ETH made a new ATH. That's why it's so important to watch Ethereum, and the Bitcoin dominance chart.
More on that topic HERE:
____________________
GEMINI:RNDRUSD

Symmetrical triangle/invh&S on render breaking abve toptrendlineNo guarantee that it confirmed the breakout on the first break above the pattern here, but the way the market has been moving lately thee is a high probability it will. *not financial advice*

$RENDER prepares for growthThere is already a consolidation above the 50 EMA, on a Fibonacci level I would expect a price around 1.618 ($20). Meta AI is starting, Render is one of the big projects in this area. I wish everyone good luck!
Horban Brothers.

Long-Term Accumulation Opportunity in RNDRUSDTI would like to share a long-term accumulation strategy for RNDRUSDT that I've been eyeing.
Chart Patterns and Indicators:
Descending Channel: The price is currently moving within a descending channel, indicating potential breakout opportunities.
Harmonic Pattern (XABCD): The pattern suggests potential reversal points at identified accumulation zones.
Volume Analysis: Increased volume at support levels indicates strong buying interest and validation of accumulation zones.
Current market sentiment shows a mix of consolidation and potential bullish reversal, supported by the harmonic pattern and volume spikes at lower levels.
This long-term accumulation strategy for RNDRUSDT focuses on systematically entering positions at identified support levels and distributing at key resistance points. This methodical approach aims to capitalize on both the technical patterns and market sentiment, ensuring a balanced risk-reward ratio.
Additional Details about Render Token (RNDR):
Market Cap: Approximately $3.92 billion
Fundamentals: Render Token is a decentralized GPU rendering network that connects artists and studios needing GPU compute power with mining partners willing to rent their GPU capabilities.
Potential: High demand for GPU rendering in the fields of VR, AR, and complex 3D modeling.
Text Help by GPT :P, trust me he is way better at words!

Alt coins ready to run ANKR, BAT, LINK, RNDR, DOT, LTC, LRC, ETCThis market is great for trading trend lines, look at this chart as an example, the two thick dark purple likes. The short one represented resistance for about 5 months, we finally broke that resistance and we broke out, we ran to top of what had been resistance for about 18 months, we had a small hiccup in both places and the break out from that trend line lead to XLM running virally, up to 65% in one day.
Every day there are may assets reaching towards a break out point, and that's what I try to look for. I start on 1 day charts and then come down to a 4h or 1h candle, really no since in going to a shorter candle unless you are looking for precision entry. The main thing to take away from this is that when an asst breaks a resistance it tends to run, many times first coming down and proving that line to be support instead of resistance, then taking off, sin any case, the break of a trend line is generally a fuse lit for a run. The longer the resistance, the more times its resisted and then it breaks out, the break out tends to be stronger.
Here are some alts i have been watching that seem to be staging breakouts or possibly in an early stage of the breakout.
I like ENJ, ANKR, BAT, LINK, RNDR, DOT, 1INCH, mostly these are midcap, but they have started to break out from recent trends.
I kind of like LTC, LRC, ETC, ATOM, BNT, MASK, MPL. Higher risk, but they have staged a breakout and most of these have lower marketcap so easier for them to get pushed further.
Lots of other coins nearing some breakout points as well, they seem to be coming in waves with each day throwing us some 20,50, even 100% gains some times.
I will try to post another update of break outs soon but in between all the trading and working to try to make my ai tech startup do something, my time is short. That also can lead me to evaluate things too quickly sometimes so don't just take what I say as a trigger to pull, use it as a flag to get your interest in evaluating these things yourself.
The market is very bullish right now and there is a lot of opportunity to make nice gains and also to lose a lot buying the dead end of a recent run. Be vigilant.

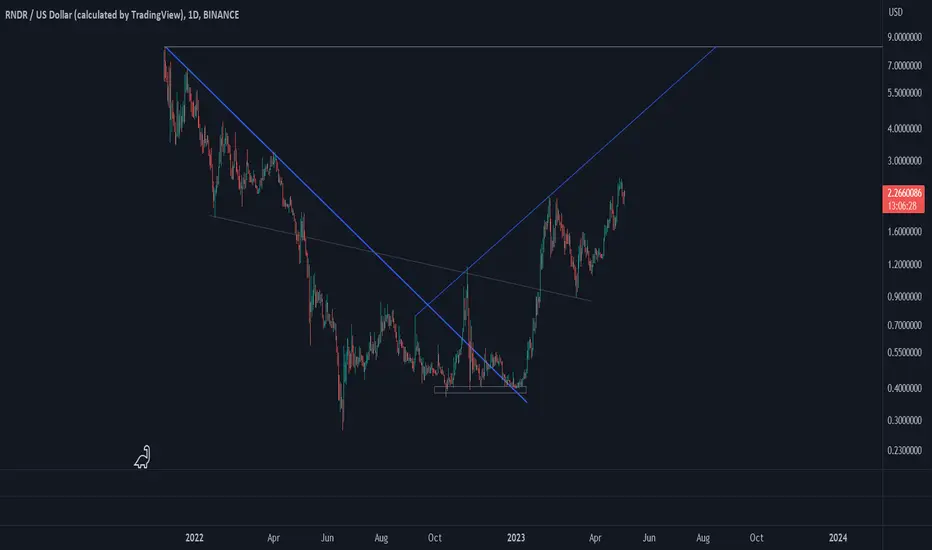
Render Token (RNDR)Render Token is an innovative project of sharing GPU computing power for consumers such as artists and graphic designers. At first, like many projects, RNDR price went down. After the downward move ended and price broke the downtrend line, an impulse upward wave started and price value increased significantly. It is possible an inverted harmonic pattern is forming; have to wait for the price to reach the previous highest high (horizontal line).
RNDR Long Position (Accumulation Phase)Market Context: RNDR has been through an extended markdown phase, with market makers taking profits, driving prices down to fair value. Now, the market appears to be in an accumulation phase, where most of the weak hands have exited. This creates an opportunity for strategic entry, positioning for the next bullish move.
Trade Setup:
Entry: $4.70 - $5.30
Take Profit:
First target: $6.30
Second target: $7.50
Third target: $9.00
Stop Loss: Daily close below $4.50
This trade aims to capitalize on the potential accumulation phase as RNDR prepares for a possible move higher. #RNDR #Crypto #Accumulation #PriceAction #Trading

9/28 Huge trend reversal. Bullish on crypto. Overview:
Both the AMEX:SPY and NASDAQ:QQQ closed with red candles, yet neither index dropped below the previous day's low. This, coupled with low trading volume, suggests the current price levels may hold for a while. Both indices display bearish divergences on the MACD histogram and lines, signaling potential weakness.
The Federal Reserve reported August’s core PCE at 2.7% y-o-y, aligning with expectations and slightly up from July's 2.6%. Speculation surrounds whether rate cuts are fueling inflation, though typically, it takes months for such measures to impact the economy. Next year’s CPI and PPI readings will be crucial.
ETF funds have been on a buying spree for seven consecutive days, with September 27th seeing record-high volumes—five times the average.
Bitcoin Technical Analysis:
W: BINANCE:BTCUSD remains above the Bollinger Bands’ MA, in line with the yearly bull-run volume point of control. After two months of bearish sentiment, signs of a trend reversal are emerging. Resistance is at $67.5k. Bullish.
D: BTC broke above $64 k on Thursday and has held above this key level. However, RSI is now at 66.57, approaching overbought territory.
4h: RSI is overbought at 73.28, showing a double peak. MACD’s bearish crossover suggests a pullback to support levels at $65.2k or $64.4k. We expect either a pullback or sideways trading, allowing the MA to catch up. Bearish to neutral.
1h: The lower timeframes indicate BTC is undergoing a correction phase. Neutral.
Altcoins Relative to BTC:
No major divergences are observed. Unlike BTC, ETH and SOL have yet to reach their previous August 25th highs. Newer alts like SUI, TAO, and NEAR have surpassed their highs, showing strong performance.
Bullish Scenario:
With BTC holding above GETTEX:64K on the weekly chart, a bullish outlook is more plausible. Global rate cuts may inject liquidity into speculative assets, boosting crypto prices.
Bearish Scenario:
There’s a risk that the current rally is a bull trap, with a potential sharp reversal.
Fear and Greed Index:
The index is at 56.67, nearing the “greedy” zone, indicating growing optimism.
Prediction:
BTC may correct to $64 k before resuming its rally, with the next target being $67k.
Opportunities:
Bearish: BNB is at monthly resistance, with MACD bearish divergence. NEAR, RNDR, TAO, FTM, and UNI have hit weekly resistance levels, suggesting potential trend reversals. FTM and UNI still haven’t completed their corrections, and MACD divergences may appear over the weekend.
Bullish: AR has rebounded from its weekly support level, indicating a strong recovery.

9/24 Markets on Edge: Is the Bull Run Here to Stay?Overview:
It might seem like the markets have been rallying for the last four trading days, following the recent interest rate cut. The AMEX:SPY formed a bullish spinning top candlestick pattern on Friday and Monday, followed by another green candle on Tuesday. We remain in a bullish trend with no clear signs of reversal. However, it's worth noting that we still haven’t reached a new all-time high and haven't posted a solid green candle engulfing previous ones. The AMEX:SPY hasn’t even surpassed the highest trading price recorded last Thursday. Essentially, we're hovering at the market's peak, deciding whether to kick off a new bull cycle or face a potential downturn.
NASDAQ:QQQ also closed positively, but the candlestick pattern is similar to SPY. On Tuesday, the Federal Reserve reported the S&P Case-Shiller Home Price Index, which tracks housing price increases in 20 major U.S. cities. While housing is still appreciating, it’s doing so at a slightly slower pace than anticipated. In July, it rose by 5.9% year-over-year, compared to an expected 6% and the previous reading of 6.5%. The primary driver of home prices is borrowing costs, particularly reflected in mortgage rates. Typically, a 1% increase or decrease in mortgage rates correlates with a 10% change in property values. As interest rates decrease, so do mortgage rates, influencing home prices.
Average 30-year fixed mortgage rates dropped from 7.22% in May to 6% in mid-September, translating to a 12.2% increase in housing prices. Therefore, the Case-Shiller Index could see a significant rise, especially if the Fed cuts rates twice more by year-end.
The Consumer Confidence Index, distinct from the Michigan Consumer Sentiment Index, also dropped to 98.7 in September, nearing the bottom of its narrow range over the past two years. This is the steepest decline since August 2021, with all five components of the index deteriorating. Consumers’ views on current business conditions and the labor market have turned negative. Additionally, expectations for future labor market conditions, business conditions, and income have all worsened. While this drop is significant, it’s not as severe as during the Dotcom Bubble or the Subprime Mortgage Crisis.
Fidelity and Bitwise are slowly dipping their toes into the BTC ETF market, while Grayscale and BlackRock remain on the sidelines. The ETH ETF remains untouched. It’s possible that the recent surge in buying is driven by retail investors. We might need to reconsider the importance of ETF metrics, as they’ve become just another market participant without any apparent insider knowledge. For instance, BlackRock made its largest BTC ETF purchase between February 27th and March 14th when BTC's price ranged from $51K to $73K. On March 12th, they purchased $849 million worth of BTC at a closing price of $71.4K, leaving them in a loss since then.
Weekly : This week’s BINANCE:BTCUSD candle is above the Bollinger Band moving average, but it’s still intersecting the $64 k weekly level. If this price holds, it could signal a major bullish trend. For now, it’s still leaning bearish.
Daily : Tuesday’s price action pushed us above the weekly $64 k level. The daily candle appears stronger compared to the previous four spinning tops. RSI is approaching overbought territory but hasn’t crossed the 70 mark, and there are no MACD divergences.
4-Hour : The bearish MACD divergence persists, now visible in RSI as well. Three consecutive candles are holding above $64K. Lower timeframes will reveal how many attempts were made to break this level and if previous resistance has turned into support. The price is at the top of the Bollinger Bands.
1-Hour ): On Tuesday, September 24th, at 10 AM, there was a decisive candle indicating an unsuccessful attempt by American bears to break the $62.9K level. The VR VP point of control is precisely at this level, with significant bullish buy orders absorbing the selling pressure. Volume nearly doubled to 1.1 million on Coinbase, compared to an average of 278k. Subsequent candles showed higher volume and a higher low. Once the selling pressure was absorbed, the price began to rise and broke the resistance level. Since the breakout, the price has tested the old resistance level three times but successfully rebounded, closing higher above the Bollinger Band moving average.
This breakout was confirmed by a CVD (Cumulative Volume Delta) bullish divergence, available on TradingView. It shows the difference between buying and selling pressure in the market, especially on the 1-hour timeframe. During the 10, 11, and 12 AM candles, a higher low was formed compared to the previous price low, but the CVD indicated a lower low. This suggests that even with immense selling pressure, buy orders were absorbing the sell orders, pushing the price higher.
Alts Relative to BTC:
While major market indices and BTC might appear flat and indecisive, altcoins are experiencing explosive growth. Since the rate cut, the following alts have surged:
TAO: +70% SUI: +50% APT: +37% NEAR: +30% RNDR: +30%
Alts had ample room for growth as many collapsed faster than BTC. In early September, SUI and NEAR reached their "BTC ETF approval" price levels from January 10th, while APT hit its 2023 bottom price. It still has another 9% to go before reaching its BTC ETF price.
Bull Case: BTC holds $64 k, all selling pressure is absorbed, and liquidity floods the market, especially after China joined the rate-cutting spree, reducing their rate from 2.3% to 2.0%.
Bear Case: It could all be one big bull trap, with deeper economic issues globally leaving people with less disposable income to gamble on speculative assets.
Fear and Greed Index: 52.83. Increasing but still in the neutral zone. There's a notable divergence: check the Fear and Greed Index chart on CoinMarketCap. The last two lows were on August 5th and September 6th, yet BTC posted a higher second low, indicating irrational fear in the market. Keep an eye on this divergence for future reference.

9/23 Crypto Faces Gloomy October.Overview:
The AMEX:SPY closed higher last week, but Thursday’s candlestick pattern resembles a bearish abandoned baby. What’s more concerning is the weekly chart showing a bearish MACD divergence—while the price keeps hitting all-time highs, both the MACD and signal lines are trending lower. Has this divergence played out already, as seen in the first week of August, or is it still ahead of us?
You may have noticed that we only have two more rate cuts left for the year. Why not three, with three months remaining? The Federal Open Market Committee (FOMC) meets only eight times a year. There’s no meeting in October to give time for economic analysis and to avoid overreacting to short-term fluctuations. Conveniently (for bears), September and October are typically weak months for markets. Remember, FTX collapsed in November 2022, bottoming out the crypto market in November-December.
The next FOMC rate cut is expected on November 7th, leaving BINANCE:BTCUSD bulls on their own for the next 44 days. However, this cut is not guaranteed. If inflation remains high or increases, the cut could be postponed. Rate cuts are a quantitative easing tool used to support a slowing economy—not one that’s running at full speed. This Friday, the FED will release the PCE index, which could influence their decision. The CME FedWatch Tool currently shows a 55.2% chance of a one-basis-point cut and a 44.8% chance of a two-basis-point cut.
In recent letters, we suggested a price increase in late September. Now might be the time to take some profits and wait to see if we can break resistance and establish a new bull trend, or if this is the peak before a downturn.
Weekly:
BTC closed the week with a strong green candle, slightly above the Bollinger Band Moving Average (BB MA) but still below the highs of late August. The trend remains bearish.
Daily:
We’re overdue for a correction back to the BB MA, with targets at $61.4k and $60k. The price is hovering around the major resistance level of GETTEX:64K , which is also a key monthly level. The last three days have formed three consecutive dojis, indicating market indecision after 15 days of bullish momentum. Breaking this resistance without first testing the $61.4k support is unlikely.
4-Hour:
Weekend price action shows BTC reaching its peak between Thursday and Friday night, pulling back by 2.6% before U.S. bulls prevented further losses. Despite pushing higher on Sunday, Asian bears applied pressure again. Bearish divergence between the price peaks and the MACD-signal line suggests a potential downturn.
1-Hour:
At 10:00 a.m. NYC time, BTC posted a big green candle, supported by strong U.S. buying. However, since Monday midnight, the price has been dropping, while the Cumulative Volume Delta (CVD) line remains green and positive. This indicates that despite strong buying pressure, hidden sell orders are absorbing the demand, suggesting:
Absorption by Sellers: Large sell orders are preventing the price from moving up.
Distribution Phase: Larger market participants may be offloading positions while smaller traders buy, creating an illusion of demand.
Potential Reversal: This could signal a potential reversal if the selling pressure eases.
Altcoins Relative to BTC:
ETH has outperformed BTC, along with NEAR, TAO, APT, AR, RNDR, and AAVE. SUI, BNB, and FTM showed weaker pumps, while SOL appeared the weakest.
Bull Case:
If the Fed’s two-basis-point cut doesn’t lead to higher inflation and jobless claims continue to rise, it could boost speculative assets. Other central banks around the world may follow suit, increasing global M2 money supply.
Bear Case:
Until the next Fed rate cut, there’s little to support BTC’s current price against bearish pressure.
Fear and Greed Index:
Currently at 50.64—neutral sentiment.
Overall, the market remains in a delicate balance, while weekly trend is still bearish.

RNDR Long Spot Position (Support Consolidation)Market Context: RNDR has been consolidating in a key area of support, providing a good opportunity to enter a long spot position.
Trade Setup:
Entry: Ladder into a long spot position in the $4.20 - $5.00 support zone.
Take Profit:
First target: $5.90 - $7.05
Second target: $9.80 - $11.00
Stop Loss: Just below $3.90
📊 This setup takes advantage of the support consolidation with defined risk and potential upside. #RNDR #Crypto #LongTrade

Is #RENDER still in a downtrend?#Render 1D chart;
Continues the downtrend that started in March with lower highs
It was last downtrending at $6.3 (CHoCH)
A close above the $7.2 level is required before we can talk about a rebound
Otherwise, the levels where it can go by making lower highs;
First OB support at $3.7
If it loses here, the IMB level will be $2.8.
Of course, although its first priority in every upward move is to overcome the previous low peak, it should not be forgotten that the downward trend line (red line) will also act as resistance.
