#XMR Just Flipped Control – Bears Are Running Out of Time
Yello Paradiser!, are you aware that #XMR has been signaling the exhaustion of its bearish cycle long before the recent breakout even occurred? The structure has been quietly transitioning from distribution into accumulation, and the market is now starting to reveal that change.
💎#XMR shows a clear deceleration of downside momentum from one descending channel into another. In Elliott Wave theory, this behavior is commonly seen during the late stages of a corrective or impulsive decline, particularly as wave 5 begins to lose strength. This structural compression strongly suggests that the downtrend was nearing completion.
💎The recent breakout from the descending channel is technically critical. Price has decisively crossed above the top of wave 4, which confirms a Change of Character (CHoCH). A bullish divergence on the RSI between wave 3 and wave 5. This is a classic confirmation of wave 5 termination and increases the probability that a trend reversal is already in progress.
💎The breakout occurred with a sharp and impulsive move to the upside, which is characteristic of a wave 1 or wave A advance. Such price behavior reflects strong demand entering the market and confirms that buyers have regained control of the short-term structure.
💎From here, two primary Elliott Wave scenarios remain valid. #XMR may be starting a new impulsive bullish cycle in the form of a 1–2–3–4–5 structure, or it may be developing a corrective ABC or WXY rally within a larger-degree bearish trend. Regardless of the macro labeling, both scenarios point toward one more strong upside expansion before any meaningful correction occurs.
💎Key resistance is located at the top of the larger-degree wave 4, around the $650 region. This level represents the natural target for the current advance and could be exceeded if the move develops impulsively. On the downside, major structural support is located near $410.
Strive for consistency, not quick profits Paradisers. Treat the market as a businessman, not as a gambler. This is the only way you will make it far in your crypto trading journey. Be a PRO💰
MyCryptoParadise
iFeel the success🌴
Rsi_divergence

Bollinger Band + RSI Divergence📉 Bollinger Band + RSI Divergence Reversal Framework
This chart demonstrates how Bollinger Bands and RSI can be combined to identify early reversal zones during extended pullbacks, instead of chasing breakdowns or reacting late.
Rather than using Bollinger Bands or RSI as standalone signals, this framework focuses on:
Price expansion into volatility extremes
Momentum exhaustion via RSI divergence
Mean-reversion behavior back toward value
This approach is designed to anticipate trend pauses or short-term reversals, not predict long-term bottoms.
📊 Key Observations
1️⃣ Volatility Context (Bollinger Band Expansion)
A potential reversal environment is defined by:
Price pushing toward or below the lower Bollinger Band
Extended movement away from the Bollinger midline (mean)
This signals volatility expansion and possible short-term exhaustion.
2️⃣ Price Structure (Lower Low Formation)
During the pullback:
Price continues making lower lows
Selling pressure appears aggressive on the chart
On its own, this looks bearish — structure alone is not enough.
3️⃣ Momentum Behavior (RSI Bullish Divergence)
The key shift occurs when:
Price makes a lower low
RSI forms a higher low
Important note:
Bullish divergence signals weakening downside momentum, not an automatic buy signal.
4️⃣ Why RSI Divergence Works Near Bollinger Bands
At volatility extremes:
Price often overshoots fair value
Momentum weakens before price reacts
RSI divergence helps identify when selling pressure is losing strength, even while price still appears weak.
5️⃣ Entry Logic (Mean Reversion Trigger)
The setup improves when:
Price stabilizes near the lower Bollinger Band
RSI starts moving back toward its average (30 → 40+)
Price begins reclaiming short-term levels
Bollinger Bands define where price is stretched.
RSI helps time when momentum shifts.
📊 Chart Explanation
Symbol: NSE:BAJFINANCE
Timeframe: 2H
This chart highlights:
Price trading near the lower Bollinger Band
A lower low forming in price
RSI forming a higher low (bullish divergence)
Early stabilization suggesting momentum exhaustion
Expected sequence:
Volatility expansion → Price overshoot → Momentum divergence → Stabilization → Mean reversion
Bollinger Bands highlight extremes.
RSI confirms momentum shift.
📘 How to Use This Framework Effectively
Context First
Best used after extended downside moves
Avoid using during strong, accelerating downtrends
Entry Guidance
Wait for price to stop expanding outside the band
Let RSI turn upward from divergence
Use price reaction as confirmation
Risk Management Tip
Stops should be based on price structure, not RSI
This is a timing tool, not a trend filter
Common Mistake
Using every RSI divergence blindly
Correct approach: combine divergence with volatility extremes
⚠️ Disclaimer
For educational purposes only
Not SEBI registered
Not financial or investment advice

Bearish Divergence Playing Well!KSE100 Closed at 182338.12 (29-01-2026)
Bearish Divergence played well. Also there is Bearish Divergence in volumes.
Immediate Support seems around 179500 - 181000
Weekly Closing above blue trendline may bring some positivity in upcoming week.
Index still has the potential to touch 195,000 - 200,000 & then 210,000 but only
if it Crosses & Sustains 190000 -191500 with Good Volumes.

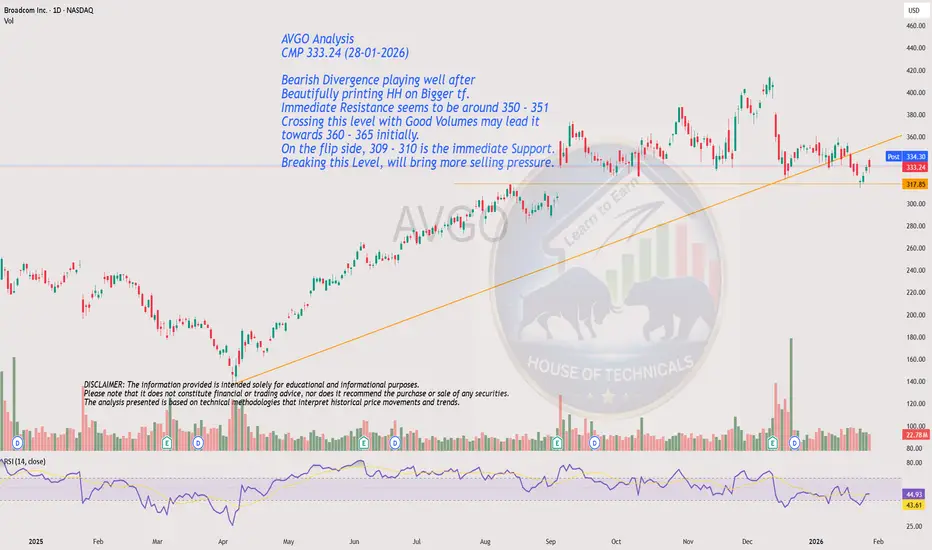
Beautifully printing HH on Bigger tf.AVGO Analysis
CMP 333.24 (28-01-2026)
Bearish Divergence playing well after
Beautifully printing HH on Bigger tf.
Immediate Resistance seems to be around 350 - 351
Crossing this level with Good Volumes may lead it
towards 360 - 365 initially.
On the flip side, 309 - 310 is the immediate Support.
Breaking this Level, will bring more selling pressure.
Bullish Divergence appearing on bigger tf.MASK Analysis
CMP 0.2395 (27-01-2026)
Bullish Divergence appearing on bigger tf.
It seems safe as long as it stays above 0.1750
Crossing 0.5148 wiht Good Volumes & Sustaining
this level may initiate aggressive move towards 2.

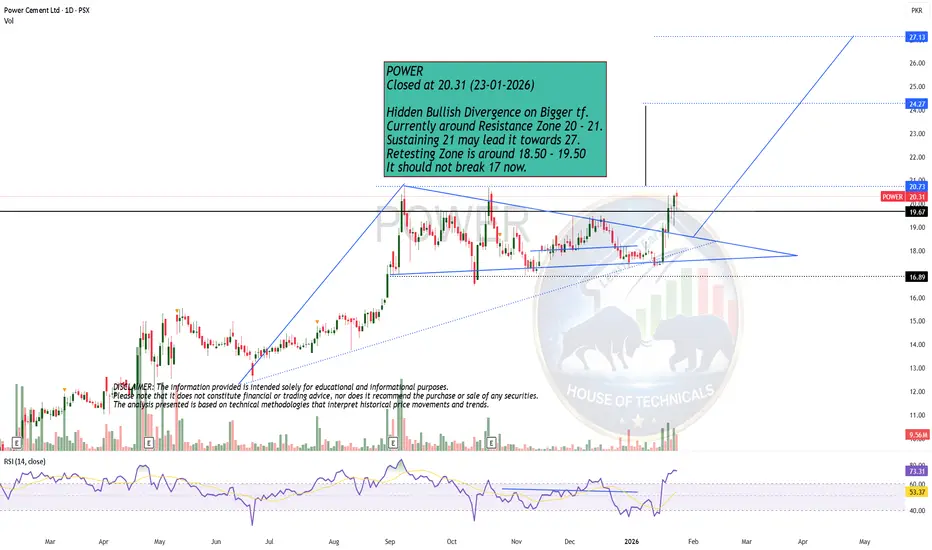
Hidden Bullish Divergence on Bigger tf.POWER
Closed at 20.31 (23-01-2026)
Hidden Bullish Divergence on Bigger tf.
Currently around Resistance Zone 20 - 21.
Sustaining 21 may lead it towards 27.
Retesting Zone is around 18.50 - 19.50
It should not break 17 now.
I backtested over 1,000 Delta-RSI combinations on BTCDelta-RSI is a widely used momentum strategy on TradingView, particularly in its filtered variants.
Rather than evaluating it through a single backtest or relying on default settings, I tested the strategy by exploring its parameter space more broadly.
For this run, I swept 1,080 Delta-RSI parameter combinations on BTCUSDT (1D). Parameters varied included RSI length, signal smoothing, polynomial order, volume filter period, and long/short logic, all within reasonable, non-extreme ranges. The goal was not to find a single “optimal” setup, but to understand how performance behaves as assumptions shift slightly.
Best-Performing Configurations (by risk-adjusted outcomes)
Below are the three most balanced configurations observed during the sweep, selected for a combination of return, drawdown, and consistency rather than headline profit alone:
1)
RSI Length: 21
Signal Length: 6
Polynomial Order: 3
Length (> Order): 45
Avg. Volume Over Period: 50
Long: true
Short: false
Profit: +82.42%
Max Drawdown: −20.68%
Win Rate: 46.4%
Profit Factor: 1.62
Trades: 138
2)
RSI Length: 14
Signal Length: 6
Polynomial Order: 3
Length (> Order): 40
Avg. Volume Over Period: 10
Long: true
Short: false
Profit: +79.85%
Max Drawdown: −15.86%
Win Rate: 51.5%
Profit Factor: 1.62
Trades: 138
3)
RSI Length: 14
Signal Length: 6
Polynomial Order: 3
Length (> Order): 40
Avg. Volume Over Period: 30
Long: true
Short: false
Profit: +79.85%
Max Drawdown: −15.86%
Win Rate: 51.5%
Profit Factor: 1.62
Trades: 138
These configurations form a small cluster of relative stability, but even within this cluster, performance remained sensitive to modest parameter changes. Nearby configurations often produced meaningfully different drawdown profiles despite similar profitability.
The takeaway is less about Delta-RSI specifically and more about strategy evaluation in general. Single backtests can be misleading. When examining the full distribution of outcomes, parameter fragility becomes much harder to ignore, and apparent performance often depends more on tuning than on structural robustness.
I’m documenting these tests to better understand the difference between headline performance and true stability when evaluating commonly used TradingView strategies.

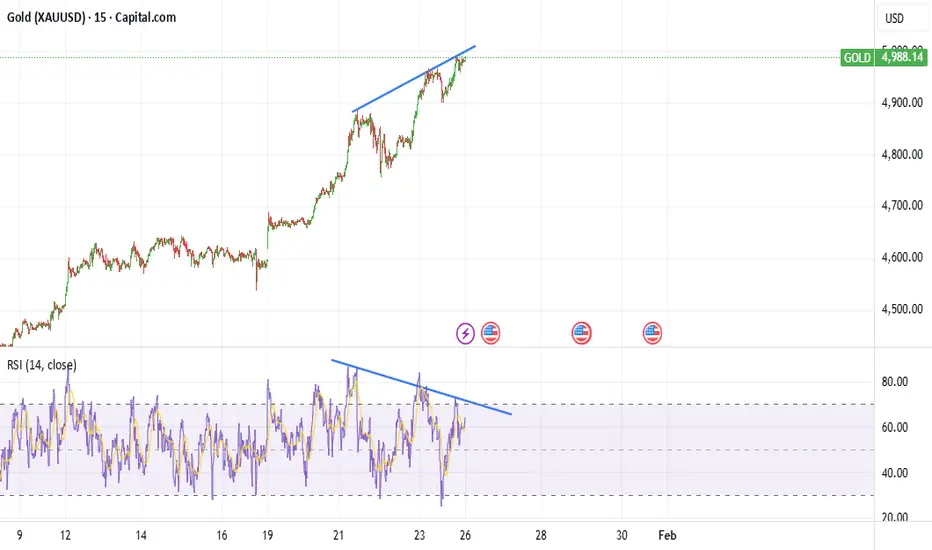
Gold (XAUUSD) – 15m Bearish RSI Divergence at 5000 | ABCDGold (XAUUSD) is trading near the 5000 psychological resistance, where a higher timeframe ABCD pattern is completing.
On the 15-minute timeframe, price is making higher highs while RSI shows clear bearish divergence, confirmed across multiple timeframes (15m, 30m, 45m & 1H).
This divergence indicates momentum exhaustion, increasing the probability of a short-term pullback or rejection from the 5000 zone.
🔴 Sell Zone: 4990 – 5010
🛑 Invalidation: Sustained move above 5035
🎯 Targets: 4945 → 4900 → 4850
📌 Higher timeframe ABCD structure adds strong confluence to this setup.
⚠️ Use proper risk management. This idea is for educational purposes only.
Important Level??RSI Divergence appearing on shorter tf.
a bounce is expected from this Zone 180000 - 180600

USDJPY M15 RSI Divergence and Short-Term Pullback Setup📝 Description
FX:USDJPY has extended into a local premium zone after a strong impulsive rally. Price is holding near recent highs, but momentum is slowing as RSI shows clear bearish divergence, suggesting exhaustion rather than continuation.
________________________________________
📈 Signal / Analysis
Primary Bias: Bearish while price holds below the recent high and RSI divergence remains valid
Preferred Setup:
• Entry: 158.90
• Stop Loss: Above 159.11
• TP1: 158.67
• TP2: 158.50
• TP3: 158.30 (H1 FVG / liquidity draw)
________________________________________
🎯 ICT & SMC Notes
• RSI bearish divergence indicates weakening bullish momentum
• Price trading in premium after impulsive expansion
• Pullback expected toward nearby FVGs
________________________________________
🧩 Summary
Despite the strong upside move, momentum divergence suggests limited continuation. As long as price fails to push higher with strength, a corrective pullback toward lower PD arrays is favored.
________________________________________
🌍 Fundamental Notes / Sentiment
With key US CPI data today, volatility risk is elevated. Any positioning should be approached with strict risk management, as CPI outcomes can trigger sharp, two-sided moves before direction is confirmed.
________________________________________
⚠️ Risk Disclosure
Trading involves substantial risk and may result in capital loss. This analysis is for educational purposes only and does not constitute financial advice. Always apply proper risk management, predefined stop-loss levels, and disciplined position sizing aligned with your trading plan.

BTCUSD (15m) — Bullish RSI Divergence 📈 BTCUSD (15m) — Bullish RSI Divergence Signals Momentum Shift
Timeframe: 15m
Market: BTCUSD (Bitstamp)
Indicator: RSI
🧠 Idea Overview
BTC printed a clear bullish divergence on the 15-minute chart, suggesting selling pressure was weakening despite lower price lows. This divergence preceded a strong upside reaction, highlighting a potential local trend reversal / continuation higher.
🔍 What We’re Seeing
Price made a lower low (highlighted by the descending trendline on price)
RSI made a higher low (ascending trendline on RSI)
This creates a classic bullish divergence
RSI held above the extreme oversold region, signaling bear exhaustion rather than panic selling
At the same time, price reclaimed short-term structure and expanded upward with momentum, confirming the divergence.
✅ Confirmation Factors
RSI turned up and crossed back above its signal / mid-range
Strong bullish candles followed the divergence
Volume expanded on the move higher
No immediate acceptance below the prior low (failed breakdown)
This confirms the divergence was actionable, not just theoretical.
❌ Invalidation
This bullish thesis would have been invalidated if:
Price accepted below the prior swing low
RSI broke down and made a new lower low
The bounce failed to reclaim local structure
None of those occurred — instead, price accelerated upward.
🎯 Takeaway
Bullish divergences work best:
After a pullback in an overall bullish context
When paired with structure reclaim or momentum expansion
As early warning signals, not standalone entries
This setup was a good example of momentum shifting before price.
⚠️ Reminder
Divergences do not call exact bottoms — they highlight probability shifts. Always combine with structure, trend context, and risk management.

RSI and MACD TogetherRSI and MACD are often paired together under the idea of confirmation. If both indicators point in the same direction, the trade feels safer. In practice, this combination frequently creates confidence without clarity. The reason is simple. Both indicators are derived from the same source, price, and they often respond to the same information at different speeds.
RSI reacts relatively quickly to changes in momentum. MACD responds more slowly, smoothing price action to highlight broader momentum shifts. When traders wait for both to align before entering, they are often reacting to a move that has already unfolded. The result is late entries, compressed risk-to-reward, and increased sensitivity to pullbacks.
Confluence adds value only when each tool is assigned a clear role. RSI can help assess the current momentum environment, showing whether price behavior supports continuation or suggests slowing participation. MACD can help keep traders aligned with the dominant swing, reducing the urge to exit positions prematurely during normal retracements. Used this way, the indicators support decision-making rather than replacing it.
The combination becomes misleading when it is used to anticipate reversals. Divergences lining up across RSI and MACD feel powerful, but they often appear multiple times during strong trends. Momentum can weaken and reaccelerate without price structure ever breaking. Traders who act on indicator-based anticipation usually enter before the market has resolved its internal balance.
Another issue is redundancy. When both indicators are used to trigger entries, they rarely provide independent information. Agreement between them does not necessarily increase probability. It often just reinforces an interpretation the trader already wants to believe.
RSI and MACD work best after structure and location are established. When price has already shown intent, indicators can help manage timing, confidence, and trade duration. When used in isolation, they tend to encourage reaction instead of understanding.

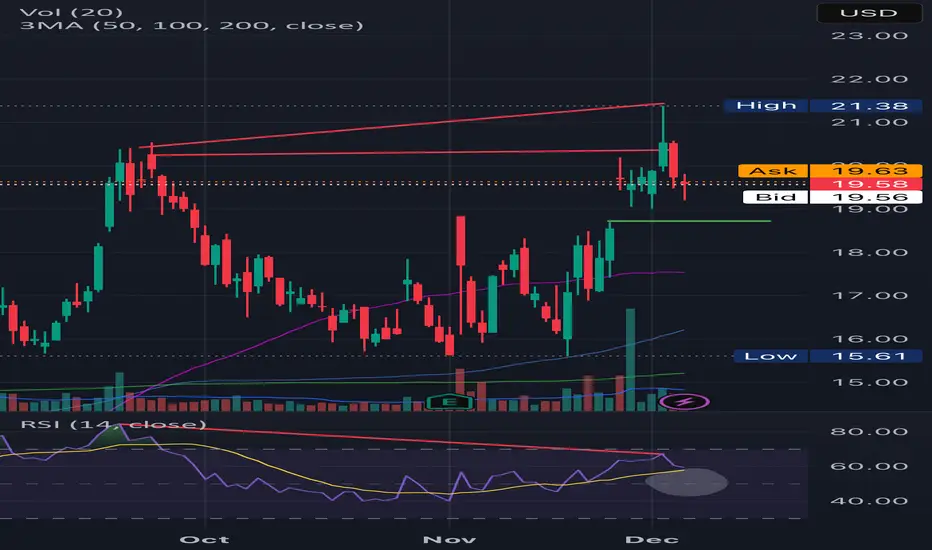
Bullish DivergenceSMCI Analysis
Closed at 30.16 (09-01-2026)
No clear Trend but there is a Bullish Divergence on daily tf.
A slight upside is expected if 28 is not broken;
35 - 36 should be touched once if 28 - 29 is sustained.
The Upside may continue if 35 - 36 is crossed with Good Volumes.

DJI M30 RSI Reset and Bullish Mean Reversion Setup📝 Description
Dow Jones on M30 is still trading inside a bullish HTF context. After the recent corrective drop, RSI has fully reset and is now sitting in a zone that historically aligns with price reversals to the upside. This tells us downside momentum is exhausted and the market is getting ready for a bounce.
________________________________________
📈 Signal / Analysis
Primary Bias: Bullish while holding above 48,800
Long Setup (Preferred):
• Entry (Buy): 48,820 (HTF FVG)
• Stop Loss: Below 48,750
• TP1: 48,930
• TP2: 49,075
• TP3: 49,230
________________________________________
🎯 ICT & SMC Notes
• RSI in reset / reversal zone
• Corrective move, not impulsive selling
• Price holding near HTF FVG support
________________________________________
🧩 Summary
With RSI showing exhaustion of sellers, the market looks ready for an upside rotation. As long as price remains above the current support, the probability favors a bullish continuation toward higher liquidity levels.
________________________________________
🌍 Fundamental Notes / Sentiment
Strong ISM Services supports economic strength and favors upside in the Dow. Softer JOLTS does not challenge the bullish trend, with pullbacks likely offering continuation opportunities.
________________________________________
⚠️ Risk Disclosure
Trading involves substantial risk and may result in capital loss. This analysis is for educational purposes only and does not constitute financial advice. Always apply proper risk management, predefined stop-loss levels, and disciplined position sizing aligned with your trading plan.

DAM Capital Base Formation After Correction Risk Reward SetupTechnicals:
Trading in a broader sideways to range-bound structure after a sharp correction earlier in the year following that decline, the stock has spent time absorbing supply and recently found strong support in the ₹205–212 zone. The latest bounce from this area has formed a short-term higher low on the daily chart, indicating improving price stability rather than fresh selling pressure.
Price is currently hovering around ₹219–222, with the EMA flattening and price attempting to hold above it. This suggests a transition from a weak phase into base formation. structurally, the stock is moving toward a descending trend-line zone around ₹255–265, which aligns with a prior supply area. This zone is likely to act as the first major reaction area. From a risk-reward perspective, the setup favors a controlled pullback trade, with upside potential toward ₹275–300, while downside risk remains protected around ₹190, which marks the last strong demand and structure invalidation zone.
Momentum is also improving. RSI has recovered from oversold conditions and is now sustaining above the 50 level, pointing toward a shift from bearish to neutral-to-positive momentum. As long as price holds above the ₹212 support band, the bias remains constructive for a measured upside retracement toward higher resistance.
Fundamentals:
Operates as a financial services and investment banking firm, with revenues closely linked to capital market activity, deal flow, and overall market sentiment. after a strong listing and initial enthusiasm, the stock corrected sharply as market expectations normalized and broader mid-cap financial stocks saw valuation compression.
fundamentally, the business remains sensitive to equity market cycles, IPO activity, and advisory volumes periods of consolidation or lower market participation tend to reflect in muted earnings visibility, which explains the prolonged sideways movement in price however, as market activity stabilizes and risk appetite improves, earnings can recover relatively quickly due to the asset-light nature of the business.
At current levels, the stock appears to be transitioning from expectation reset to valuation discovery. The recent stabilization in price near long-term support suggests that downside risk is being gradually priced in, while the market waits for clearer earnings consistency and deal momentum. Any pickup in capital market activity, stronger quarterly numbers, or improvement in advisory pipeline could act as a catalyst for a re-rating, which would align with a breakout attempt above the descending trend-line on the chart.
Levels to watch
Support zone: ₹205–₹212
Risk protection / invalidation: ₹190
First reaction zone: ₹250–₹255 (trend-line and supply confluence)
Upside extension targets: ₹275–₹300
Like, comment your thoughts, share this post
Explore more stock ideas on the right hand side!
Disclaimer: This post is for educational purposes only and should not be considered a buy/sell recommendation.

Fast Reversal Setup | Price: 62.68 → Target: 65.81 (+5%)
After the recent lawsuit-related news, LRN dropped sharply from $155 → $62 and is now deep in the oversold area 📉🔥
Volume Signal 📊
This week’s traded volume is higher than anything since its IPO, which often marks a reversal zone.
Repeated Patterns 🔍
Across the daily, weekly, and monthly intervals, the stock is showing its typical reversal pattern, matching previous bounce cycles.
Entry: 62.68
Target: 65.81
Profit: +5% 💰⚡
DXY: Bearish Divergence and Its Impact on Risk Assets
This chart tracks the daily price of DXY , revealing key technical and macro dynamics relevant for traders and investors in risk-on markets.
The DXY has approached a major horizontal resistance level near 100.2, a zone that previously acted as both support and resistance.
While price tests this resistance, the RSI shows a classic bearish divergence, DXY has made higher highs on price, but RSI has failed to confirm new momentum highs. This gap signals underlying exhaustion, suggesting that further upside for the dollar may be limited in the near term.
A falling DXY signals easier liquidity and can catalyze rallies in riskier asset classes. Traders often watch DXY movements for clues on when to deploy capital into stocks or crypto.

Fast Bounce Setup | Price: 3.61 → Target: 3.79 (+5%)Fundamentals 📊
STKL shows improving revenue and margin forecasts, indicating gradual recovery.
Even though long-term movement has been unstable, the short-term fundamental outlook supports a bounce.
Repeated Behaviour 🔍
Historically, STKL has shown a clear behavioural pattern:
after deep pullbacks or oversold conditions, it regularly produces 5%–1000% bounces before stabilizing.
Today’s setup matches those previous repeated cycles.
Volume & Price Action 🔥
Recent volume activity suggests seller exhaustion and early accumulation.
Price is sitting exactly in a zone where STKL has shown multiple fast rebounds in the past.
Entry: 3.61
Target: 3.79
Profit: +5% expected 💰⚡

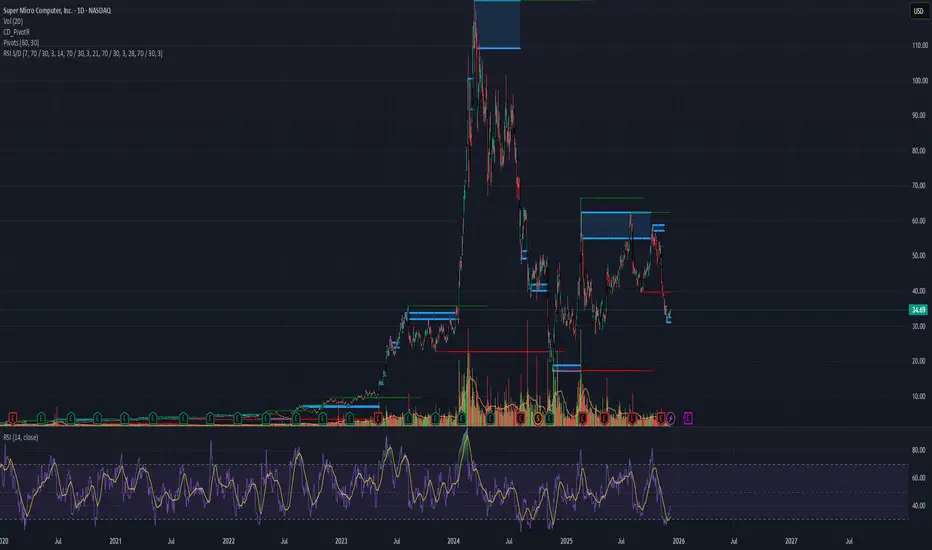
Fast Bounce Setup | Price: 34.69 → Target: 36.42 (+5%)Fundamentals 📊
SMCI continues to show strong revenue and profit forecasts, supported by growing demand in AI servers and high-performance computing hardware.
The long-term outlook is strong, which also supports short-term bounce setups.
Repeated Behavior 🔍
Historically, SMCI has shown a clear behavioral pattern: after sharp pullbacks or oversold phases, it typically produces 5%–50% bounces before stabilizing.
The current structure matches those previous behavior cycles.
Price Action 🔥
Recent volume spikes and the pullback zone align with previous SMCI reversal phases.
Price is reacting at a familiar technical level where the stock has shown fast rebounds.
Entry: 34.69
Target: 36.42
Profit: +5% 💰⚡
This setup is based entirely on the repeated behavioral pattern of SMCI itself.
Each stock has its own cycle — we do not use one fixed formula.
All signals come from pure behavior analysis.
#BehaviorBasedTrading 🔍📈
Gold 4H: Bearish Scenario
Price is riding a clean rising trendline from the October lows, connecting multiple higher swing lows.
A break and retest of this blue trendline would signal fading momentum and open the door for a deeper correction toward horizontal support.
🧱 Why 3,947 is strong support
3,947 marks the previous consolidation base where buyers stepped in aggressively after the last sharp sell‑off, turning it into a clear demand zone.
It also aligns with the last major 4H swing low, so many stop‑losses and resting buy orders are likely clustered there, making it a natural magnet if the trendline fails.
📉 Bearish divergence
While price made higher highs on the 4H chart, the RSI printed lower highs, creating a clear bearish divergence.
This divergence suggests buyers are losing strength, increasing the probability of a trendline break and a move down into the 3,947 support area before any new major leg higher.

CUP AND A HANDLE - DAILY(For some reason, my published idea chart was blank… so I’m sharing it again)
As you can see there is a cup and a handle pattern forming.
At the same time RSI showing bearish divergence a strong one from the tops, and and weak one from the bodies, and price is showing a gap.
Now simply put, I can try and snipe it by waiting for a better entry after filling the gap, and perhaps cut losses at 18.15
OR as the last red candle has been denied by buyers (denied a lower price (wick)), you can enter now but tread lightly.
To me, with current market conditions, maybe I'll buy a little position, incase it went up, and add to the position to complete a full lot size (from cost basis amount) once it fills the gap.
Remember, the target price from a text books rule says it's the cup and a handle depth but from endpoint of the handle.
But to me, I'm a little worried with current market volatilities, mostly I'll take profit before it reaches full price target.
DOT: Bullish Swing SetupIn this chart, the main focus is on the clear bullish divergence forming on the RSI, signaling a possible shift toward buyers regaining control. To find upside targets, I’ve added Fibonacci levels from recent swing highs to lows, marking key price zones where DOT could encounter resistance and potential breakout acceleration.
If momentum builds, the target is the golden ratio at $2.93, which historically acts as a strong magnet for price in retracement moves.
Another confluence is USDT.D at major resistance and soon a new fed cut will be priced in until 10th of December

How i trade This is how i trade.
Looking at AUDJPY, I want to show you step by step how i trade using volume, momentum and rsi, looking at each timeframe from the monthly to the 5 min.
