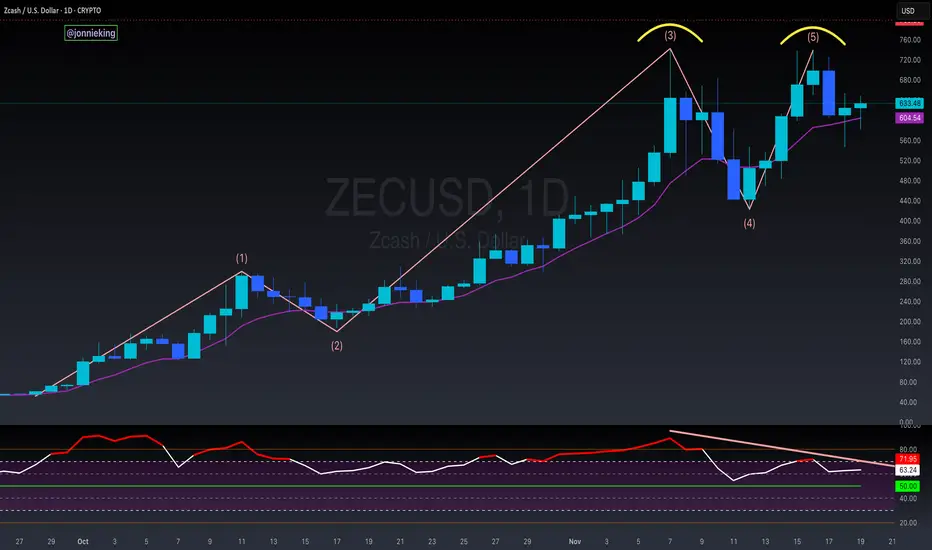
$ZEC 5-Wave Impulsive End of MoveZcash is one of those things that has thrown me off the most these past couple months.
Everything else including CRYPTOCAP:BTC has been nuking, but CRYPTOCAP:ZEC has shown insane strength.
It now appears this dino-coin is nearing the end of its run.
🚩 Double Top formed after impulsive 5-wave move.
🚩 Doji Candle followed by Bearish Engulfing on the Daily
🚩 Exaggerated Bearish Divergence on the RSI
🚩 Euphoria has been diminishing from the TL
⚠️ If it loses the 9EMA, this should confirm the next corrective wave down.
I like the ideology behind Zcash and what it offers to the market, but it has no right to be pumping with ₿itcoin nuking.
Rsibearish
CELH - From BEARS to BULLSCELH - CURRENT PRICE : 57.82
After completing a bearish reversal formation in the shape of a Double Top , the stock broke down from the neckline and entered a prolonged downtrend phase. This weakness was confirmed by the Relative Strength Index (RSI) , which stayed consistently below the 50 level, indicating persistent bearish momentum.
Subsequently, the stock established a saucer (bottom reversal) pattern , signaling a gradual shift in sentiment from selling pressure to accumulation (indicating a slow accumulation phase rather than a sharp reversal). Although there was no distinct breakout point, the gradual price recovery signaled a shift in market sentiment. This transition is supported by the RSI moving above and holding above the 50 level, suggesting strengthening bullish momentum.
Additionally, the stock has recently bounced off an internal trendline , reinforcing a "buy-on-dips" opportunity within the current uptrend. With this setup, there's an estimated upside potential of around 9% toward retesting its 52-week high, making it a favorable technical setup for short- to medium-term traders. For ICHIMOKU CLOUD traders, take note also that the share price is trading above cloud since 17 March 2025.
ENTRY PRICE : 56.00 - 58.00
TARGET : 63.00 and 69.00
SUPPORT : 52.00 (CUTLOSS below 52.00 on closing basis)
Notes : INTERNAL TRENDLINES are variations of the trendline that don't rely on extreme highs or lows. Instead, internal trendlines are drawn through the price action and connect as many internal peaks or troughs as possible. Some chartists develop good eye for this type of trendline and find them useful. The problem with internal trendlines is that their drawing is very subjective, whereas the rules for drawing of more traditional trendlines along the extreme highs and lows are more exact.
