PATH - 14.90 – The Line That MattersPATH - CURRENT PRICE : 17.42
UiPATH (PATH) – Previous Targets Achieved, Buy-on-Dips Setup After Healthy Pullback
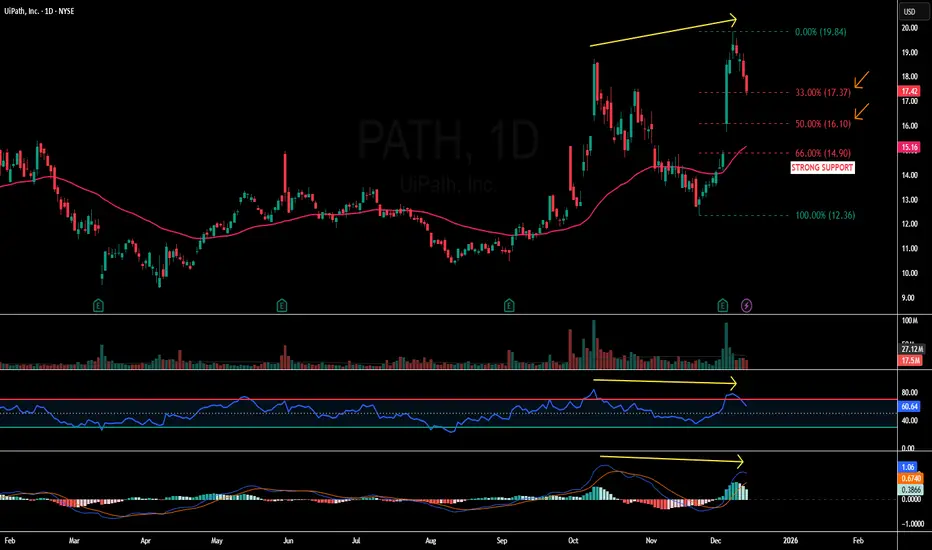
The previous technical buy call on UiPATH has successfully achieved all stated upside targets (refer to the earlier analysis via the shared link for reading context). Following this strong rally, the stock has now entered a pullback phase, which is technically expected after an extended upside move.
The current retracement is accompanied by a bearish divergence between price and momentum indicators (RSI & MACD) , as highlighted by the yellow arrows on the chart. Bearish divergence occurs when price makes a higher high while momentum indicators fail to confirm with higher highs, often signaling short-term exhaustion and a corrective move rather than a trend reversal. This explains the ongoing pullback and supports the view that the decline is corrective in nature.
From a structural perspective, the pullback remains constructive and healthy. Price has retraced approximately 33% of the prior advance, which aligns well with Dow Theory, where strong trends commonly retrace one-third or one-half before resuming the primary trend. Importantly, price continues to trade above the 50-day EMA, while both RSI and MACD remain in bullish territory, indicating that the broader bullish momentum is still intact despite near-term consolidation.
A critical level to watch is 14.90, which serves as STRONG SUPPORT. This level represents a two-thirds (≈66%) retracement under Dow Theory, coincides with a previous gap-up demand zone, and is located near the rising 50-day EMA, creating a strong confluence of technical support.
Trading Plan (Buy-on-Dips Approach):
At current levels, traders may consider initiating HALF of the intended position.
If price retraces further toward the 50% retracement level, the remaining half position may be added, as this remains a healthy pullback within an uptrend.
A decisive break below 14.90 (66% level) would invalidate the setup and should be treated as a cut-loss level.
As long as price holds above this support zone, the pullback can be viewed as a buy-the-dip opportunity, with the potential for the primary uptrend to resume.
FIRST TARGET : 18.50
SECOND TARGET : 19.80
SUPPORT : 14.90
Rsibullish
ADOBE - Short-term Bullish SetupADBE - CURRENT PRICE : 350.43
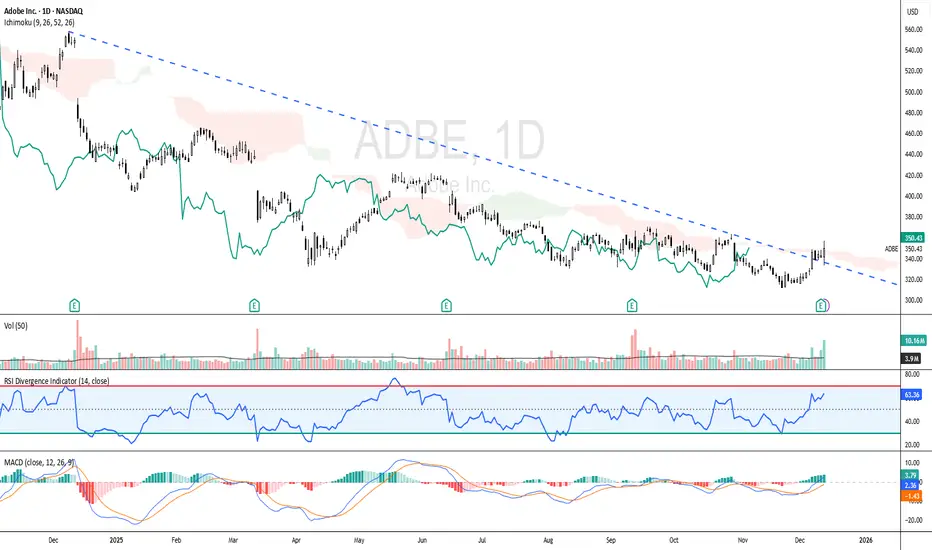
🔼 Short-term bullish outlook as price breaks above the downtrend line, signalling a potential trend reversal. 💪 RSI remains bullish above the mid-line, while MACD shows a positive crossover 📈, strengthening the upside momentum. ☁️ The Ichimoku Chikou Span (green line) is now above past candlesticks, supporting a shift toward bullish sentiment. Increasing volume on the breakout indicates strong buyer participation. If momentum continues, upside targets are at 170 and 190, with 130 as the key support to monitor.
ENTRY PRICE : 348.00 - 350.43
FIRST TARGET : 170.00
SECOND TARGET : 190.00
SUPPORT : 130.00
DAL - Upside Extension Toward ATH Looks PossibleDAL - CURRENT PRICE : 64.20
DAL is showing a strong bullish breakout as price surges above the key horizontal resistance near 64, supported by rising volume and a clean reclaim of both the EMA50 and EMA200. Today’s breakout candle signals renewed momentum, while the ascending trendline beneath reinforces a steady higher-low structure. RSI pushing above 60 reflects strengthening buyers without entering overbought territory. With this decisive breakout, DAL may build momentum toward higher resistance levels and potentially work its way toward challenging its all-time high zone if buyers continue to control the trend. Bias remains bullish above 58–60 support, with further upside favored as long as the breakout holds.
ENTRY PRICE : 64.00 - 64.40
FIRST TARGET : 69.00
SECOND TARGET : 74.00
SUPPORT : 58.00

MU – Trend Still Intact, EMA50 Bounce SetupMU - CURRENT PRICE : 220.00 - 222.00
Technical Reasons (Bullish Bias)
1️⃣ Price retesting strong dynamic support
Price is holding above the 50-day EMA, which has acted as support throughout the uptrend. Pullback into EMA50 often forms a bullish continuation point.
2️⃣ Price still above the Ichimoku Cloud
Price is trading above the cloud, meaning long-term trend remains bullish. The cloud is thick — showing strong trend support. Latest pullback is testing the top of the cloud, usually a high-probability bounce area.
3️⃣ RSI turning up from mid-zone (not overbought)
RSI is around 50, which is a healthy reset in an uptrend. No overbought conditions → room for upside continuation.
4️⃣ Trend structure remains bullish
Higher highs & higher lows remain intact. Current candle shows buying interest at key support.
5️⃣ Market respects previous breakout area
Price pulled back to retest September–October breakout zone → classic break-and-retest setup.
ENTRY PRICE : 218.00 - 222.00
FIRST TARGET : 236.00
SECOND TARGET 260.00
SUPPORT : 201.00

CRM - Minor Downtrend Line Broken!CRM - CURRENT PRICE : 260.57
CRM previously entered a downtrend following a double-top reversal , which pushed the stock into a prolonged bearish trend. However, current price action shows early signs of trend change as CRM successfully breaks above the minor downtrend line with strong momentum.
Momentum indicators are confirming the shift:
⚡RSI has turned bullish and moved decisively above 50
⚡MACD shows a bullish crossover with improving histogram
With improving trend structure and bullish indicators, CRM may continue its upward recovery. Price may extend toward 278.00 and 296.00 as long as it stays above 242.00 (near EMA 50).
ENTRY PRICE : 260.57
FIRST TARGET : 278.00
SECOND TARGET : 296.00
SUPPORT : 242.00

DOCU - Trendline Resistance in FocusDOCU - CURRENT PRICE : 71.87
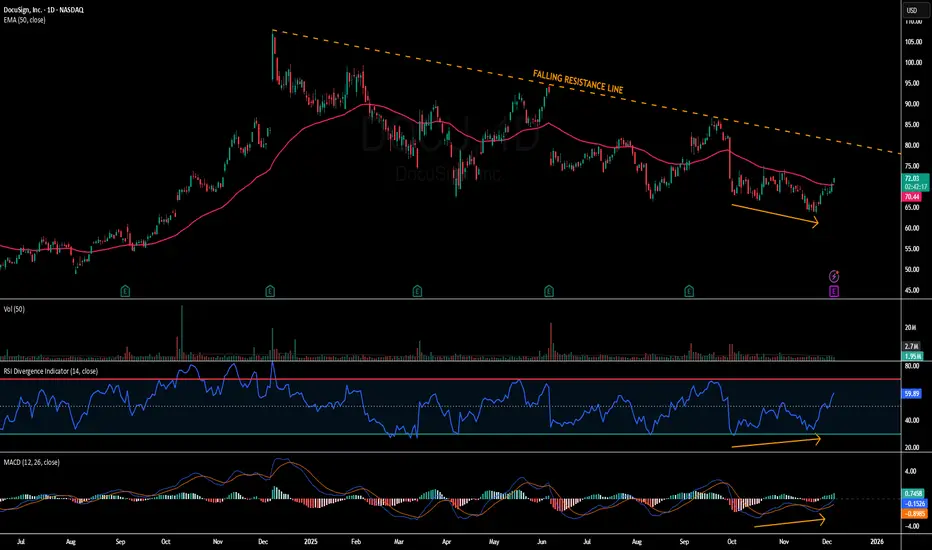
Short-term outlook for DOCU is bullish as price moves above the EMA50, supported by RSI holding above 50 and bullish divergence in both RSI and MACD (look at orange arrows). Momentum continues to improve with a MACD bullish crossover, positioning DOCU for a move toward the long-term downtrend line. First target is $79 near trendline resistance, with a potential extension to $85, while $65 remains the key support and invalidation level.
ENTRY PRICE : 70.00 - 71.87
FIRST TARGET : 79.00
SECOND TARGET : 85.00
SUPPORT : 65.00
PATH - Price Reclaims 50-EMA and 200-EMAPATH - CURRENT PRICE : 14.50 - 14.70
PATH is gaining traction after reclaiming both the 50-EMA and 200-EMA, signalling a shift back into short-term bullish momentum 📈. Price strength is supported by rising RSI and an improving MACD cross, suggesting buyers are regaining control.
🔥 Bullish Points
Price reclaimed 50-EMA and 200-EMA
RSI trending above 50 → bullish momentum returning
MACD turning positive with increasing histogram
Volume uptick on recent green candles = buyers active
ENTRY PRICE : 14.50 - 14.70
FIRST TARGET : 16.00
SECOND TARGET : 17.30
SUPPORT : 13.00

CRDO: Cloud + EMAs Aligning for Upside ContinuationCRDO - CURRENT PRICE : 162.95
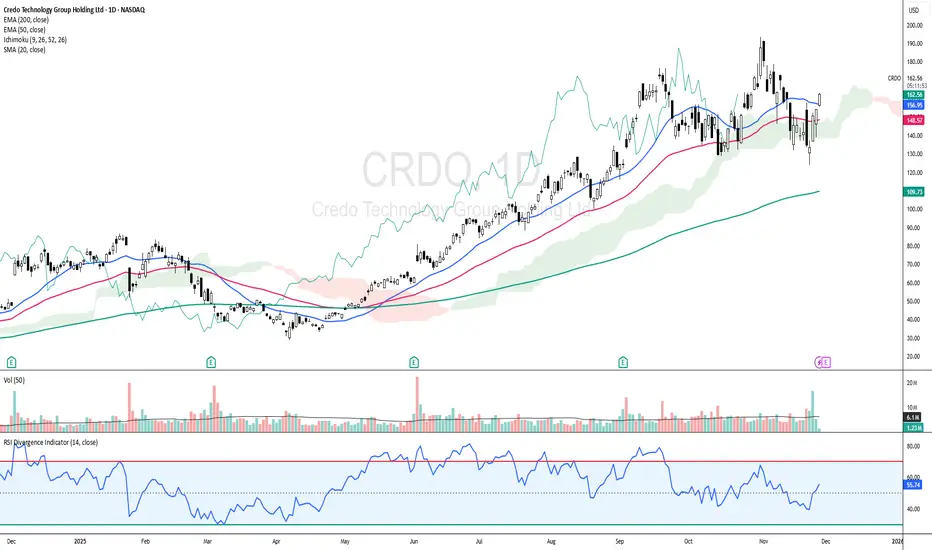
CRDO is showing a bullish reversal setup as price rebounds and closes back above the EMA50 while holding firmly above the Ichimoku Cloud , signaling the major trend remains intact. Momentum is improving with RSI rising above 50 and not yet overbought, supported by increasing volume on the recent bullish white candlestick.
Today’s move above the 20-day SMA adds a positive layer to the short-term trend structure. Short term targets are 175.00 and 185.00 while support is 148.00.
ENTRY PRICE : 160.00 - 162.95
FIRST TARGET : 175.00
SECOND TARGET : 1.85
SUPPORT : 148.00
VRT – Mini Downtrend Break & Momentum Turning UpVRT - CURRENT PRICE : 179.73
VRT breaks out from a minor down channel while holding strongly within the long-term ascending trend channel. 📊 The breakout candle shows renewed buying interest, supported by RSI turning higher from the mid-zone and MACD showing early bullish improvement. 💪 With momentum improving and the long-term trend intact, the setup supports a buy-on-breakout strategy toward the upper channel.
ENTRY PRICE : 176.00 - 179.73
FIRST TARGET : 195.00
SECOND TARGET : 215.00
SUPPORT : 160.00

SUNCON - BREAKS DOWNTREND LINESUNCON - CURRENT PRICE : RM6.13
SUNCON (MYX:SUNCON) is a Bursa Malaysia–listed company under the Construction industry.
Key Technical Highlights :
1. Breakout from Downtrend Line
Price has successfully broken above the descending trendline, signalling a potential trend reversal and fresh bullish momentum.
2. Price Holding Above EMA 50
SUNCON continues to trade above the EMA 50, showing that buyers are defending the medium-term trend and pullbacks are being absorbed.
3. RSI Turning Bullish, Not Overbought
RSI has bounced from the mid-zone and is trending upward, indicating strengthening momentum. Importantly, RSI is still far from the overbought zone, giving room for further upside.
ENTRY PRICE : RM6.10 - RM6.13
FIRST TARGET : RM6.50
SECOND TARGET : RM6.90
SUPPORT : RM5.80
Summary: SUNCON is showing a clean bullish setup after breaking out of its downtrend and holding strongly above the EMA 50. With RSI momentum improving and price structure recovering, the stock has potential to retest the all-time high if buying pressure continues.

PEGA - New 52-Week High, Next Stop All-Time High?PEGA - CURRENT PRICE : 66.27
PEGA has shown strong bullish momentum after breaking above its 52-week high resistance at USD 61.00. The breakout was followed by a successful retest, confirming strong buying interest and trend continuation.
RSI (45) remains steady above the 50 level, indicating a healthy and sustained uptrend with no signs of overbought pressure yet. Take note also that there is a rising support line - indicating demand is getting higher. If momentum continues, the stock has potential to retest its all-time high at around USD 74.40, representing strong upside potential. The stock’s immediate support lies at USD 57.66, aligning with the gap zone (rising window) formed earlier, which is expected to serve as a strong support area.
ENTRY PRICE : 64.00 - 67.00
FIRST TARGET : 74.30 (slightly below actual all time high resistance)
SECOND TARGET : 80.00
SUPPORT : 57.66

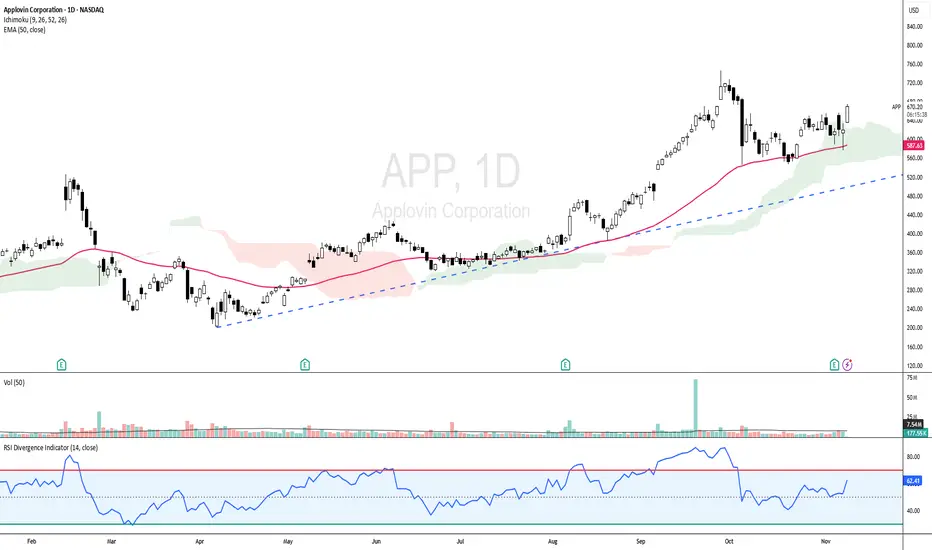
APP - UPTREND STILL INTACT!APP - CURRENT PRICE : 670.00 - 674.00
APP is showing strong bullish momentum as the price trades above the 50-day EMA and ICHIMOKU CLOUD , indicating a sustained uptrend. The RSI is in bullish territory but not yet overbought, indicating room for further upside. With the current setup, the stock has potential to retest its all-time high area if momentum continues.
ENTRY PRICE : 670.00 - 674.00
FIRST TARGET : 727.00
SECOND TARGET : 770.00
SUPPORT : 50-day EMA
ARDX – Double Rising Window Hints Bullish ContinuationARDX – CURRENT PRICE : 6.06
The stock has broken above its long-term downtrend line accompanied by strong volume (look at red arrow). This breakout was confirmed by the formation of a Rising Window (1), signaling the end of the previous bearish phase.
Another Rising Window (2) appeared recently, again on high trading volume, reinforcing bullish sentiment and indicating the likelihood of a continuation in the uptrend. Take note also that the RSI has climbed into bullish territory (above 50), suggesting a shift in momentum towards buyers’ control and further room for upside before reaching overbought conditions.
ENTRY PRICE : 5.80 - 6.10
FIRST TARGET : 7.00
SECOND TARGET : 8.00
SUPPORT : 5.11 (bottom of the Rising Window area)

ANET - Rebounds from EMA 50ANET - CURRENT PRICE : 148.00 - 149.00
Technical Rationale:
1. Rebound from Key Moving Average Support
The stock price has rebounded strongly from the 50-day EMA, which has acted as a dynamic support level throughout the uptrend. This rebound indicates renewed buying interest at a technically significant area.
2. Bullish Momentum Confirmation
ANET has crossed above the 20-day SMA, suggesting a short-term shift back to bullish momentum after a healthy pullback. This crossover reflects improving short-term trend strength.
3. Rising Support Line Intact
The long-term rising support trendline remains intact, confirming that the broader uptrend structure is well-maintained. Each corrective phase has so far been supported near this line, reinforcing the bullish bias.
4. Momentum Indicator (RSI)
The RSI is recovering from the mid-zone (~53), showing that bullish momentum is building again without being overbought. This supports the potential for further upside continuation.
ENTRY PRICE : 148.00 - 149.00
FIRST TARGET : 162.00
SECOND TARGET : 173.00
SUPPORT : 136.00

INTC Target Hit, Now Showing Another Bullish Setup!INTC - CURRENT PRICE : 41.53
My earlier INTC buy call has reached its projected targets. The previous analysis is shared below for reference.
Technical Highlights
1) New 52-week High – Price has broken into a fresh yearly high, confirming strong bullish momentum.
2) Pennant Breakout – The breakout from a bullish pennant pattern suggests continuation of the prior uptrend, with a potential target of $49 based on the pattern projection.
3) Golden Cross Intact – The 50-day EMA remains above the 200-day EMA, maintaining the long-term bullish bias.
4) RSI in Bullish Territory – RSI remains above 70, indicating strong momentum and persistent buying strength.
ENTRY PRICE : 40.00 - 42.00
FIRST TARGET : 45.00
SECOND TARGET : 49.00
SUPPORT : 36.43 (the low of 23 OCTOBER 2025 candle)

MRVL - RSI Back Above 50, Eyes Fibonacci Targets at 99 and 112MRVL - CURRENT PRICE : 86.00 - 88.00
MRVL is showing early signs of bullish continuation after finding support near the 50-day EMA and rebounding with positive momentum. The price structure remains healthy as it trades above the EMA 50, suggesting the medium-term trend is still intact.
Key Technical Highlights :
1) Price Above EMA 50
The stock price is holding above the EMA 50, showing that the uptrend remains valid and buyers are still in control.
2) RSI Above 50 and Not Overbought
RSI has crossed back above the 50 level, confirming improving momentum while staying below overbought territory, leaving more room for upside.
3) MACD Structure
Although the MACD line is still below the signal line, both are positioned above the zero level, indicating the overall market tone remains positive with potential for a new bullish crossover.
Based on Fibonacci extension, potential upside targets are at :
1st Target: USD 99.00 (0.618 level)
2nd Target: USD 112.00 (1.000 level)
ENTRY PRICE : 86.00 - 89.00
FIRST TARGET : 99.00
SECOND TARGET : 112.00
SUPPORT : 80.50

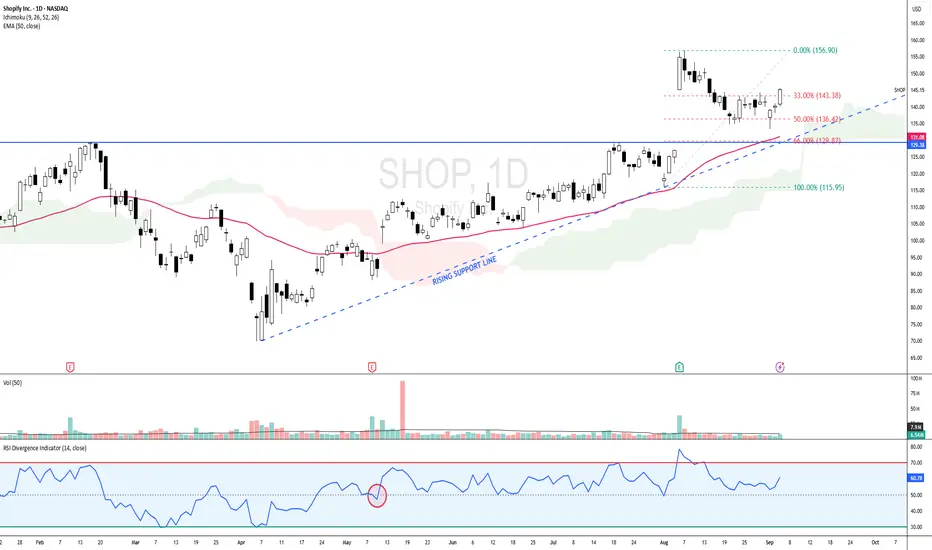
SHOP - BULLISH SCENARIO since 12 MAY 2025 SHOP - CURRENT PRICE : 145.15
SHOP is bullish as the share price is above 50-day EMA. Price action on 12 MAY 2025 is considered starting of bullish scenario because supported by several key indicators :
Share price gap up
Price broke out 50-day EMA
Price moving above ICHIMOKU CLOUD
RSI moving above 50
From 1 August (near 50-day EMA support) to 6 August, the stock recorded a strong upward rally. Following this advance, prices entered a corrective phase and retraced approximately 50% of the prior upswing. According to Dow Theory, such a retracement is considered a normal and healthy correction within an ongoing uptrend. Retracements in the range of one-third to two-thirds of the prior move are typical, with the 50% level often serving as a natural equilibrium point where buyers re-enter the market. Sustaining above the 50% retracement level would reinforce the bullish structure, while a recovery from this zone could pave the way for a retest of the recent highs. However, a decisive break below the 61.8% retracement may imply weakening momentum and a deeper corrective phase.
Take note that until now the share price is still above 50-day EMA and ICHIMOKU CLOUD while RSI also moving steadily above 50 level. There is also rising support line - strengthening bullish outlook.
ENTRY PRICE : 141.00 - 145.50
TARGET : 159.00 and 175.00
SUPPORT : 50-day EMA (CUTLOSS below 50-day EMA on closing basis)
QUBT - All MAs Pointing North!QUBT - CURRENT PRICE : 21.32
Technical Analysis Summary
Trend Analysis: The 20-day SMA is sloping upward, indicating short-term bullish momentum. Both the 50-day EMA and 200-day EMA are also trending higher, confirming that the medium- and long-term trends remain positive. Price is trading above all key moving averages, reinforcing a healthy uptrend structure.
Momentum Indicator (RSI): The RSI (14) is currently around 56, which is within the bullish territory (above 50). This shows positive momentum and room for further upside before entering overbought conditions.
Volume Analysis: Recent up-moves have been accompanied by rising volume, suggesting that the buying interest is supported by strong participation from investors.
Ichimoku Cloud: The price is above the Ichimoku Cloud, confirming the bullish sentiment and strong price structure. Chikou Span is above candlesticks and cloud further strengthening bullish outlook.
ENTRY PRICE : 21.20 - 21.40
FIRST TARGET : 25.00
SECOND TARGET : 28.00
SUPPORT : 18.00

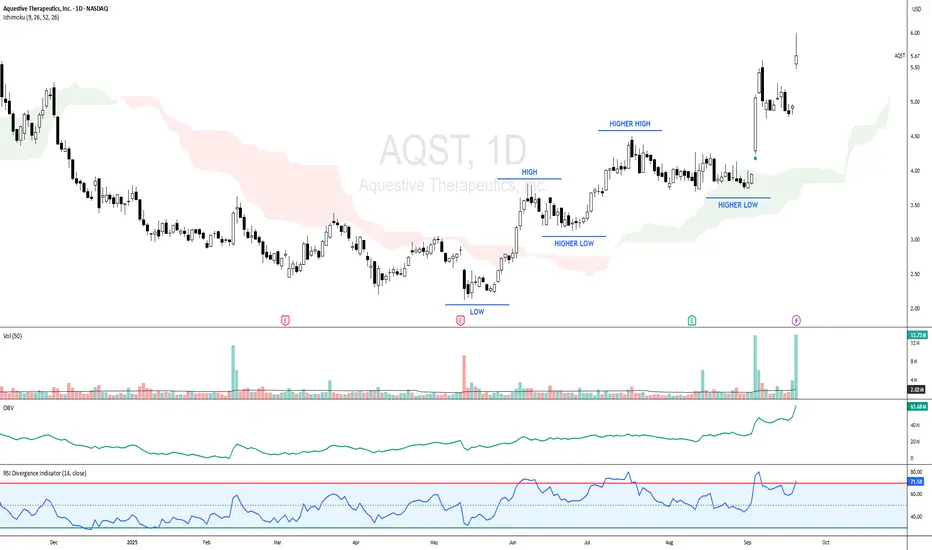
AQST - RISING PRICES is supported by INCREASING VOLUMEAQST - CURRENT PRICE : 5.67
Key Observations :
Uptrend Structure – The chart shows a clear uptrend where both highs and lows are moving higher, confirming bullish price action.
Volume Confirmation – Rising prices are supported by increasing trading volume, which validates the strength behind the uptrend.
OBV Indicator – On-Balance Volume line is trending upward, confirming strong accumulation and participation from buyers.
RSI Momentum – RSI is above 70, reflecting strong bullish momentum with no immediate signs of weakness.
Overall, the combination of higher highs & higher lows, volume confirmation, and bullish indicators (OBV & RSI) suggest that AQST (Aquestive Therapeutics, Inc.) is well-positioned for further upside in the short to medium term.
ENTRY PRICE : 5.47 - 5.67
FIRST TARGET : 6.40
SECOND TARGET : 7.90
SUPPORT : 4.97
CELH - From BEARS to BULLSCELH - CURRENT PRICE : 57.82
After completing a bearish reversal formation in the shape of a Double Top , the stock broke down from the neckline and entered a prolonged downtrend phase. This weakness was confirmed by the Relative Strength Index (RSI) , which stayed consistently below the 50 level, indicating persistent bearish momentum.
Subsequently, the stock established a saucer (bottom reversal) pattern , signaling a gradual shift in sentiment from selling pressure to accumulation (indicating a slow accumulation phase rather than a sharp reversal). Although there was no distinct breakout point, the gradual price recovery signaled a shift in market sentiment. This transition is supported by the RSI moving above and holding above the 50 level, suggesting strengthening bullish momentum.
Additionally, the stock has recently bounced off an internal trendline , reinforcing a "buy-on-dips" opportunity within the current uptrend. With this setup, there's an estimated upside potential of around 9% toward retesting its 52-week high, making it a favorable technical setup for short- to medium-term traders. For ICHIMOKU CLOUD traders, take note also that the share price is trading above cloud since 17 March 2025.
ENTRY PRICE : 56.00 - 58.00
TARGET : 63.00 and 69.00
SUPPORT : 52.00 (CUTLOSS below 52.00 on closing basis)
Notes : INTERNAL TRENDLINES are variations of the trendline that don't rely on extreme highs or lows. Instead, internal trendlines are drawn through the price action and connect as many internal peaks or troughs as possible. Some chartists develop good eye for this type of trendline and find them useful. The problem with internal trendlines is that their drawing is very subjective, whereas the rules for drawing of more traditional trendlines along the extreme highs and lows are more exact.

IONQ - BREAKOUT DOWN TRENDLINEIONQ - CURRENT PRICE 48.00 - 50.00
The stock is bullish as the share price is above 50-day EMA. The lows are getting higher - indicating demand is increasing.
The stock broke out down trendline - signaling bullish momentum. This bullish outlook is strengthened by positive readings in RSI (above 50 level).
ENTRY PRICE : 48.00 - 50.00
TARGET : 59.00 and 66.00
SUPPORT : 50-day EMA (CUTLOSS below 50-day EMA on closing basis)

MU - POTENTIAL 52-WEEK HIGHMU - CURRENT PRICE : 118.89
The share price rises almost 111% from the bottom of 07 April 2025 to the high of 26 June 2025. Then the stock starts to pullback. It retraces at Fibonacci golden ratio of 38.2%. Last Friday the stock rises and closed as a bullish LONG WHITE CANDLE with high volume - indicating strong buying interest from investors/traders.
This bullish scenario is also supported by some other indicators such as :
1) Price above 50-days EMA
2) Price closes above ICHIMOKU CLOUD (KUMO)
3) RSI reading at 58.95 (above 50 considered bullish)
4) Price is trading near 52-week high level
With all the evidence mentioned above, now may considered as a buying opportunity. 1st target should be one- or two-dollar below the actual 52-week high resistance level.
ENTRY PRICE : 115 - 119
TARGET : 128 and 135
SUPPORT : 108

AFRM - NEW 52-WEEK HIGHAFRM - CURRENT PRICE :88.46
AFRM made a new 52-week high last Friday with burst in trading activity. The 52-week high resistance level near 82.00 - 83.00 is considered significant resistance level based on the share price history as it had been touched several times. One of the bullish signs for this stock is that the RSI is moving above 50 level steadily since 27 May 2025 - look at the red circle. Take note also that there is a rising support line - indicating demand is getting higher. There is possibility that the stock may trend higher in near term.
ENTRY PRICE : 83.00 - 89.00
TARGET : 97.00 and 104.00
SUPPORT : 78.00
Notes : For chart pattern lovers, look at the heliview chart (bigger picture). There is a CUP & HANDLE pattern !
