Devyani International Testing Key Channel SupportDevyani International – weekly Timeframe
• Stock is trading near the falling channel support zone at 110–120.
• A 36–37% correction from the highs has already been completed near this support area.
• Support Zone (Key): 115–120
Major support zone : 100-105
• If this support sustains, a reversal towards 140 is possible (LOP resistance).
RSI is also taking support, which has been valid since 2023.
• Historically, whenever RSI has tested this support zone, the stock has shown a clear reversal.
• The current RSI behavior supports the possibility of a trend reversal from present levels.
• A decisive move above 140 may lead to higher prices towards the upper boundary of the channel.
Thank You .
Rsiindicator

Nasdaq MomentumFollowing the Federal Reserve’s rate cut decision, the ''RSI'' on the 4-hour chart is near the oversold zone. Price action has respected the key support area, as evidenced by multiple long lower wicks, indicating strong buying interest at these levels. Additionally, the ''Institution Radar'' indicator suggests that volume is well synchronized with price movement, implying transparent market participation and confirming the bullish momentum. Overall, these factors collectively support the likelihood of a near-term upward price continuation.

Market Psychology: Gold vs Bitcoin - Where We Really Are🧠 The Psychology Test That Changes Everything
Here's a simple test that will tell you everything about where TVC:GOLD and IG:BITCOIN is in its cycle:
Look at these two charts. Which one screams "bull market euphoria"?
────────────────────────────────────
Chart One
🥇 TVC:GOLD : A Textbook Bull Market
Current Price: $4,000.92
Peak Price: $4,390 (Recently hit)
RSI: 69.15
Phase: EUPHORIA → COMPLACENCY (Post-peak pullback)
What the Psychology Chart Shows:
Looking at FOREXCOM:XAUUSD price action overlaid with the Wall Street Cheat Sheet:
✅ Clean parabolic structure - No ambiguity
✅ Multiple phases completed - Hope → Optimism → Belief → Thrill → Euphoria
✅ Peak already hit at $4,390 - The pink Euphoria circle was touched
✅ Now pulling back from peak - Classic post-euphoria behavior
✅ RSI cooling from overbought - Down from 85+ to 69.15
✅ Volume still elevated as reality sets in
This is what a COMPLETED bull market looks like.
When you see this chart, you don't second-guess. You don't wonder "is this a bull market?"
You KNOW it is.
────────────────────────────────────
Chart Two
₿ IG:BITCOIN : Still in Early Stages
Current Price: $101,802.2
RSI: 44.61
Phase: OPTIMISM (not even Belief yet)
What the Psychology Chart Shows:
Looking at INDEX:BTCUSD price action overlaid with the Wall Street Cheat Sheet:
⚠️ "We are here" marker - Sitting in the OPTIMISM phase
⚠️ Haven't reached Belief yet - The green zone is still ahead
⚠️ Thrill phase - Blue circle far above current price
⚠️ Euphoria phase - Pink circle even further away
⚠️ RSI at 44.61 - Not even close to overbought
⚠️ Fourth Halving marker - April 22, 2024 clearly noted
This is what mid-cycle consolidation looks like.
────────────────────────────────────
🔍 The Critical Difference
Let me use an analogy: Think of market cycles like a marathon.
FOREXCOM:GOLD (Chart 1):
Mile 26 - Just crossed finish line - Race is over, starting to cool down
Runners are slowing down after sprint (Post-euphoria)
Crowd peaked, now dispersing (Volume still high but declining)
Everyone saw the finish (Peak at $4,390)
Now wondering if they should have sprinted harder
CRYPTOCAP:BTC (Chart 2):
Mile 8 of 26 - Still early in the race
Runners are fresh and steady (Optimism)
Crowd is watching but not cheering wildly yet
Most people aren't even at the venue yet
Many spectators think the race might be cancelled
────────────────────────────────────
📊 Side-by-Side Psychology Comparison
────────────────────────────────────
🎯 What This Tells Us About IG:BITCOIN
If COINBASE:BTCUSD were truly at a cycle top, it would look like CAPITALCOM:GOLD :
❌ Parabolic vertical moves
❌ RSI pinned above 75 for weeks
❌ Volume exploding
❌ Everyone saying "Bitcoin to $500K"
❌ Taxi drivers asking about crypto
❌ Magazine covers everywhere
❌ No doubt whatsoever about the trend
But OANDA:BTCUSD looks nothing like that:
✅ Choppy consolidation
✅ RSI in neutral zone (44.61)
✅ Volume moderate
✅ Everyone asking "Is the bull market over?"
✅ Retail despair and fear
✅ Zero mainstream coverage
✅ Maximum doubt about the trend
────────────────────────────────────
💡 The Psychology Principle
Here's the key insight from behavioral finance:
**"If you have to ask whether you're in a bubble, you're not in a bubble."**
TVC:GOLD : No one is asking if TVC:GOLD is in a bull market. It's obvious.
IG:BITCOIN : Everyone is asking if IG:BITCOIN is in a bull market. That's your answer.
────────────────────────────────────
🧩 Where Each Asset Really Is
TVC:GOLD - Post-Peak Bear Market Transition:
Completed Phases:
✅ Hope (Oct '23 - May '24)
✅ Optimism (May '24 - Dec '24)
✅ Belief (Dec '24 - May '25)
✅ Thrill (May '25 - Sep '25)
✅ EUPHORIA - PEAKED at $4,390 (Oct '2025)
Current Phase:
🔶 COMPLACENCY - "It'll come back to $4,390"
Price: $4,000.92 (down ~9% from peak)
Classic post-euphoria denial behavior
What's Next:
Anxiety → Denial → Panic → Capitulation (2026+)
Time Remaining: Bull market is OVER - bear phase beginning
────────────────────────────────────
KRAKEN:BTCUSD - Early-Mid Bull Market:
Completed Phases:
✅ Hope (2023 - Post-FTX recovery)
🟡 OPTIMISM (Current - 2024-2025)
Phases Still Ahead:
⬜ Belief
⬜ Thrill
⬜ Euphoria
What's Next:
Break into Belief phase → Thrill → Euphoria
Time Remaining: Given CRYPTOCAP:BTC high volatile nature - 2-6 months of upside potential
────────────────────────────────────
🎨 The Visual Test (Do This Right Now)
Step 1: Look at the TVC:GOLD chart
Does it look like a bull market? YES
Could you be wrong? NO
Is there any doubt? ZERO
Step 2: Look at the IG:BITCOIN chart
Does it look like a bull market? MAYBE?
Could you be wrong? POSSIBLY
Is there any doubt? TONS
Step 3: Ask yourself
**"Would a cycle TOP have this much doubt and fear?"**
The answer is NO.
────────────────────────────────────
📈 What the RSI Divergence Tells Us
TVC:GOLD RSI Pattern:
Peaked above 85 during euphoria
Currently cooling at 69.15
Rolling over from overbought
Classic post-peak behavior
This is bear market transition
IG:BITCOIN RSI Pattern:
Sitting at 44.61
Plenty of room to run
Not even approaching overbought
Recent "Bear" signals flushing out
This is early-cycle behavior
Think of it like a gas tank:
TVC:GOLD : Hit redline at $4,390, now coasting down on fumes
IG:BITCOIN : 45% full, tons of room to run
────────────────────────────────────
🔥 The Contrarian Insight
What the majority thinks:
" TVC:GOLD is in a bubble, IG:BITCOIN topped"
What the charts actually show:
TVC:GOLD is in a mature bull market (near end)
IG:BITCOIN is in early-mid bull market (tons of runway)
The irony:
Everyone trusts TVC:GOLD rally (late stage)
Everyone doubts IG:BITCOIN rally (early stage)
This is exactly backwards.
────────────────────────────────────
🎭 The Emotional State Comparison
TVC:GOLD Holders Right Now:
😰 Starting to feel anxious (down from $4,390)
🤔 "It'll bounce back, right?"
📉 Checking price hoping for recovery
🙃 "I should have sold at $4,390"
😬 "This is just a healthy correction"
This is COMPLACENCY - the denial phase after euphoria.
IG:BITCOIN Holders Right Now:
😰 Anxious and doubtful
🤐 Not talking about their positions
😔 Wondering if they should sell
📉 Feeling defeated
💀 "Maybe the cycle is over"
Which emotional state typically marks:
Post-cycle tops? → TVC:GOLD current state (Complacency/Denial after Euphoria peak)
Cycle middles? → IG:BITCOIN current state (Doubt during Optimism)
────────────────────────────────────
💎 The Bottom Line
Using the Wall Street Cheat Sheet as our guide:
TVC:GOLD :
Phase: Thrill → Euphoria
Completion: ~95% through cycle
Risk/Reward: High risk, limited reward
Action: Take profits soon
IG:BITCOIN :
Phase: Optimism (just finished Hope)
Completion: ~30% through cycle
Risk/Reward: Moderate risk, massive reward
Action: Accumulate aggressively
────────────────────────────────────
🧠 The Psychology Lesson
The market is designed to make you feel wrong at exactly the wrong time:
When TVC:GOLD peaked at $4,390 (Euphoria) → You felt confident, " TVC:GOLD to $5K!"
Now TVC:GOLD is pulling back (Complacency) → You feel like "it's just a correction"
When IG:BITCOIN is cheap and poised (Optimism) → You feel scared to buy
This is why most people:
Miss selling tops (felt too good at $4,390)
Hold through corrections (denial and complacency)
Sell bottoms during fear (Optimism feels scary)
To win, you must:
Trust the structure over the sentiment
Buy when it feels uncomfortable (Optimism/Belief)
Sell when it feels amazing (Euphoria/Peak)
────────────────────────────────────
📍 Where We Actually Are
HOPE → OPTIMISM( IG:BITCOIN ) → BELIEF → THRILL → EUPHORIA ( TVC:GOLD $4390 Peak) → COMPLACENCY → ( TVC:GOLD Current)
IG:BITCOIN is 3-4 phases behind TVC:GOLD .
TVC:GOLD already peaked. IG:BITCOIN hasn't even started its parabolic phase yet.
────────────────────────────────────
🎯 What This Means for Your Portfolio
If you're holding TVC:GOLD at $4,000:
You missed the peak at $4,390
You're in post-euphoria complacency
"It'll bounce back" is denial
Risk/reward is terrible now
Exit strategy needed YESTERDAY
If you're doubting IG:BITCOIN at $102K:
You're sitting in Optimism
You're early to the party
Peak is 3-4 phases away
Risk/reward is excellent
Accumulation strategy needed NOW
────────────────────────────────────
🔚 Final Thought
The next time someone tells you " IG:BITCOIN topped," show them these two charts side by side.
Ask them: "Which one actually topped?"
The answer is clear: TVC:GOLD peaked at $4,390 and is now in complacency denial. IG:BITCOIN is still in optimism.
TVC:GOLD finished its race.
IG:BITCOIN is just finishing Act 1.
The Golden Bull Run isn't over—it's barely begun.
────────────────────────────────────
This is educational content comparing market psychology across asset classes. Not financial advice. Always do your own research and manage risk appropriately.
────────────────────────────────────

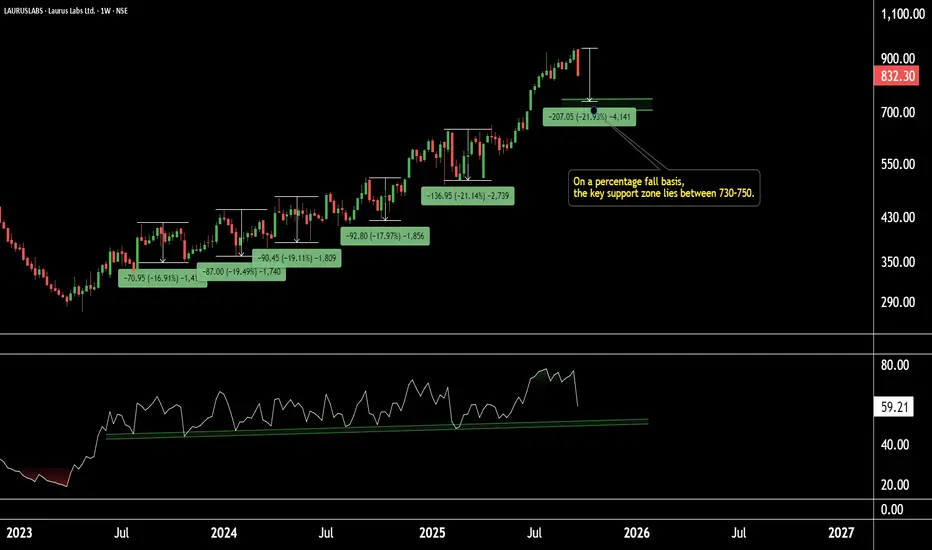
Laurus Labs | Price Action Buying Zone on RadarLaurus Labs | Weekly Technical Outlook
On the weekly timeframe, Laurus Labs has been showing consistent corrections of around 19–20% in each fall.
Currently, the stock is approaching a strong support zone near 700–730, where the weekly RSI is also holding support.
If this level sustains, Laurus Labs has the potential to see higher price levels in the coming sessions.
Thank You !!
one of the applications of RSIRSI as an indicator can be used in several ways ,
RSI is almost mirror image of the price ,
if we convert a candle stick chart into a line chart ,
and we hide which is RSI plotting and which is price plotting ,
it is difficult to identify which one is which...
But there are times where RSI due to it formula creates
divergence and confluences with prices, and there are
many articles and tutorials to explain those aspects of RSI
Motive of this article :
To see RSI as tool for range bound trading , and shape our next trade ideas using this
possibility .
After working with RSI extensively , all what I can say is RSI can be treated
almost similar with all the treatments which we can have over the price chart ,
for example : we can apply head & shoulders / cup&handle etc ... concept(s) on rsi ditto same as we do on price chart. so decoding RSI isn't just limited to divergences ...
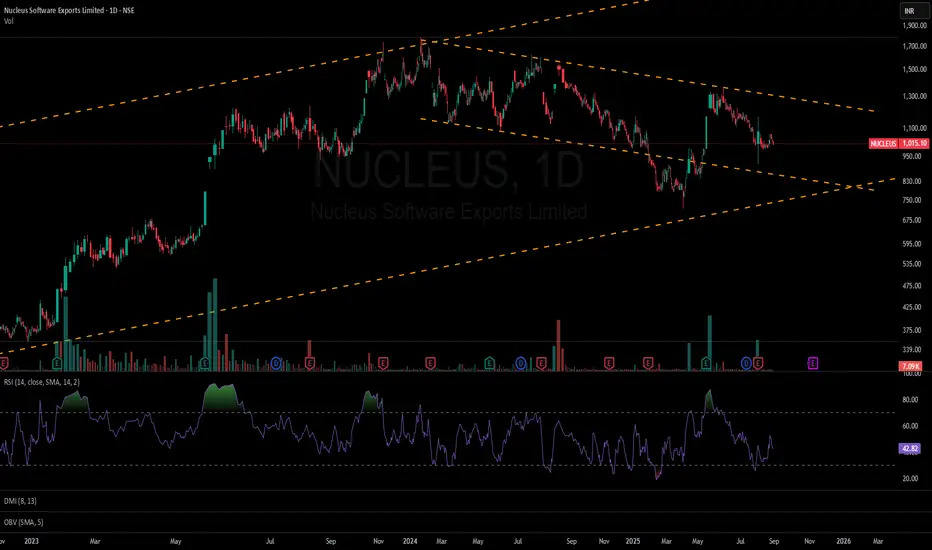
One of such use-cases which I have been using about RSI is in range-bound trading,
if we can have a price range or a parallel channel , you can observe that either price
goes side-ways or gets reversed as per the RSI in the respective timeframe ...
here we are taking two channels ( a channel within a channel )
1w candles , and 1D candles .. and you can see RSI going from 30 to 70 to 30 to 70 ,
all alongwith the boundaries of the price range in either 1w or 1d channels ...
Just two images and it is clearly visible what we are discussing here ,
1w candles : see the candles having a range of channel and rsi also behaving in same way between 70-30 levels :
1d candles : see the candles having a range of channel and rsi also behaving in same way between 70-30 levels :
So the whole logic over here is , if in case we can make out a range bound behaviour ,
or a price range in channels , then we can align our next trade idea in accordance
with the RSI behaviour i.e.
if it is around 70 levels in 1D timeframe , then we can try to observe if there is any chart pattern or price action which is showing a sell side trade ...
and if it is around 30 levels in 1D timeframe , then we can try to observe if there a buy side trade based on price action / or chart patterns . . .
same goes with 1W candles ....
( I am not focussing on 1M because it becomes very much slow process and we always have lots of scrips to trade with on D and W basis .. so omitting it for M candles ... but i am much much sure this can work with M candles as well ... )
Now one of the aspect is to check whether there is an alignment of RSI on both timeframes D & W , if both time frames are having rsi around 30 , and the prices are range bound in both timeframes ... we can have a much much high conviction on buy-side or the trade ....
And at last please note three things about RSI which i have observed and discovered
while talking with lots of fellow trades ....
1) RSI follows CLOSE prices , and not the wicks ( high and low ) so while detecting divergences consider the close price and now the high or low ..
2) RSI hitting 70 is not an assurance of prices reversing , it can either reverse or just go side-ways .... RSI at any level 70 or 30 is not an guarantee of " Price reversal "
3) RSI can remain above 70 for a much much time period than usual expectation, and RSI can remain below 30 for much much time ... there are index charts which shows this ...
Bonus point : read some where from a veteran of the market , prices can remain irrational for a longer period of time , just make sure you remain solvent till then ...
happy investing and joyful trading wishes to all
A Different Way To Use the RSI To Trade Deceleration Patterns A deceleration pattern is a pattern that forms at the end of a directional move as it starts to lose steam. 2 good ones to learn are the rising/falling wedge & channel.
The problem wit these patterns however, is that it can sometimes be difficult to tell when that final reversal may come backing it hard to place stops.
Lately, and by that I mean for the past year or so, I've been tracking a very specific pattern on the RSI (Relative Strength Index) indicator to help me with these situations.
Please LIKE & SHARE and if you have any questions or comments, leave them below
Akil

GOLD - Day Trading with RSI 04/01/2025FOREXCOM:XAUUSD
D and H4 Timeframes:
GOLD is in a strong uptrend.
RSI is operating around the 80 level, indicating that buying pressure is 4 times stronger than selling pressure.
Priority: Trade in the direction of the trend on higher timeframes.
H1 Timeframe:
GOLD is showing signs of a correction: EMA9 has crossed below WMA45, and RSI is positioned below the two MA lines.
Given the current slope of WMA45 on the H4 RSI, this correction is considered minor for now.
Intraday Trading Plan:
Entry Strategy:
If H1 continues to correct: Look for buy entries when RSI H1 reaches previous RSI lows (zones 44, 55).
If H1 breaks the current high (level 3128): Look for buy entries when RSI M15 reaches previous RSI lows (zones 30–40).
At these levels, RSI M5 should end its downward wave (e.g., forming a double-bottom pattern on RSI) or show a price-RSI divergence before entering a buy trade.
Stop Loss (SL):
Set SL 20–30 pips below the entry point's low on the M5 timeframe.
Take Profit (TP):
Follow an R:R ratio of at least 1:1.
Or, take profit when M5 ends its bullish wave:
If RSI M5 forms a double-top pattern or
If RSI M5 crosses below WMA45.
Partial profit-taking is recommended at different stages to optimize returns.
📌 Refer to my scripts for pre-configured RSI indicators. 🚀

SMH @ 200 Day SMAAs we have always said Semis are the new transports. SMH hit the 200 Day SMA on the daily chart. It has been forming a symmetrical wedge pattern. It has an equal opportunity to break out towards upside or downside. The RSI has been oscillating between 60 and 40 since Nov 2024. Watchout the SMH chart to confirm if stock market bull market is intact.

AUDUSD Looking for mean reversion trade (SHORT TERM)Daily Chart seems over extended using 200sma Bollinger Band and RSI reacting at 25 oversold level although this could still push lower. If my predictions is right that the price could pull back to at least close to mean there could be an opportunity for a trade
1hour execution timeframe I waited a pullback to a 61.8 fib from the range also at the rsi 100sma pull back for confluence

📈Atom's Weekly Breakout Watch: Chart Signals Bullish Momentum⚛️🔍In the weekly timeframe, Atom's price action has remained within consolidation since May 2022, without a breakout for over 660 days. However, recent developments show a significant breakout of the trend line, supported by confirmation signals based on Dow Theory principles in the preceding candlestick.
💎The Fixed Range Volume Profile indicator complements the Dow Theory trigger, confirming the uptrend with increasing volume.
💥Furthermore, the RSI oscillator has breached the 65.11 level and reached the overbought zone around 70, indicating potential heightened volatility.
✨Despite these bullish signals, Medium Wave Cycle (MWC) and High Wave Cycle (HWC) ranges continue to exert influence, with a robust supply zone observed between 14.6 to 16.2, posing resistance even against all-time highs.
🛒For traders seeking aggressive positions, entering a long position upon the close of the current candle or in the spot market may be viable. Alternatively, conservative traders may opt to await price reaction within the supply zone and confirm the trend in subsequent candles.
📉In the event of a reversal from the supply zone, potential buying opportunities may emerge within the range of 9.5 to 11, pending confirmation of candlestick patterns.

Understanding and Utilizing the RSI Indicator in Forex and Gold
When it comes to trading gold and forex, technical analysis plays a vital role in predicting market trends and making informed trading decisions. One of the most popular technical indicators used by traders is the Relative Strength Index (RSI).
The RSI indicator is a momentum oscillator that measures the magnitude and velocity of price movements in a currency pair or gold. It oscillates between 0 to 100 and shows whether a currency pair or gold is overbought or oversold.
Here are some tips on how to use the RSI indicator in gold and forex trading:
1. Identify overbought and oversold levels: RSI values above 70 indicate overbought levels, while values below 30 indicate oversold levels.
2. Use divergence for trend reversal: Divergence forms when the price and RSI indicator move in opposite directions. It can signal a potential trend reversal.
3. Combine with other technical indicators: RSI can be used in conjunction with other technical indicators, such as moving averages, to confirm signals.
4. Look for RSI support and resistance levels: RSI support and resistance levels can give traders insights into potential price levels where a reversal might occur.
5. Use RSI for trade entry and exit: Traders may use RSI to identify entry and exit points for trades. For example, buying a currency pair when its RSI is below 30 and selling it when it rises above 70.
6. Remember to adjust for volatility: High volatility can lead to false RSI signals. Traders must adjust their RSI settings to accommodate increased volatility.
In conclusion, the RSI indicator is a widely used tool in technical analysis and can provide valuable insights into gold and forex trading. Remember to use it in conjunction with other tools and indicators and adjust your settings based on market volatility.
Please, like this post and subscribe to our tradingview page!👍

GOLD : How to trade with Rsi IndicatorOANDA:XAUUSD
What Does RSI Mean?
The relative strength index (RSI) measures the price momentum of a stock or other security. The basic idea behind the RSI is to measure how quickly traders are bidding the price of the security up or down. The RSI plots this result on a scale of 0 to 100.
Readings below 30 generally indicate that the stock is oversold, while readings above 70 indicate that it is overbought. Traders will often place this RSI chart below the price chart for the security, so they can compare its recent momentum against its market price.
How do you trade effectively with RSI?
The common levels to pay attention to when trading with the RSI are 70 and 30. An RSI of over 70 is considered overbought. When it below 30 it is considered oversold. Trading based on RSI indicators is often the starting point when considering a trade, and many traders place alerts at the 70 and 30 marks.
KEY TAKEAWAYS
The relative strength index (RSI) is a popular momentum oscillator introduced in 1978.
The RSI provides technical traders with signals about bullish and bearish price momentum, and it is often plotted beneath the graph of an asset’s price.
An asset is usually considered overbought when the RSI is above 70 and oversold when it is below 30.
The RSI line crossing below the overbought line or above oversold line is often seen by traders as a signal to buy or sell.
The RSI works best in trading ranges rather than trending markets.

PI INDUSTRIES ANALYSIS!!RSI INDICATOR: is something which says the actually part of the price should be placed.
cups and handles is a very bullish price pattern formation.
and top of that, if rsi indicator is forming such pattern, then to speak on to it, the stock is a very great stock.
i have check the fundamentals. the rations, sales analysis are very greatly performing.
the two black line are the trend formation after the corona 2019 crash.
and blue line is the old trend.
the stock did gave its all time high recently. its possible to go more higher, since there is no drawback, or major risks associated to this stock.
recent quarters too outperformed from the analyst projected estimates.
great stock for swing trading and long term .

SLCA Hedged Options StrategyUS Silica Holdings Inc had a good Q3, as one of the top companies making revenue in a supportive role in the energy sector. Specifically, they supply sand that's used in hydraulic fracturing of oil and gas wells via its extensive network and can deliver on last-mile logistics (directly to the well site). Subsidiaries like EP Minerals also makes diatomaceous earth, perlite, engineered clays and other industrial products. With an increased demand for energy across the globe, this seems like a not-too-risky investment.
And cross-referencing -- Analysts have mostly rated it a Strong Buy, Buy, and Hold; Yahoo Finance predicts a bullish performance both short and long term. BUT a neutral pattern is detected (see doji-ish star with a slight push up, and commodity channel index.) With the recent Fed rate hike and uncertainty in SPX and general indices, here's my even safer bet: a hedged trading outcome.
Buy 1 $12 Call
Sell 1 $17 Call
Sell 2 $10 Puts
All expiring 1/19/24
Making up to 29% on this options-investing strategy.
Betting that $SLCA does NOT fall more than 34% though 1/19/24.
Capital Required: $1,943
