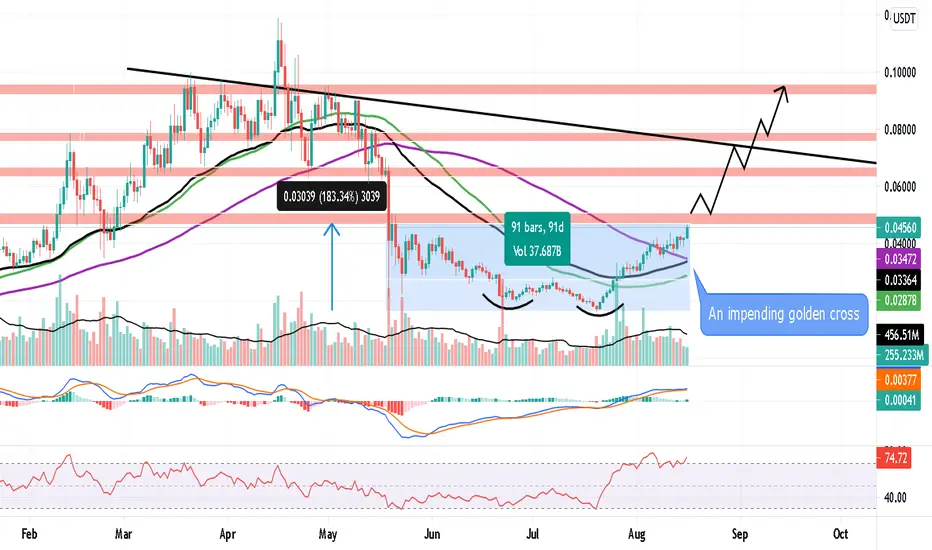
RSR DESERVES MORE ATTENTIONFundamental analysis of RSR reveals that this project deserves a lot more attention than it has already garnered. No wonder it is one of the top projects Coinbase has invested in. However, it has not been listed on Coinbase yet. This bodes well for mid-term and long-term hodlers.
Technically speaking, RSR is breaking out of a huge range. The crucial resistance level ahead will catapult this coin into previous highs if retaken. RSI is in the overbought territory; however, it has some tiny room to grow to settle above the resistance zone. MACD indicates that it has some fuel left to propel the drive. Plus, an incoming golden cross between MA50 and MA100 might prove to be a catalyst. More importantly, the flip is a matter of "when", not "if".
I will definitely open a trade on the retest of the resistance flipped support. The trend line in black might prove a bit of a hurdle. Having said that, momentum will force a break out of that. Patience is the name of the game for now. A great opportunity is brewing.
Rsrusd
RSRUSDT . Now what?RSR after having a nice dip could try for a retest of upper 0.042 res again , but this will be the last run of rsr if btc dips .
yellow circle represents to sell there cause then there won't be any chance if btc crashes under 40k .
as of now I see rsr have bottomed out and can move to 0.042 again. after that
it can crash to 0.02 ( very likely ) black line downwards
OR can go to 0.05 ( less likely ) purple line upwards
so selling at 0.042 is the best opportunity of selling .
as of now I only see a bearish retest not up only

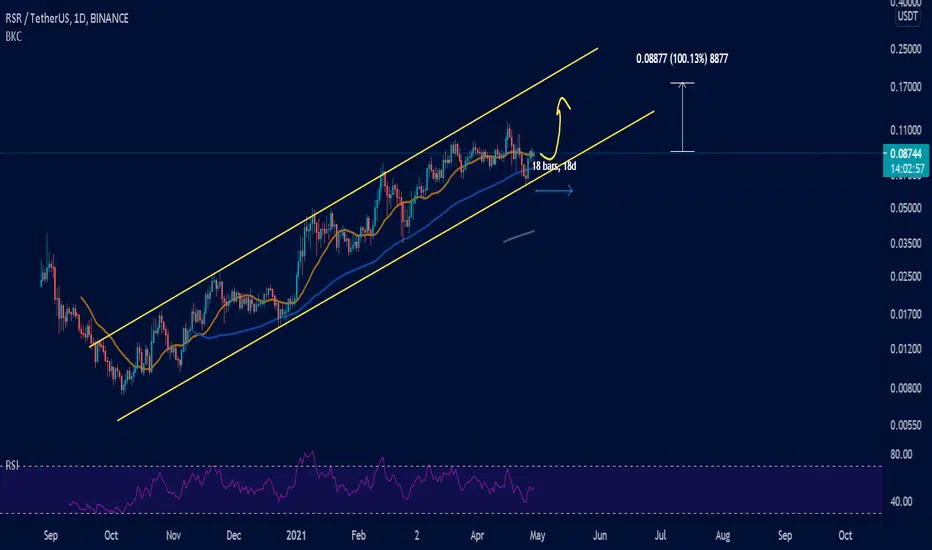
$RSR SIGN OF STRENGTHwell above the 18 moving channel of highs/lows
breaking the downtrend structure
bullish divergence on the macd
facing the 200 day moving average in yellow next

RSRUSDT, are we due for a down move ?From the past days since RSR got bottomed out it went on it's mini bull run and outpaced many alts .
it broke it's 0.034 resistance and turned it into a support.
after many green days, I think we are on the verge of down move and seeing a retest of 0.034 again
0.04 is also one of the bigger resistance we have to see .
but up till now rsr shows no signs of exhaustion

RSR - Almost ended Out standing performance. I really liked it, it was just pump pump pump.
But now it's almost the end of it. See that thick resistance? That's about it.
There are many support areas but only 2 of them are the main ones which I've shown on the chart. This might be a start of a breakout so those support areas can be very important.
I'll keep this chart updated.
Current Market Price: $21
Good Luck
Tell me your ideas. Like and Share

$RSR RAINBOWS & BUTTERFLIESon the super fast macd signal view the energy is stored and ready to move
only rainbows and unicorns for the rest of 2021
LOL
not financial advice

ROAD TO 1$ RSR - WITH OR WITHOUT YOUDaily RSI is OVERSOLD.
BOTTOM is IN - Panic dump to 2c was a natural retest of breakout point.
Best R:R in crypto today.

ROAD TO 1$ RSR - WITH OR WITHOUT YOUDaily RSI is OVERSOLD.
BOTTOM is IN - Panic dump to 2c was a natural retest of breakout point.
Best R:R in crypto today.

$RSR FRESH FIBSfresh fib channel for reserve protocol
I believe there is much price discovery yet before the value of this network is priced in
not financial advice

Altcoins Update: RSR, the solution to hyperinflationVolume and Price action shows:
Target 1: 0.16
Target 2: 0.40
Target 3: 1.2
P.S: Anything I say or do, should always be taken with a pinch of doubt. You might make or lose money based on my opinion, but you are solely responsible for your own actions. I am not your financial advisor!

GANN RSRRSR is a coin that I have been holding for a long time waiting for it to moon but its simply lost its momentum not sure what's happened with this coin but very weird patterns since march 2021.
Hoping 2/1 ratio is not broken , this is project I really hope does well not just to make money but to help people world wide with inflation its nice to invest into a project for once trying to help people.
I will HODL my bags wait for XRP moonshot one day to 1dollar lols


RSR in the moon? 🚀Charts have shown us in the past. I think is bullish .
News:
Reserve Rights (RSR) is listed in the Crypto.com

RSRUSDTSetup for 2-3 weeks.
100% precent of TP.
If you have any free USDT, you can try this setup with give us chance to take 100% in few weeks. SL can be setup under the trendline.
LbL_CZ
RSR: NEW ATH COMINGMAs seem to be about to cross each other soon.
MACD is back up.
RSI is showing signs of life.
Waiting for a breakout!

RSR perfect level in 61.8 fibo make 28%RSR in level 61.8 of fibo and make 28% in just one day and in perfect support we will see 0.095 soon


Reserve Rights Token (RSR) - April 21Hello?
Dear traders, nice to meet you.
By "following" you can always get new information quickly.
Please also click "Like".
Have a good day.
----------------------------------
(RSRUSD 1W chart)
(1D chart)
We have to see if we can go up along the uptrend line.
If it falls from the 0.05926847 point, a Stop Loss is required to preserve the profit and loss.
However, it may rise along the uptrend line, so careful trading is necessary.
----------------------------------
(RSRBTC 1W chart)
(1D chart)
You should watch for any movement that deviates from the 151 Satoshi-180 Satoshi section.
In particular, it remains to be seen if it can rise along the uptrend line.
-------------------------------------------------- -------------------------------------------
** All indicators are lagging indicators.
So, it's important to be aware that the indicator moves accordingly with the movement of price and volume.
Just for the sake of convenience, we are talking upside down for interpretation of the indicators.
** The wRSI_SR indicator is an indicator created by adding settings and options from the existing Stochastic RSI indicator.
Therefore, the interpretation is the same as the conventional stochastic RSI indicator. (K, D line -> R, S line)
** The OBV indicator was re-created by applying a formula to the DepthHouse Trading indicator, an indicator that oh92 disclosed. (Thank you for this.)
** Check support, resistance, and abbreviation points.
** Support or resistance is based on the closing price of the 1D chart.
** All explanations are for reference only and do not guarantee profit or loss on investment.
Explanation of abbreviations displayed on the chart
R: A point or section of resistance that requires a response to preserve profits
S-L: Stop Loss point or section
S: A point or segment that can be bought for profit generation as a support point or segment
(Short-term Stop Loss can be said to be a point where profits and losses can be preserved or additionally entered through installment transactions. It is a short-term investment perspective.)
GAP refers to the difference in prices that occurred when the stock market, CME, and BAKKT exchanges were closed because they do not trade 24 hours a day.
G1: Closing price when closed
G2: Cigar at the time of opening
(Example) Gap (G1-G2)

RSR: LONG! It took RSR long to break out, but eventually it is moving!
Wait for a pullback to enter.
Please hit LIKE if you find this useful!

$RSR CONTINUATIONtap of .033 support and 80 DMA
breaking over the 1.618 fib channel
possible elliott 5 wave taking price to good places
looks positive for RSR
not financial advice
