RTY: Small Caps Stuck Between Growth Optimism & Macro OutlookRTY Overview and Recent Macro Backdrop
RTY, or Russell 2000 futures, track the performance of the Russell 2000 Index, which represents approximately two thousand U.S. small cap companies. These constituents are drawn from the lower end of the Russell 3000 Index and typically reflect firms with smaller market capitalizations, greater domestic revenue exposure, and higher sensitivity to economic conditions than their large cap peers. The primary deciding factor for inclusion in RTY versus the S&P 500 is market capitalization. The Russell 2000 consists of the smallest two thousand companies within the Russell 3000, while the S&P 500 is a committee selected index composed of roughly five hundred large cap companies that must meet additional criteria such as profitability, liquidity, sector balance, and sustained earnings. Although market cap thresholds shift annually, Russell 2000 constituents generally fall well below the market cap range of S&P 500 companies and are reconstituted mechanically each year based on size rankings.
As the market settles into the new year, RTY has been trading within a more nuanced macro environment shaped by early year repositioning and reassessment of economic expectations. Price action over the past month has been increasingly influenced by evolving views on monetary policy, credit conditions, and the durability of U.S. growth. While recent inflation data has shown signs of moderation, it has remained uneven, keeping rate cut expectations fluid rather than fully priced in. This has limited sustained directional momentum in small caps, as higher borrowing costs continue to pressure balance sheets and earnings visibility. At the same time, resilient employment data and stable consumer demand have helped contain downside risk, allowing buyers to engage at value rather than chase extension. The result has been a rotational and range bound market structure, reflecting cautious positioning and a wait and see approach, with RTY acting as a battleground between early year growth optimism and ongoing policy and financing constraints.
What the Market has done
• Market reversed higher and entered an uptrend after concerns surrounding Trump’s liberation day tariffs eased in April 2025.
• In July 2025, the market consolidated and formed bid block 1, which buyers used as a base to drive price higher toward the 2585 area, a key daily resistance established in 2021 and the 2024 yearly high.
• Sellers responded at the 2585 area and offered prices back down toward the 2440 area, aligning with daily support and the 24 Nov weekly HVN.
• Buyers attempted to defend the 2440 area but failed, resulting in a downside auction to the 2320 area, corresponding to the bid block 1 high.
• Buyers defended and initiated at the 2320 area, bidding prices back up to the 2585 area, where sellers remained active.
• Markets have since rotated between the 2585 and 2490 areas.
What to expect in the coming week
The key level to monitor is the 48650 area, which aligns with the previous week’s VPOC and the 15 December weekly Value Area High
Bullish scenario
• If the market is able to hold above the previous week’s settlement, an initial move toward the 2555 area is expected, which aligns with the 22 Dec weekly VAL, the 3 Dec weekly VAH, and the 0.5 weekly SD high.
• If price is able to accept above the 2555 area, continuation toward the 2585 area becomes likely.
• Sellers are expected to respond around the 2585 area based on prior failed auctions and higher timeframe resistance.
• If sellers fail to gain control, the market could extend higher toward the 2620 area, which marks the 8 Dec weekly high.
Neutral scenario
• In the absence of a major news or data catalyst, the market may continue to auction two ways
• A rotational consolidation between the 2490 and 2555 areas would signal continued balance and acceptance of value within this range.
Bearish scenario
• If buyers are unable to defend and hold the 2490 area, expect a move down toward the 2460 area, which aligns with the 1 weekly SD high.
• Continued selling pressure could cause markets to auction prices further down to the 2440 area, which remains a key daily support and the 24 Nov weekly HVN.
Conclusion
In conclusion, RTY remains in a balanced yet highly responsive state, with higher timeframe reference levels clearly defended and defended by both buyers and sellers. The 2490 area is the line in the sand for the coming week, and traders should remain flexible and responsive to acceptance or rejection around this zone. As always, patience and execution around key levels will matter more than prediction.
If you found this breakdown useful, feel free to give a boost, comment, or share your own levels and scenarios below.
Disclaimer: This is not financial advice. Analysis is for educational purposes only; trade your own plan and manage risk.
Rty1

Can the Russell 2000 Lead the Next Bull Wave Above Resistance?📊 RUSSELL 2000: The Ultimate Small-Cap Breakout Blueprint 🚀💰
🎯 Market Overview: IWM Russell 2000 Index Analysis
The Russell 2000 (RUT/IWM) is setting up for what could be a chef's kiss momentum play! 🧑🍳✨ We're tracking a bullish continuation setup backed by triangular moving average confluence and a classic pullback-to-breakout pattern. Small-caps are flexing, and this technical structure screams opportunity for swing and day traders alike.
📈 The Trade Setup (Swing/Day Strategy)
Bias: 🟢 BULLISH
Confirmation: Triangular moving average pullback + volume expansion
Key Level to Watch: 2550.0 (Overbought resistance zone breakout)
🎯 Entry Strategy: Layered Scaling Approach
Primary Entry: Post-breakout above 2550.0 ✅
⚡ Pro Tip: Set price alerts on your platform to catch the breakout in real-time without staring at charts all day!
Layered Entry Levels (Scaling In):
🔹 2500.0
🔹 2510.0
🔹 2520.0
🔹 2530.0
🔹 2540.0
This scaling approach allows you to build your position gradually while managing risk like a pro. 🧠💼
🛑 Risk Management Zone
Stop Loss: 2480.0 🔴
⚠️ Disclaimer: This is MY stop-loss based on technical structure. YOU manage your own risk tolerance! Trade smart, not reckless. Your capital, your rules. 💯
🎯 Profit Target Zone
Target: 2610.0 🎯💰
This zone represents confluence of:
Strong historical resistance
Overbought territory
Potential bull trap zone (watch for exhaustion!)
⚠️ Profit-Taking Note: Lock in gains as we approach target. Don't get greedy—pigs get fed, hogs get slaughtered! 🐷🔪 This is MY target, but YOU decide when to secure profits based on YOUR strategy.
🔗 Related Markets & Correlation Watch
Keep an eye on these correlated assets for confirmation:
Direct Exposure:
AMEX:IWM (iShares Russell 2000 ETF) - Primary tracking vehicle
TVC:RUT (Russell 2000 Index Futures)
Correlation Plays:
AMEX:SPY (S&P 500) - Broad market sentiment gauge
NASDAQ:QQQ (Nasdaq-100) - Tech/growth sector correlation
AMEX:DIA (Dow Jones) - Large-cap comparison
Key Correlation Note: Russell 2000 typically outperforms during risk-on environments and underperforms large-caps during risk-off. Watch for small-cap premium expansion as confirmation of bullish thesis. When IWM/IWM/
IWM/SPY ratio rises, small-caps are leading—bullish for RUT! 📊🔥
Economic Indicators:
TVC:DXY (US Dollar Index) - Inverse correlation (weak dollar = small-cap strength)
TVC:TNX (10-Year Treasury Yield) - Interest rate sensitivity
Regional bank stocks (small-cap economy proxy)
🔑 Key Technical Points
✅ Triangular MA Pullback Complete - Classic retest of support
✅ Volume Profile - Accumulation zone established
✅ 2550.0 Resistance - Break and hold = explosive upside
✅ Risk/Reward Ratio - ~1:1.5+ (70 points risk / 110+ points reward)
✅ Timeframe Alignment - Multi-timeframe confluence supporting the move
⚡ The Thief's Edge: Why This Setup Works
Small-caps are the wild horses of the market—volatile, fast, and rewarding when you ride the trend! 🐎💨 The Russell 2000 represents domestic US growth plays, making it hyper-sensitive to:
Economic optimism cycles
Federal Reserve policy shifts
Risk appetite rotations
This setup capitalizes on momentum continuation after a healthy pullback. We're not catching falling knives—we're riding tested support into breakout territory! 🎯
🧠 Trading Psychology Corner
Remember, folks: The market doesn't care about your entry price. It only cares about supply and demand. Manage risk, scale into winners, and cut losers fast. This isn't financial advice—this is a battle-tested framework for market participants who understand probability over certainty. 🎲📉📈
🙏 Support the Analysis!
✨ If you find value in my analysis, a 👍 and 🚀 boost is much appreciated — it helps me share more setups with the community!
#Russell2000 #RUT #IWM #SmallCaps #TechnicalAnalysis #SwingTrading #DayTrading #Breakout #TriangularMA #MomentumTrading #StockMarket #IndexTrading #TradingStrategy #ChartAnalysis #PriceAction #SupportAndResistance #BullishSetup #TradingView #MarketAnalysis #RiskManagement
Stay sharp, trade smart, and let's catch this wave together! 🌊💰

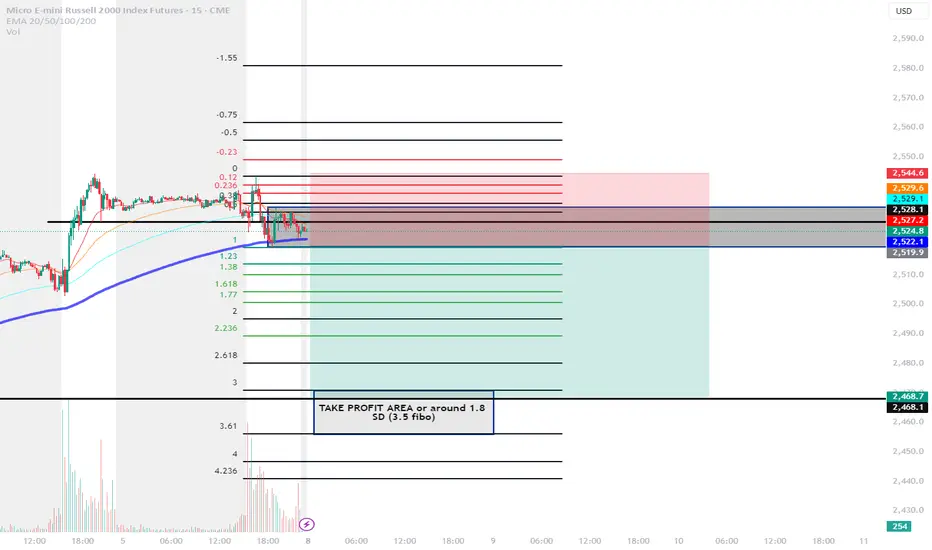
Short RTY, M2K IdeaI believe if we broke the box to the downside. A huge selloff will happen to 1.5 Standard deviation or 3 Fibonacci level drawn from Friday range
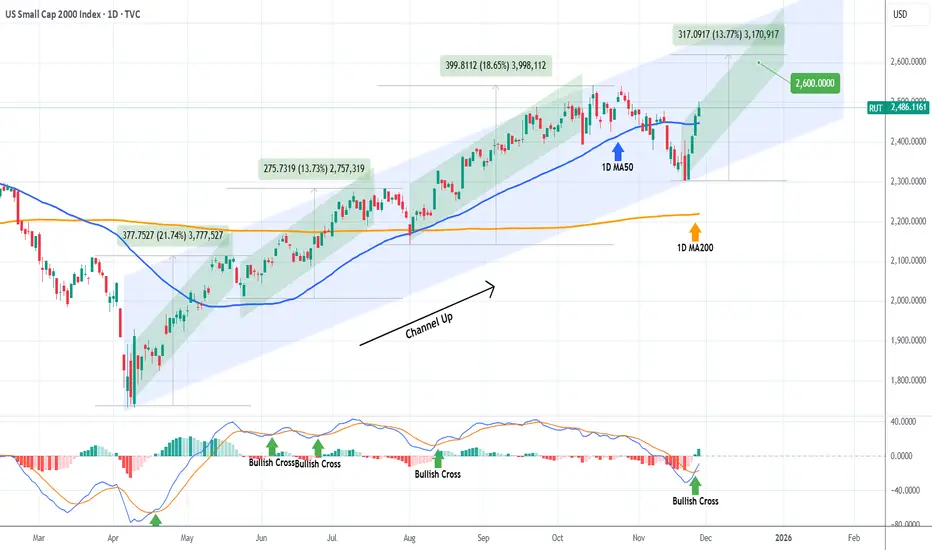
RUSSELL targeting 2600 on this Bullish Leg.Russell 2000 (RUT) has been trading within an 8-month Channel Up since the April 07 market bottom and following its latest correction (Bearish Leg), it recovered this week its 1D MA50 (blue trend-line), having already started the new Bullish Leg.
The minimum rise a Bullish Leg had within this pattern has been +13.73%. As a result, we expect the current one to hit at least 2600. Notice also the 1D MACD Bullish Cross, which has always been a confirmation of a new rally.
---
** Please LIKE 👍, FOLLOW ✅, SHARE 🙌 and COMMENT ✍ if you enjoy this idea! Also share your ideas and charts in the comments section below! This is best way to keep it relevant, support us, keep the content here free and allow the idea to reach as many people as possible. **
---
💸💸💸💸💸💸
👇 👇 👇 👇 👇 👇
How to Identify Stocks Uptrends and Downtrends to Gain a TradingHow to Identify Stocks Uptrends and Downtrends to Gain a Trading Edge and understand the psychology behind the patterns

RUSSELL 25-year Channel Up giving a Sell Signal soon.Russell 2000 (RUT) has been trading within a 25-year Channel Up since the March 2000 High, which was the Top of the A.I. Bubble. Since then it only broke once during the 2008 Housing Crisis. Once recovered, it has used all standard macro levels of Support as short, medium and long-term buy entries respectively, with those being the 1M MA50 (blue trend-line), the 1M MA100 (green trend-line) and the 1M MA200 (orange trend-line).
The April 2025 rebound, which is the market's most recent rally, took place right on the 1M MA100. The index is however approaching the 0.236 Fibonacci level of the Channel Up, which since the 2000 High, has provided almost all rejection points, being the strongest Sell Signal (exception 2021, which was the mega-pump recovery following the March 2020 COVID flash crash).
As you can see, the market has historically started a correction on the 2nd test/ rejection on the 0.236 Fib. Out of those 3 corrections, two of them took place after the index broke above the 0.236 Fib and one just below it. All however have pulled-back to at least the 0.382 (blue) Fib. The key here however is to determine the exact High so that you can draw the 0.382 Fib retracement.
The only condition that most likely won't be fulfilled (as it happened on all previous cases), is that the 1M RSI most likely won't break above the 70.00 overbought level before the correction happens. So there's question mark there.
As for our Target, we expect at least 2230 (Fib 0.382) to get hit around mid 2026.
-------------------------------------------------------------------------------
** Please LIKE 👍, FOLLOW ✅, SHARE 🙌 and COMMENT ✍ if you enjoy this idea! Also share your ideas and charts in the comments section below! This is best way to keep it relevant, support us, keep the content here free and allow the idea to reach as many people as possible. **
-------------------------------------------------------------------------------
💸💸💸💸💸💸
👇 👇 👇 👇 👇 👇

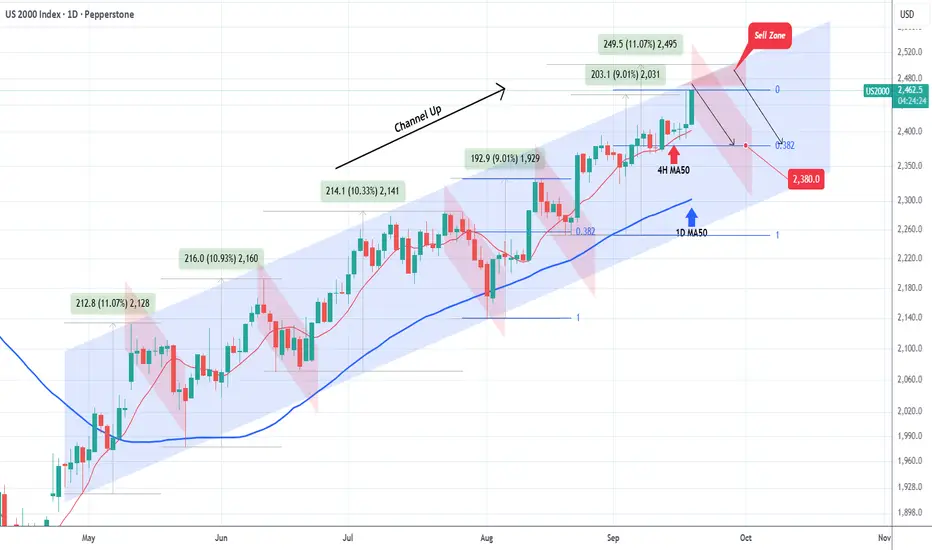
RUSSELL Will it correct this time also?Russell 2000 (RUT) has been trading within a Channel Up since late April and right now its current Bullish Leg is about to test the pattern's top (Higher Highs trend-line).
It has completed a +9.01% rise from the August 20 Low, which is the same increase of the previous (August 01 - 13) Bullish Leg and that has been the 'weakest' one out of all Legs of the Channel Up (+11.07%, +10.93% and +10.33% the others).
As a result, we can start thinking about taking profits on this run and an upcoming new pull-back (red Bearish Leg/ Channel Down) within a Sell Zone that extends up to +11.07% (2500).
Within this Zone, any rejection we get, we are targeting 2380, which is the 0.382 Fibonacci retracement level applied on the minimum +9.01% rally.
-------------------------------------------------------------------------------
** Please LIKE 👍, FOLLOW ✅, SHARE 🙌 and COMMENT ✍ if you enjoy this idea! Also share your ideas and charts in the comments section below! This is best way to keep it relevant, support us, keep the content here free and allow the idea to reach as many people as possible. **
-------------------------------------------------------------------------------
💸💸💸💸💸💸
👇 👇 👇 👇 👇 👇
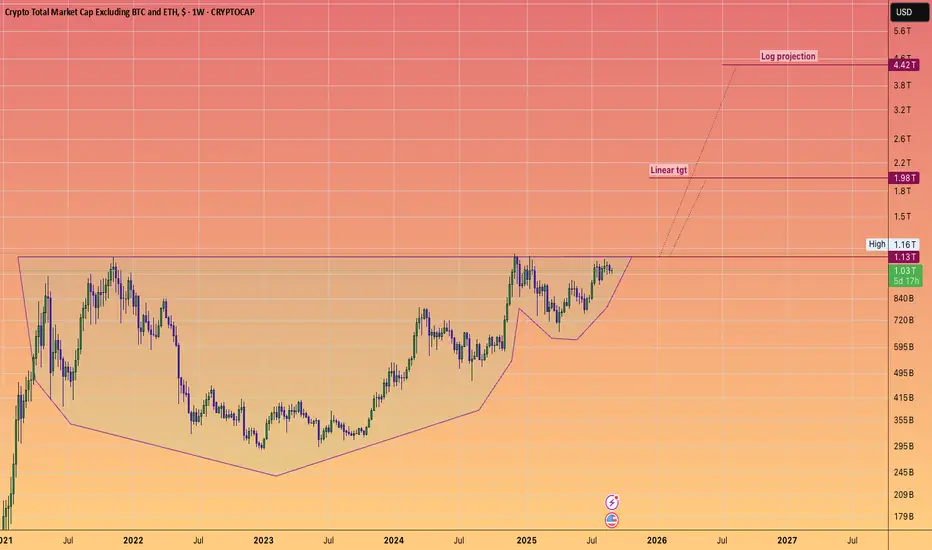
***REMINDER*** of the TOTAL 3 Targets.We are on the cusp of price discovery in many key assets that will contribute to the upcoming alt season.
The Russell 2000 #RTY is close to all time highs..
#GOLD is charging ahead which often pulls up ~BTC
#ETHEREUM hit a new all time already and retraced ... so the next break above will likely see price discovery and vacuum price action to fib extension around $7.5k
#BTCd dominance has topped.
This cup and handle for Total 3 has been a long time in the making which suggests a powerful move is likely to occur.
$IWM, small caps, not YET giving the "all clear"AMEX:IWM is the lone index still not in the clear 🚩 — backtesting its 200dma today and tagging the weekly mid-BB , just like in '22. Will it matter by week's end? If not, the bull is likely back across the board 🐂
This week's #CPI (Consumer Price Index) and #PPI (Producer Price Index) prints could significantly influence market direction across major indices — AMEX:SPY , NASDAQ:QQQ and AMEX:IWM — especially with rate cut expectations in flux. 🧵Here's how:
1. Hot CPI or PPI (above expectations):
AMEX:SPY : Likely to pull back as sticky inflation pressures broader S&P names, especially rate-sensitive sectors like real estate and utilities.
NASDAQ:QQQ : Could see sharper downside—tech stocks (many of which are high duration assets) are highly sensitive to interest rate expectations.
AMEX:IWM : Likely the hardest hit. Small caps suffer from tighter financial conditions and depend more on domestic borrowing costs.
🟥 Result: Bearish across the board, with small caps underperforming.
2. Cool CPI or PPI (below expectations):
AMEX:SPY : Broad lift, particularly in consumer discretionary and financials.
NASDAQ:QQQ : Strong rally—mega cap tech loves the prospect of lower yields.
AMEX:IWM : Outperforms if cooling inflation suggests easing ahead, since it's more leveraged to rate cycles and domestic growth.
🟩 Result: Bullish, with small caps possibly leading a relief rally.
3. In-line CPI/PPI :
Markets may stay choppy or consolidate, with AMEX:SPY and NASDAQ:QQQ more stable.
AMEX:IWM remains at risk of drifting lower unless there’s a strong dovish narrative from the Fed or other macro catalysts.
With small caps already lagging, this week’s inflation data could either validate its bearish divergence or spark a rotation rally if inflation
AMEX:SPY NASDAQ:QQQ TVC:VIX $ES_F $NQ_F $RTY_F TVC:TNX NASDAQ:TLT TVC:DXY #Tariffs #Stocks

RUSSELL 15-year Cyclical pattern calls for enormous growth.Russell 2000 (RUT) made a massive rebound on last month's candle on the 1M MA100 (green trend-line), closing above it and maintaining the long-term price action above this Support since the March 2020 COVID crash.
Practically that was the only time the 1M MA100 broke since the October 11 recovery, which was the start of a 15-year Cyclical Pattern that initiates Bull Cycles after 1M MA50 (blue trend-line) ad then 1M MA100 rebounds that peak on the 2.0 Fibonacci extension.
Last month's rebound sets the stage for a post-COVID type recovery, especially if the Fed cuts the Interest Rates on their next meeting. The 2.0 Fibonacci extension is a little bit over 3500, which is our long-term Target.
-------------------------------------------------------------------------------
** Please LIKE 👍, FOLLOW ✅, SHARE 🙌 and COMMENT ✍ if you enjoy this idea! Also share your ideas and charts in the comments section below! This is best way to keep it relevant, support us, keep the content here free and allow the idea to reach as many people as possible. **
-------------------------------------------------------------------------------
💸💸💸💸💸💸
👇 👇 👇 👇 👇 👇

RUSSEL / IWM IDEAovernight bounce off 15m demand im sized im very lightly due to it being an over night trade (I have a high loosing percentage trading Asia Session.) Simple play if volatility can kick in towards London/NY session. No PT if this starts working, I will just let it run until 5m structure is broken.

This RUT/NDX ratio may convince you to buy NASDAQ aggressively.Nasdaq (NDX) has been under heavy selling pressure in the past 30 days. This short-term pull-back however is nothing but a buy opportunity on the long-term, and this study shows you why.
The answer lies on the RUT/NDX ratio which shows that this may be the time to get heavier on tech. The use of the Russell 2000 index (RUT) is due to the fact it represents a wider array of companies. Naturally over the years (this 1M chart shows data since 2006), the ratio declines within a Channel Down as historically the riskier tech sector attracts more capital and grows more.
However there are instances where Russell gains more against Nasdaq. We are currently though at a time where this isn't the case as the ratio seems to be ready for decline following the completion of a consolidation that on previous fractals (March 2015, September 2008) was bearish, thus positive for Nasdaq.
As you can see, this movements can be grasped by the Sine Waves, though not perfectly, but still good enough to understand the cyclical pattern we're in, also with the help of the 1M RSI Triangles.
Nasdaq (which is represented by the blue trend-line) has started massive expansion Channel Up patterns following this unique signal given by the RUT/NDX ratio. The first was right after the 2009 Housing Crisis bottom and the second during the 2015/ 2016 E.U., VW and Oil crisis.
The key here is on the 1M RSI. The Triangle is about to beak to the upside and every time this happened in the last 20 years, it coincided with a pull-back on Nasdaq (blue circle) similar to the current one. What followed was massive rallies each time.
As a result, this could be an indication that even though the tariffs have rattles investor confidence lately, this is an opportunity for a strong buy position for at least the rest of the year.
-------------------------------------------------------------------------------
** Please LIKE 👍, FOLLOW ✅, SHARE 🙌 and COMMENT ✍ if you enjoy this idea! Also share your ideas and charts in the comments section below! This is best way to keep it relevant, support us, keep the content here free and allow the idea to reach as many people as possible. **
-------------------------------------------------------------------------------
💸💸💸💸💸💸
👇 👇 👇 👇 👇 👇

QUICK LOOK AT A FEW INDICATORS AND INTEREST IN A SERIES?Quick overview testing out the upload from a browser on a ethernet connection computer vs wifi with the desktop downloaded app. Do you find value in this and want to make a regular series? Contact me if so and follow. Esp if your a developer and want to add some videos to your products, free, locked or paid. Im game. Platforms, customization and breaking down analytics is the life. Its what i enjoy and maybe you will too!
Thank you All,
DrawDownKing CME_MINI:ES1!

ES NQ AND RTY ROTATION PATTERNS AND AREAS FOR SHORT AND LONG Areas of interest on NQ RTY and ES for short and long with the rotation levels and patterns in play

ES NQ AND RTY FUTURES RECAP AND LEVSL OF INTERESTLevels of interest on Nq RTY and Es futures and what may lie ahead.

ES NQ AND RTY FUTURES SHORTSIDE MOVE WITH TARGETS HIT Targets hit and levels to watch on es nq and rty futures. Enjoy the show :)

RUSSELL 15-year Cycles holding perfectlyIt has been 6 months ago (August 15, see chart below) when we updated our long-term call on Russell 2000 (RUT) based on a 15-year Cyclical pattern:
As you can see, since we introduced this long-term commitment on Russell back on October 07 2023, the index made a remarkable recovery and now the final step is to break above the previous All Time High (ATH) and turn it into the long-term Support.
That is what happened on all 3 of its previous Cycles (only broken temporarily during the COVID flash crash). As long as the 1M MA50 (blue trend-line) holds, we expect the pattern to hold once more and fulfil the 2.0 Fibonacci extension condition as the near Cycle Top. Our long-term Target remains 3500.
-------------------------------------------------------------------------------
** Please LIKE 👍, FOLLOW ✅, SHARE 🙌 and COMMENT ✍ if you enjoy this idea! Also share your ideas and charts in the comments section below! This is best way to keep it relevant, support us, keep the content here free and allow the idea to reach as many people as possible. **
-------------------------------------------------------------------------------
💸💸💸💸💸💸
👇 👇 👇 👇 👇 👇

ES NQ AND RTY QUICK UPDATE AND LEVELS TO PLAYLevels to watch on es nq and rty and whats ahead. Key levels of support and resistance explained

ES NQ AND RTY FUTURES SHORTSIDE TARGTS AND RANG TO EXPECTQuick look at es nq and rty futures and what to expect

ES NQ AND RTY FUTURES LOOK AT TODAY with TARGETSQuick look at ES NQ and RTY with full extension and dropside targets. Prio video from earlier today never uploaded.

ES NQ AND RTY FUTURES QUICK OVERVIEW OF TODAY and LEVELS Areas of major interest from last nights and todays futures session. High probability levels to keep a close eye on for further developments.

RTY NQ AND ES FUTURES QUICK LOOK AND LEVELS TO WATCH FORQuick look at ES NQ and RTY futures levels and areas of interest

RUSSELL 2000 One last Resistance remains before mega rally.Russell 2000 (RUT) gave us an excellent buy signal on our last analysis (October 22 2024, see chart below) exactly on the 1D MA50 and within 5 weeks it hit our 2465 Target:
The price almost immediately pulled back, showing the efficiency of our Target placement and the pattern that has now prevailed is the Channel Up that started more than a year ago (October 27 2023).
The recent Higher Low of this pattern was exactly on the 1D MA200 (orange trend-line), the pattern's bottom. The 1D RSI showcased a Bullish Divergence (Higher Lows) against the price's Lower Lows as an early buy signal, which was confirmed on the January 14 2024 1D MACD Bullish Cross. As you can see, all Bullish Crosses below a 0.0 MACD, have been technical buy signals.
What remains is for the price to break above the 1D MA50 (blue trend-line), which is the level that is causing a rejection today. Once recovered, we expect the index to complete at least a +21% rally from the recent bottom, the minimum of the previous 3 rallies, and target 2600.
-------------------------------------------------------------------------------
** Please LIKE 👍, FOLLOW ✅, SHARE 🙌 and COMMENT ✍ if you enjoy this idea! Also share your ideas and charts in the comments section below! This is best way to keep it relevant, support us, keep the content here free and allow the idea to reach as many people as possible. **
-------------------------------------------------------------------------------
💸💸💸💸💸💸
👇 👇 👇 👇 👇 👇
