Why Chase the Wind?Some like running. Others like direction. Some just want to feel the breeze again. You will long for the past and try to repeat what you did to succeed, only to realize that nothing lasts forever.
I don't think this pattern of lower lows in percentages of bullish stocks, and higher lows in bitcoin price, will last forever. If money printing stops and lending dries up, maybe bitcoin will go sideways for a while? Although institutional selling has happened, did the crowd sell yet? I don't know. If it did, maybe the green divergence pattern plays out, otherwise the red might come true?
Considering that we reached 17% of stocks bullish, that could seem like some sort of bottom, as was the case in 2015. But this entire chart is focused on a bull equities market, and so it is not reasonable to adjust our expectations towards past results. In my opinion, we should only use it as a reference of severity or volatility. Lately there is this pattern of lower lows in the Percentage of Stocks, and if the market is truly bearish, we should get a low that is lower than 17%, the current low, as seems to be implied in the chart in a megaphone-like pattern (grey line). Maybe it won't go to 6% like in 2020, but I have a hard time believing that. What was going to play out then, clearly has not yet played out and was delayed via bailouts. One might consider that because of the severe volatility 2020, it is not reasonable to expect a lower low in the percentage of stocks, which I think is a reasonable consideration, but it is not clear yet if the bearish momentum has finished playing out in terms of stock prices, especially large caps.
Bitcoin price wise, I think we could linger on a bit here as neither bearish or bullish, but unless we make a higher low in the next few months (boring scenario, green), it will dip lower(red). I think 18.5k is a decent bottom for the neutral/bullish view(green), and ~6-12k is a decent bottom for the bearish view(red).
What scenario do you think will play out? Personally, I just want to wait and see if we set a bottom here, but there's been a big gamma squeeze the past few days and I closed out most of my longs in the past few days out of discomfort. So, not necessarily short, but not long either. There's a lot of uncertainty here and it's always good to take profit while you are ahead.
I like using the "Percentage of stocks" type symbols, it's a nice litmus test for the market. Hopefully you will find them useful. Some are not links but these are all symbols under the INDEX: category
200 day
MMTH
S5TH
R2TH
NDTH
50 day
MMFI
S5FI
R2FI
NDFI
20 day
MMTW
S5TW
R2TW
NDTW
Take care and don't forget to hedge your bets!
-your fringe chartist
RUSSELL 2000

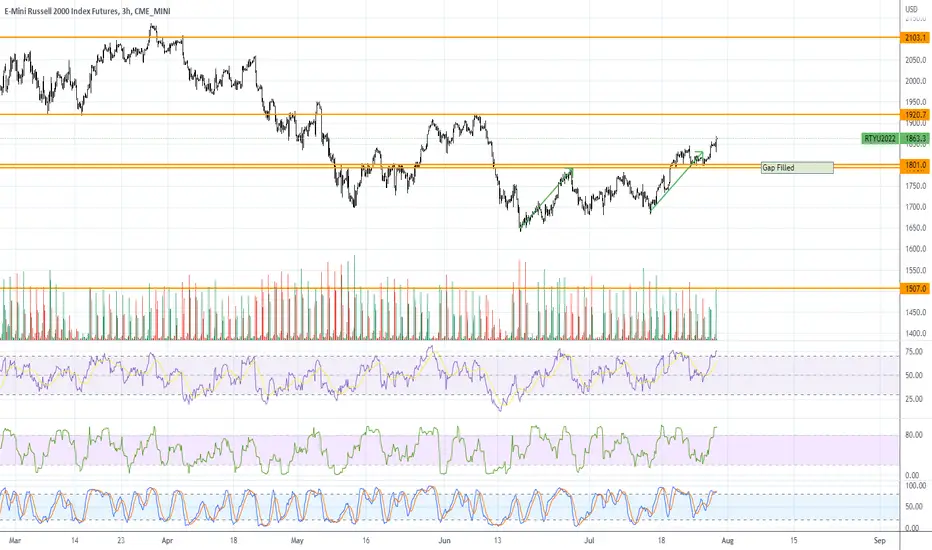
RTY UpdateUnlike ES and NQ, RTY already hit oversold, and small caps tend to fill gaps. I'm looking at a bunch of crap stocks like W that seem to be acting like they want to fill the gap tomorrow or Monday.
IWM is probably your best bang for the buck if you're bullish on indices.
I would stay away from meme stocks, though it could be an up day for those as well.

RTY UpdateThe melt up and short squeeze continues. I have it continuing until next Tuesday when RTY hits the resistance zone.
I don't normally play melt ups but bought some AMC calls for kicks and giggles on the dips this morning. If the market is acting stupid, then you need to be stupid too, lol. The only way to make money is to go with the flow.
Prediction is up tomorrow, a dip Thu and Friday open, then full pumptardedness until Tuesday.

RTYIs the melt up over? Seems like RTY rolled over, and the squeeze appears to be over except meme stocks like AMC

8/10/22 URAGlobal X Uranium ETF ( AMEX:URA )
Sector: Miscellaneous (Investments Trusts/Mutual Funds)
Market Capitalization: $ --
Current Price: $21.60
Breakout Price: $21.80
Buy Zone (Top/Bottom Range): $21.45-$19.85
Price Target: $22.80-$23.20 (1st), $25.90-$26.50 (2nd)
Estimated Duration to Target: 30-32d (1st), 99-106d (2nd)
Contract of Interest: $URA 9/16/22 22c, $URA 10/21/22 22c
Trade price as of publish date: $1.05/contract, $1.50/contract

RUT scenariosRed arrow pretty much dialled in for me
Grey possible but unlikely
Going over 2k
NOT TARDING ADVICE
ps i'll get my coat

Keeping It SimpleThere's so much going on right now, but I think this chart sums it up for assets in general. This is a fairly simple idea I fantasized a while ago and it played out to my surprise. Every once and a while, the percentage of bullish stocks doubles, and then a selloff happens. Unless we can break this symmetry and make a clear break above 25, we should not expect anything special. It's easy to fomo in but possibly the best move is to move to other markets.
Also note the severity of the 2020 dump, before being launched by money supply expansion, among others:
We did not yet meet the level of the 2020 crash. Also, there is no money supply expansion this time. So, what would have happened in 2020 or perhaps 2008, should really happen this time, unless of course there is more money supply expansion.
Cheers and don't forget to hedge your bets!

RTY UpdateOverbought again after the morning dip, looks like a melt up and 4 day short squeeze so not shorting anything at the moment aside from the put leg of my BITO strangle. Calls are now in the money so hopefully crypto goes pumptarded on Ponzi payday Friday.
I'm 75% sure this is a melt up, but if you're long I suggest some protection.
7/27/22 FFord Motor Co ( NYSE:F )
Sector: Consumer Durables (Motor Vehicles)
Market Capitalization: 53.023B
Current Price: $13.19
Breakout price: $13.55
Buy Zone (Top/Bottom Range): $12.60-$10.90
Price Target: $14.80-$15.40 (1st), $17.90-$18.30 (2nd)
Estimated Duration to Target: 28-30d (1st), 70-74d (2nd)
Contract of Interest: $F 8/19/22 14c, $F 12/16/22 15c
Trade price as of publish date: $0.32/contract, $0.75/contract

7/27/22 QQQInvesco QQQ Trust, Series 1 ( NASDAQ:QQQ )
Sector: Miscellaneous (Investment Trusts/Mutual Funds)
Market Capitalization: $ -- B
Current Price: $306.81
Breakout Price: $308.90
Sell Zone (Top/Bottom Range): $298.80-$275.70
Price Target: $321.30-$323.90 (1st), $337.60-$344.90 (2nd)
Estimated Duration to Target: 33-35d, 69-72d
Contract of Interest: $QQQ 9/16/22 310c, $QQQ 9/16/22 310c
Trade price as of publish date: $6.20/contract, $10.27/contract

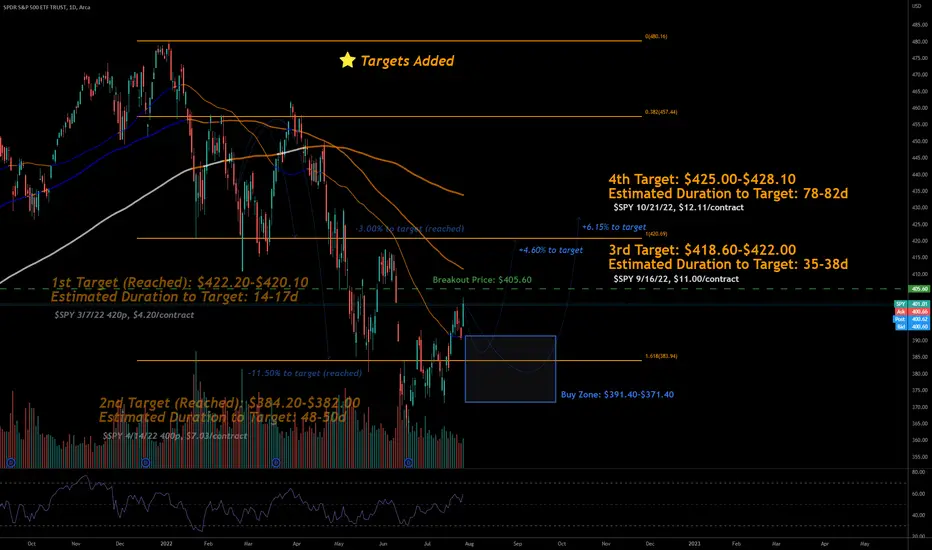
7/27/22 SPYSPDR S&P 500 ETF Trust ( AMEX:SPY )
Sector: Miscellaneous (Investment Trusts/Mutual Funds)
Market Capitalization: $ -- B
Current Price: $401.01
Breakout Price: $405.60
Sell Zone (Top/Bottom Range): $391.40-$371.40
Price Target: $418.60-$422.00 (3rd), $425.00-$428.10 (4th)
Estimated Duration to Target: 35-38d (3rd), 78-82d (4th)
Contract of Interest: $SPY 9/16/22 405c, $SPY 10/21/22 410c
Trade price as of publish date: $11.00/contract, $12.11/contract
RUT Playing out as expected (expect mini rally)Last year I posted a contrarian view on RUT, although it took a while to play out. I am expecting a mini rally before we sell off for the A wave to complete.
Please do your DD as this is not an investment advise.

S&P similarities to previous down turn showing up in marketsWith all the money printing, it is hard to see the stock market crashing but the similarities in charts are just to obvious to ignore.
Last year, I also pointed out the patterns I was seeing in Russel (see below) and so far it has been exactly.
Please do you own DD as this is not an investment advise.

RTY UpdateRTY remains the only index futures with an open gap, but it looks like it's coiling.
Not really sure what the heck this market is doing, might be easier to buy back in when it goes oversold again since it still needs a gap fill. I think I'm gonna take a break this week.

7/17/22 CELHCelsius Holdings, Inc. ( NASDAQ:CELH )
Sector: Consumer Non-Durables (Beverages: Non-Alcoholic)
Market Capitalization: $6.095B
Current Price: $80.87
Breakout price: $83.00
Buy Zone (Top/Bottom Range): $74.90-$67.00
Price Target: $89.10-$91.60 (1st), $121.00-$124.10 (2nd)
Estimated Duration to Target: 57-60d (1st), 180-189d (2nd)
Contract of Interest: $CELH 9/16/22 85c, $CELH 1/20/23 100c
Trade price as of publish date: $9.60/contract, $11.30/contract

RTY UpdateMFI went oversold this morning, and you can see RTY is coiling.
CPI release tomorrow morning before market open, the market tanked before the last release, so if it doesn't tank before EOD it's a bullish sign.
Normally I would say this is a continuation pattern, but the algos need to fill he open gap. If it breaks upwards then the target is the resistance zone, upper orange line. Plan accordingly.
If you're short, you'll want to bail tomorrow if the market goes green at all. I'm all cash, even garbage will float on a rising tide. Wouldn;t surprise me at all if they pump even shitcoin.

Not Cheap YetSome people say that things are getting cheap. I agree, they are in the process of getting cheap, but we're not quite there yet as far as historical bottoms go. The Russell isn't that cheap yet, still twice as expensive as in 2009. Unless a true miracle happens, it's hard to see any upside in this market as far as real wealth terms(as opposed to numerical price increase) in the near future. On the contrary, we have seen much further downsides in the past. We might see a reflexive bounce in the future and a bear market rally, though we are in a steep downward momentum.
Good luck and don't forget to hedge your bets!

RTY UpdateThis morning's selloff sent all indicators to neutral. Everything was overbought last week in a weird melt up.
ES, NQ, RTY all have similar indicator patterns. I'm hoping the indicators start cycling from overbought to oversold again, because that's the easiest time to make money.
I get the weird feeling we see a bounce tomorrow then only a mild drop Wed, but who knows. Market could completely tank again, lol, but at this point I think 75 is priced in for the next Fed meeting. This week is all about the CPI and market reaction to it. I don't think indicators will matter much.
Really don't feel like trading this week. I shifted my BITO (shitcoin) puts to a lower strike and next week's expiration since BTC tends to tank on weekends and CPI numbers coming out Wed. Just a small play, a couple grand including today's profits.

Joe Gun2Head Trade - Short term bottom on Russell2000?Trade Idea: Selling EURJPY
Reasoning: EURJPY to continue lower? Broken trend and EUR under pressure
Entry Level: 1752
Take Profit Level: 1794
Stop Loss: 1741.5
Risk/Reward: 4.15:1
Disclaimer – Signal Centre. Please be reminded – you alone are responsible for your trading – both gains and losses. There is a very high degree of risk involved in trading. The technical analysis , like all indicators, strategies, columns, articles and other features accessible on/though this site is for informational purposes only and should not be construed as investment advice by you. Your use of the technical analysis , as would also your use of all mentioned indicators, strategies, columns, articles and all other features, is entirely at your own risk and it is your sole responsibility to evaluate the accuracy, completeness and usefulness (including suitability) of the information. You should assess the risk of any trade with your financial adviser and make your own independent decision(s) regarding any tradable products which may be the subject matter of the technical analysis or any of the said indicators, strategies, columns, articles and all other features.

Daily Market Update for 7/8Summary: Employment data on Friday showed a better-than-expect labor market with Payrolls far exceeding the forecast. The strong labor market opens the door for the Fed to continue its aggressive rate hikes to control inflation.
Notes
Ideas always welcome in the comments. Errors will be amended as comments on TradingView or corrected inline in my blog.
-=x=-=x=-=x=-=x=-=x=-=x=-=x=-
Friday, July 8, 2022
Facts: +0.12%, Volume lower, Closing Range: 74%, Body: 63% Green
Good: Higher high, higher low, good closing range
Bad: Lower volume on gain
Highs/Lows: Higher high, Higher low
Candle: Medium green body with long upper wick, tiny lower wick
Advance/Decline: 0.96, slightly more declining stocks than advancing stocks
Indexes: SPX (-0.08%), DJI (-0.15%), RUT (-0.01%), VIX (-5.52%)
Sector List: Health (XLV +0.30%) and Technology (XLK +0.05%) at the top. Communications (XLC -0.47%) and Materials (XLB -0.98%) at the bottom.
-=x=-=x=-=x=-=x=-=x=-=x=-=x=-
Market Overview
Employment data on Friday showed a better-than-expect labor market with Payrolls far exceeding the forecast. The strong labor market opens the door for the Fed to continue its aggressive rate hikes to control inflation.
The Nasdaq rose by +0.12% while the other major indexes fell. The candle has a 63% green body underneath a long upper wick resulting in a 74% closing range. Volume was lower than the previous day. There were slightly more declining stocks than advancing stocks.
The Dow Jones Industrial Average (DJI) declined by -0.15%. The S&P 500 (SPX) fell by -0.08%. The Russell 2000 (RUT) closed the day flat, declining just -0.01%.
Only three of the eleven S&P sectors gained. Health (XLV +0.30%) and Technology (XLK +0.05%) were the best two sectors for the day. Communications (XLC -0.47%) and Materials (XLB -0.98%) had the biggest losses.
Nonfarm Payrolls for June grew by 372,000 compared to the consensus forecast of 268,000. The Unemployment Rate remained at 3.6%.
The US Dollar Index (DXY) fell by -0.13%. US 30y, 10y, and 2y Treasury Yields rose. High Yield (HYG) Corporate Bond prices gained while Investment Grade (LQD) Corporate Bond prices followed Treasuries lower. Brent Oil rose to $105 a barrel.
The VIX Volatility Index (VIX) fell by -5.52%. The put/call ratio (PCCE) rose to 0.768. The CNN Fear & Greed Index inched further from Extreme Fear, but is still in the Fear range, far from Neutral.
Three of the big six mega-caps gained. Tesla (TSLA) had the best gain, advancing by +2.54%. The stock had further gains after hours as news hit that Elon Musk pulled out of the Twitter purchase. Meta (FB) had the biggest decline of the six, falling by -0.76%. Five of the six closed above their 21d EMA and 50d MA.
Tesla also topped the broader mega-cap list. Alibaba (BABA) was at the bottom of that list with a -1.22% decline.
Enphase Energy (ENPH) was the best stock in the Daily Update Growth List, gaining by +4.65% Friday. Twitter (TWTR) was at the bottom of the list, declining by -5.10%. Twitter moved lower after hours for the same reason Tesla moved higher.
-=x=-=x=-=x=-=x=-=x=-=x=-=x=-
Looking ahead
There are no significant economic news or earnings reports scheduled for Monday.
-=x=-=x=-=x=-=x=-=x=-=x=-=x=-
Trends, Support, and Resistance
The Nasdaq briefly rose above the 50d moving average but closed below the line.
If the five-day trend line continues into Monday, that would mean a +2.29% gain.
A continuation of the one-day trend line points to a +0.54% gain.
Returning to the trend line from the 6/16 low would result in a -1.15% decline to start the week.
-=x=-=x=-=x=-=x=-=x=-=x=-=x=-
Wrap-up
Analysts are needing to reconsider again what actions the Fed might take considering a much stronger labor market than they initially expected. Despite news of big tech hiring freezes, payrolls grew in June as other sectors continue to hire.
Stay healthy and trade safe!

RUT 1M V1 FUNThe Russell 2000 Index is a small-cap stock market index that makes up the smallest 2,000 stocks in the Russell 3000 Index . It was started by the Frank Russell Company in 1984. The index is maintained by FTSE Russell, a subsidiary of the London Stock Exchange Group.

Daily Market Update for 7/7Summary: Markets had a fourth day of gains for July, starting off the month green as analysts continue to judge if and when a recession will hit. Wells Fargo says the recession is already here.
Notes
Ideas always welcome in the comments. Errors will be amended as comments on TradingView or corrected inline in my blog.
-=x=-=x=-=x=-=x=-=x=-=x=-=x=-
Thursday, July 7, 2022
Facts: +2.28%, Volume lower, Closing Range: 90%, Body: 86% Green
Good: Price rally all-day, high closing range, advance/decline ratio
Bad: Lower volume
Highs/Lows: Higher high, Higher low
Candle: Mostly green body, tiny upper and lower wicks.
Advance/Decline: 2.21, more than two advancing stocks for every declining stock
Indexes: SPX (+1.50%), DJI (+1.12%), RUT (+2.43%), VIX (-2.43%)
Sector List: Energy (XLE +3.61%) and Consumer Discretionary (XLY +2.58%) at the top. Real Estate (XLRE +0.07%) and Utilities (XLU -0.10%) at the bottom.
-=x=-=x=-=x=-=x=-=x=-=x=-=x=-
Market Overview
Markets had a fourth day of gains for July, starting off the month green as analysts continue to judge if and when a recession will hit. Wells Fargo says the recession is already here.
The Nasdaq climbed by +2.28% but on lower volume than the previous day. The 86% green body is in between two tiny wicks as the index closed the day with a 90% closing range. Prices rose throughout the day. There were more than two advancing stocks for every declining stock.
Small caps led the day. The Russell 2000 (RUT) gained +2.43%. The S&P 500 (SPX) rose by +1.50% and the Dow Jones Industrial Average (DJI) advanced by +1.12%.
Ten of the eleven S&P sectors gained. Energy (XLE +3.61%) and Consumer Discretionary (XLY +2.58%) were the top two sectors. Utilities (XLU -0.10%) was the only sector to decline.
Weekly Initial Jobless Claims were at 235,000, slightly worse than the consensus forecast of 230,000. The Trade Balance for May was at -85.50 billion, worse than the expected -84.90 billion. Crude Oil Inventories were much higher than expected, with 8.2 million barrels of excess for the week compared to the expectation for a -1 million-barrel shortfall.
The US Dollar index (DXY) held its current level, declining by only -0.01% today. US 30y, 10y, and 2y Treasury Yields rose for a second day. High Yield (HYG) Corporate Bond prices advanced, narrowing the gap with short-term treasuries. Investment Grade (LQD) Corporate Bond prices were flat for the day. Brent Oil rose back above $100 a barrel.
The VIX Volatility index declined by -2.43%. The put/call ratio (PCCE) fell to 0.755. The CNN Fear & Greed Index moved into the Fear range. The NAAIM money manager exposure index declined to 27.85.
All big six mega-caps gained today with Tesla (TSLA) leading the pack, rising by +5.53%. All six closed above their 21d EMA and four of the six closed above their 50d MA.
Taiwan Semiconductor (TSM) was the best mega-cap for the day, gaining +6.74%. Verizon Communications (VZ) declined by -1.55% to end up at the bottom of the list.
In the Daily Update Growth List, it was Fastly (FSLY) with the best gain, advancing by +10.13%. The only declining stock on the list was DataDog (DDOG) which fell by -0.31%.
-=x=-=x=-=x=-=x=-=x=-=x=-=x=-
Looking ahead
Tomorrow is the monthly employment data Friday. Nonfarm Payrolls and the Unemployment Rate are top indicators of the health of the labor market. The data will be released before the market opens.
-=x=-=x=-=x=-=x=-=x=-=x=-=x=-
Trends, Support, and Resistance
The Nasdaq rose throughout the day to close just below the 50d MA.
If the one-day trend line continues, that would meet up with the five-day trend line for a +1.03% gain tomorrow and a close above the 50d MA.
If the index returns to the trend line from the 6/16 low, that would mean a -1.80% decline for Friday.
-=x=-=x=-=x=-=x=-=x=-=x=-=x=-
Wrap-up
Investors are likely looking for mediocre to worse labor market data for Friday. Worse-than-expected employment data could mean a more dovish fed in 2023 which is what institutions are pricing into the market now.
Stay healthy and trade safe!

Daily Market Update for 7/6Summary: Investors' reaction to the Fed's meeting minutes from June resulted in a choppy indecisive day for the market. The US Dollar continued to climb against the Euro.
Notes
Ideas always welcome in the comments. Errors will be amended as comments on TradingView or corrected inline in my blog.
-=x=-=x=-=x=-=x=-=x=-=x=-=x=-
Wednesday, July 6, 2022
Facts: +0.35%, Volume lower, Closing Range: 58%, Body: 12% Green
Good: Higher high, higher low, good closing range
Bad: Indecisive finish, advance/decline ratio
Highs/Lows: Higher high, Higher low
Candle: Indecisive spinning-top candle, thing green body in middle of two long wicks
Advance/Decline: 0.54, almost two declining stocks for every advancing stock
Indexes: SPX (+0.36%), DJI (+0.23%), RUT (-0.79%), VIX (-2.94%)
Sector List: Utilities (XLU +1.04%) and Technology (XLK +0.86%) at the top. Consumer Discretionary (XLY -0.33%) and Energy (XLE -1.71%) at the bottom.
-=x=-=x=-=x=-=x=-=x=-=x=-=x=-
Market Overview
Investors' reaction to the Fed's meeting minutes from June resulted in a choppy indecisive day for the market. The US Dollar continued to climb against the Euro.
The Nasdaq rose by +0.35%, helped mostly by big tech. Volume was lower than the previous day. The candle has a thin 12% green body in the middle of equal upper and lower wicks. The candle represents a spinning top that indicates indecision in the market, a perfect way to explain today's session. There were nearly two declining stocks for every advancing stock.
Small-caps pulled back with the Russell 2000 (RUT) declining by -0.79%. The S&P 500 (SPX) rose by +0.36% and the Dow Jones Industrial Average (DJI) gained +0.23%.
Seven of the eleven S&P sectors gained. The defensive sector of Utilities (XLU +1.04%) was at the top, followed by the growth sector of Technology (XLK +0.86%), another representation of the mix of sentiment in the market. Consumer Discretionary (XLY -0.33%) and Energy (XLE -1.71%) were at the bottom of the sector list. Energy stocks continue to fall along with oil prices.
The Services PMI for June was higher than expected. The 52.3 reading exceeded the 51.2 consensus forecast, showing more activity in Services than expected. JOLTs Job Openings were also higher than expected, coming in at 11.3 million compared to the expected 11 million.
The US Dollar Index (DXY) rose another +0.52%. The last time the index was this high was in 2002. US 30y, 10y, and 2y Treasury Yields all moved higher today. High Yield (HYG) and Investment Grade (LQD) Corporate Bond prices declined. Brent Oil dropped to $98.73 per barrel.
The VIX Volatility Index fell by -2.94%. The put/call ratio (PCCE) rose to 0.840. The CNN Fear & Greed index hasn't moved for a few days and is still in Extreme Fear.
Of the big six mega-caps, only Tesla (TSLA) declined, falling by -0.57%. Microsoft (MSFT) had the biggest gain among the group, advancing by +1.28% and closing above its 50d MA and 21d EMA. Alphabet (GOOG) also closed above the two key moving average lines, rising by +1.16% today.
Pfizer (PFE) was the top mega-cap for today, gaining +2.15%. Chevron (CVX) and Exxon Mobil (XOM) continue to be the bottom two mega-caps as the price of oil drops. They lost -1.32% and -1.80% today.
The Daily Update Growth List was mostly decliners today. The best advance was by Beyond Meat (BYND) which rose by +6.03%. The biggest declines in the list were Chinese Stocks, with Futu Holdings leading the pack, declining by -11.02% today.
-=x=-=x=-=x=-=x=-=x=-=x=-=x=-
Looking ahead
We'll get more labor data tomorrow at 8:15a with the ADP Nonfarm Employment Change for June. That comes before the weekly Initial Jobless Claims at 8:30a.
Imports/Exports and the Trade Balance data for May will also be published.
Crude Oil Inventories will be available after the market opens.
-=x=-=x=-=x=-=x=-=x=-=x=-=x=-
Trends, Support, and Resistance
The Nasdaq rose in a choppy session to close above the 21d exponential moving average line.
If the one-day trend line continues into Thursday, we can expect a +1.02% gain.
The five-day trend line and the trend line from the 6/16 low point to a -0.47% decline.
-=x=-=x=-=x=-=x=-=x=-=x=-=x=-
Wrap-up
The Fed minutes from June confirmed a very hawkish Fed that wants to act quickly before inflation becomes entrenched in the outlook for the public. On one hand, it means more rate hikes into 2023 are very possible. On the other hand, we can expect inflation to top at some point and start to come down. The two sentiments caused a mix of reactions today which could continue into the next Fed meeting at the end of this month.
Stay healthy and trade safe!
