XRP Downward Move Incoming? Market Manipulation at Play?I’m watching XRP closely on the 1H chart, and something feels off. This recent push up looks like a liquidity grab — classic manipulation to trap late long entries before a potential reversal.
The structure still shows lower highs forming, and we haven’t reclaimed key resistance levels convincingly. I believe we could see a move down from current levels, possibly retesting the demand zone below before any sustainable bounce.
Let’s see how it plays out — stay patient, stay sharp, and don’t get caught in the trap.
📉💡
S-XRP

XRP Update📊 XRP Update
XRP is approaching the green support zone 🟢
Now the question is — will it bounce or break below? ⚖️
If it holds, we could see a strong rebound 📈
But if it breaks, expect a deeper correction 🔻

XRPUSDT.P - November 12, 2025XRPUSDT.P is showing potential for a short-term bullish reversal after stabilizing near the $2.3779 support zone. The pair is attempting to break above a descending trendline, which has contained price action throughout the recent downtrend. A confirmed breakout and sustained move above the $2.4399 resistance level could signal renewed buying interest. If momentum builds, price action may target the $2.5758 profit level, representing the next key upside objective.
The stop level is positioned around $2.3148–$2.3200, marking the invalidation area for this bullish setup and protecting against a deeper correction.
Risk Assessment: Moderate to High — While early signs of a trend reversal are forming, XRPUSDT.P remains within a broader bearish structure. Failure to hold above the $2.38 zone or rejection from the trendline could trigger a renewed selloff toward $2.32 or lower. Confirmation above $2.44 is essential for a stronger bullish case.

XRP $17The Target 3 moon mission is preparing for launch.
The #Huntvolatility funnel is well underway.
Targets 1 and 2 have already been achieved and honoured.
In my humble opinion, we are poised to exceed many people's dream level of $10.
It's important to manage your risk as we ascend...
T3 may very well be exceeded.
However, it's crucial to adhere to your own trading strategy and financial objectives.
As we all know, the crypto market is extremely volatile.
Wishing everyone good luck.

Next volatility period: Around November 26
Hello, traders!
Follow me to get the latest information quickly.
Have a great day!
-------------------------------------
(XRPUSDT 1D chart)
Currently, the M-Signal on the 1W chart > Price > M-Signal on the 1D chart > M-Signal on the 1M chart.
Additionally, it is attempting to break above the StochRSI 80 indicator.
Therefore, if it finds support near the StochRSI 80 indicator and rises, it is highly likely to enter an uptrend.
The resistance zone is around 3.4037-3.4540, which is the HA-High ~ DOM (60) range.
The above is an interpretation based solely on the 1D chart.
-
The chart above displays support and resistance points drawn on the 1M, 1W, and 1D charts.
This indicates that support and resistance have formed in the 2.9092-3.0361 range.
Therefore, we have identified a zone where we can execute a two-stage sell-off.
This confirmation will be crucial for maintaining a stable psychological state amidst price volatility.
If the price falls to the 1.5-1.9669 range, which is the most important level for maintaining an uptrend, you should watch for an explosive increase in trading volume.
If it shows support, it indicates a buying opportunity.
-
Thank you for reading to the end.
I wish you successful trading.
--------------------------------------------------

XRPUSDT.P - November 7, 2025XRPUSDT.P is showing early signs of a short-term bullish reversal after rebounding from the ascending trendline support near the $2.16–$2.18 zone. A buy limit is positioned around $2.219, aiming for a move toward the $2.283 partial profit zone and the $2.336 profit level.
A confirmed breakout above $2.283 would validate bullish continuation, while a drop below $2.158 would invalidate this setup and signal renewed downside pressure.
Risk Assessment: Moderate — structure leans bullish, but sustained strength above the partial profit level is needed for confirmation.

Do you think I'm joking ???The price is currently moving within a bullish channel and may reach the upper boundary of this channel. If the channel is broken to the upside, we can expect a new all-time high (ATH) for Ripple.

#BTC Time to Buy ?!I believe We could have another downside move , and then we can have a buy position on it as Scalp . for 6-15%
Added in watchlist .

Only a few hours left until the BTC weekly close.Bitcoin must not close the candle below the 50-week moving average
in order to reach $107,000,
or unfortunately, the price may drop to the next resistance around $96,350.
The whole world is waiting.
This is technical analysis only and not investment advice.

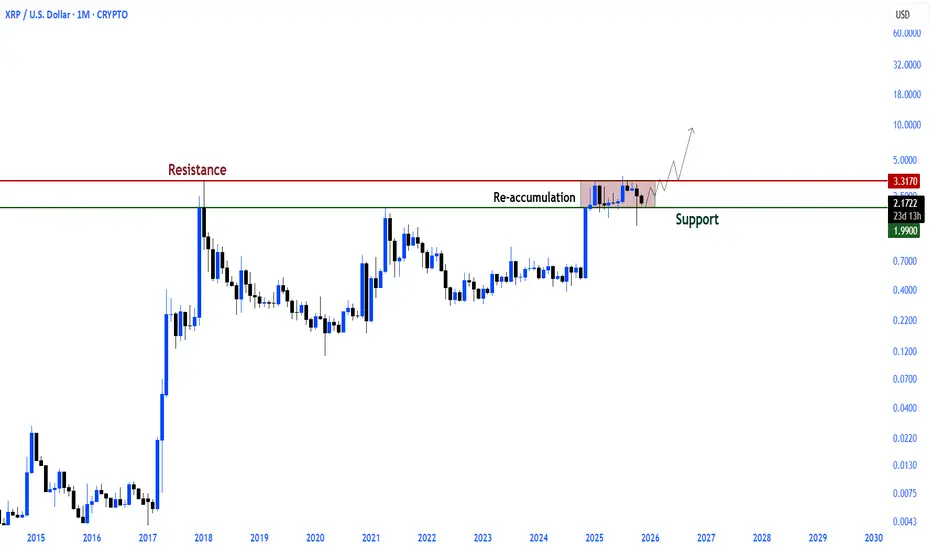
The table is clear in $XRP
Ripple is still in a clear re-accumulation phase between the $3.3 major resistance and the $1.99 support.
Unless the structure is broken, this silence will trigger a new leg.
XRPUSD Has it started its Bear Cycle already?XRP (XRPUSD) has been trading within a Channel Up ever since the March 09 2020 bottom of the COVID flash crash. Even though the recent Bull Cycle didn't hit the pattern's Top (Higher Highs), signs have emerged that the new Bear Cycle may have started.
The most obvious of those are the break (and closing) below the 1W MA50 (blue trend-line). Last month's flash crash even touched the 1W MA100 (green trend-line) before immediately recovering.
Most importantly, XRP already filled the 2.5 Fibonacci extension level with its July 14 2025 All Time High (ATH), which is exactly where the High of the previous Cycle was priced (April 12 2021). What followed afterwards, especially when it closed a week below the 1W MA50 (November 29 2021) is very similar to what has been taking place in the past 3 months (especially with the 1W MA50 break 30 days ago) and the similarities between the 1W RSI patterns further justify it.
As a result, since the 2022 Bear Cycle bottomed on the 1M MA100 (red trend-line) and just below its 0.618 Fibonacci retracement level, we expect the current to do the same and target $0.9000 (Fib 0.618). An additional indicator that may help at identifying the bottom (hence a good level to start buying again), is when the 1W RSI breaks below its 30.00 oversold barrier.
-------------------------------------------------------------------------------
** Please LIKE 👍, FOLLOW ✅, SHARE 🙌 and COMMENT ✍ if you enjoy this idea! Also share your ideas and charts in the comments section below! This is best way to keep it relevant, support us, keep the content here free and allow the idea to reach as many people as possible. **
-------------------------------------------------------------------------------
💸💸💸💸💸💸
👇 👇 👇 👇 👇 👇

BITCOIN's PUMPs are Getting LARGER this Bull Market...However, it may take a bit longer to realize those expansionary moves.
If Bitcoin adheres to the established cycle pattern, we can anticipate a minimum surge of 103% that should carry us into the fourth quarter of this year.
Consolidation ----> Fake breakdown ----> then expansion.
Are you ready?

XRPUSDT.P - November 6, 2025XRPUSDT.P is showing a short-term bullish recovery, holding above the ascending trendline after rebounding from the $2.2266–$2.0655 support zone. Price is currently testing near $2.2745, with upside potential toward the $2.3126 partial profit level and $2.3640 profit target.
A clean break above $2.3126 would confirm continuation toward higher resistance, while a drop below $2.2266 would invalidate the setup and suggest renewed bearish pressure.
Risk Assessment: Moderate — momentum is improving with trendline support intact, but confirmation above $2.3126 is needed to sustain the bullish move.

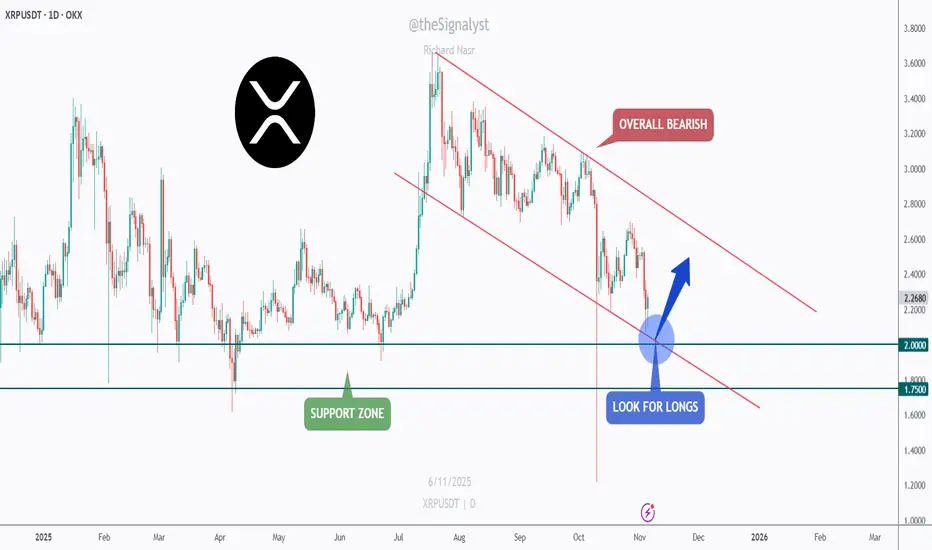
XRP - Watching the Confluence Zone for a Bullish Rebound!📉XRP has been in a clear bearish channel for months , forming consistent lower highs and lower lows.
However, the current structure is approaching a critical confluence zone, where the lower bound of the red channel meets the major green support area between $1.75 and $2.00.
⚔️As long as this intersection holds, I’ll be looking for potential long opportunities, anticipating a short-term bullish correction toward the upper boundary of the channel.
This setup offers a clean risk-to-reward opportunity if the bulls manage to defend the zone and regain momentum.
If the support gives way, further downside could follow, but for now, this area remains a key decision point for XRP’s next move.
⚠️ Disclaimer: This is not financial advice. Always do your own research and manage risk properly.
📊All Strategies Are Good; If Managed Properly!
~Richard Nasr
$XRP in a major accumulation area.CRYPTOCAP:XRP in a major accumulation area.
Wyckoff Method Scenario Repeating.
XRP is trading in a classic Accumulation Phase according to the Wyckoff method.
Technically, this structure is leading to a strong bullish cycle.
Following a similar accumulation period in 2017, XRP began a parabolic run and rose to the Distribution zone.

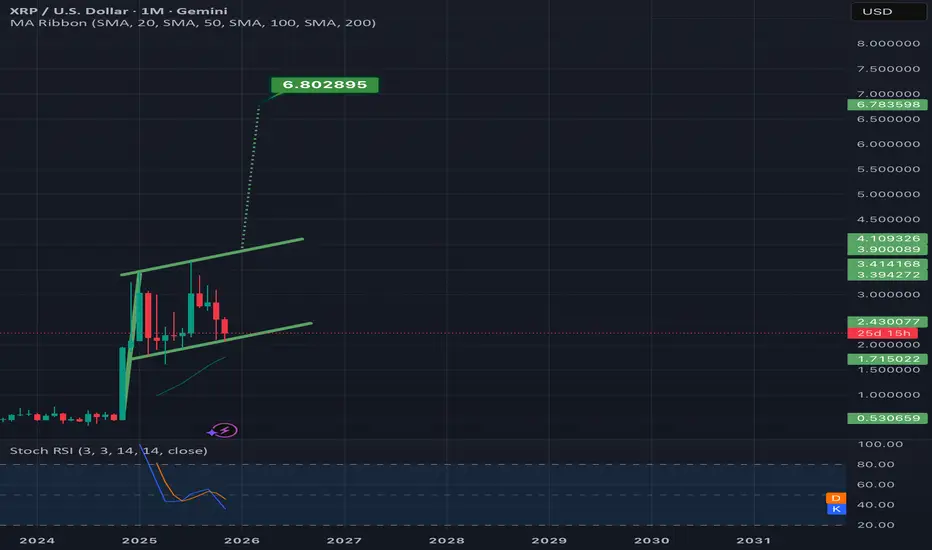
Bullflag on xrp has a target of $6.80 if it validates n DecemberWill be a very good sign if it finds a way to hold this bottom trendline as support.Even if it does hold support a wick below it is still very possible. *not financial advice*
XRPUSDT.P - November 4, 2025XRPUSDT.P is maintaining a mixed-to-bearish market structure on the 15-minute timeframe, with price currently trading around the $2.3069 region after a corrective bounce. The pair continues to respect a sequence of lower highs and lower lows, suggesting that bearish momentum remains intact.
A potential short-term rally toward the $2.3347 resistance zone could occur before sellers reassert control. A rejection from this level may trigger a downside continuation toward the $2.1995 support target, aligning with the broader bearish projection shown.
However, a sustained breakout above the $2.3347 resistance and the invalidation level near $2.37 would negate this bearish scenario and signal a possible short-term bullish reversal.

XRP - Key zones for a tradeXRP - Key zones for a trade
Price of XRP is in a range and key places for a trade area
LONG
- $2.32
- $2.19
Short $2.67

XRP Technical Outlook: Channel Break Could Signal New Highs !!The price is currently moving within a bullish channel and may reach the upper boundary of this channel. If the channel is broken to the upside, we can expect a new all-time high (ATH) for Ripple.

ADA JESSE LIVERMORE SPECULATIVE ACCUMULATION CYLINDERADA is currently experiencing a Jesse Livermore Accumulation Cylinder described in 1925
Typically this pattern resolves with powerful moves to the upside when presenting in a basing pattern
Other assets that underwent this pattern before explosive moves up are
Palladium
Platinum
Silver
Uranium
MOS
IPI
LEU
LTBR

XRP - BIG OI Rise - we`ll take short in a caseXRP - BIG OI Rise - we`ll take short in a case
clear strucutre change
becasue such oi often end with big move

Tick... Tock... $XRP When a resistance level is tested more than three times and the price continues to accumulate above a major support, that resistance is destined to break, sooner or later.
Each test weakens the sellers’ defense. Supply gets absorbed, liquidity thins out, and the market builds pressure.
Meanwhile, steady accumulation above strong support shows that buyers are quietly taking control, energy is being stored for an explosive move.
Eventually, the chart reaches a tipping point:
What once held the price down becomes the launchpad.
The breakout is no longer a question of if, but when.

$XRP a different perspective. Q4 2017 After breaking the middle band of the channel, XRP peaked in a parabolic rise within a few months.
Q4 2025 In the same channel structure, the price again touched the middle band, was rejected, and then began to accumulate.
The chart shows an almost exact repetition of the technical position before the 2017 breakout.
