All Aboard XRPI think from here we have built a pretty strong support around $2.94-$3. I expect crypto to take over the gold rally as the treasury looks into creating a digital asset reserve first starting with bitcoin. The government shutdown should give boost to this initial rally.
-This is not financial advice good luck!
S-XRP

Gold Selloff EOYGold has reached a critical resistance structure around $3,880-$3,895. As in recent post the target for Goldman Sachs was $3,700 with an exhaust level of $3,880. Even with government shutdown, I believe cryptos and coming crypto ETF’s (XRP) will become dominant in “safe haven” assets. The price of gold is extremely overbought and the greed is at an all time high.
My targets will sound outrageous. But we will possibly see gold get reckoned in the next two months into the next 2 years. The stable price of gold is below $2,100 and is sitting at a support area of $1,742. With an actual price liquidation zone at $1,572. This is simple physics and realism. Everything that goes up has to come down. This gold price not only reflects fear, but extreme greed. Actuality will set in soon.
-Goodluck, This is NFA
R2C

TradeCity Pro | XRP: Key Support and Resistance Zones Testing👋 Welcome to TradeCity Pro!
In this analysis, I will review the XRP coin. One of the oldest crypto projects, XRP aims to align crypto transactions with the SWIFT system. The coin has a market cap of $173 billion and is ranked 4th on CoinMarketCap.
📅 Daily Timeframe
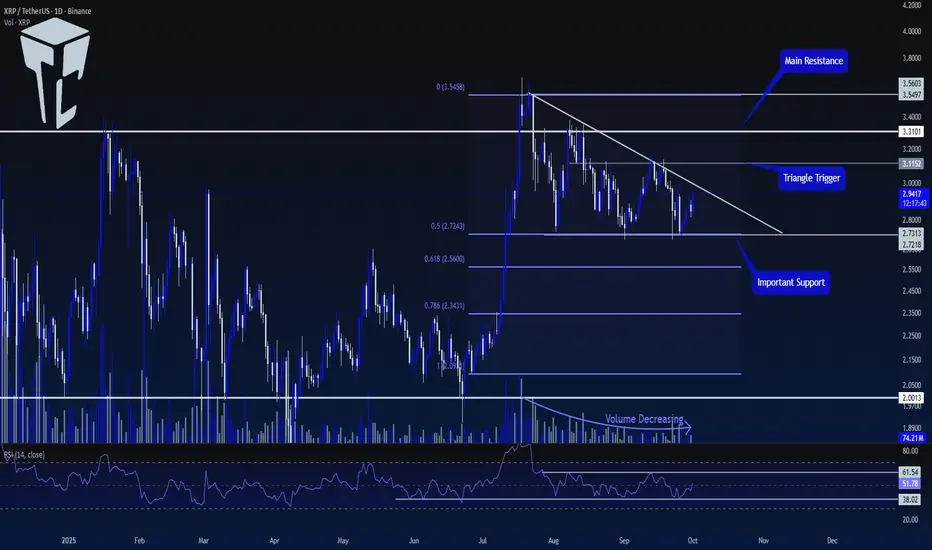
After getting support at the 2.0013 level, XRP made a bullish move up to the 3.5603 resistance. Now, it has formed a descending triangle, and the volume has been decreasing as the price moves down.
⚡️ Currently, a crucial support zone has formed at 2.7218, which overlaps with the 0.5 Fibonacci level, forming a PRZ for us.
🧩 A descending trendline has also been created, and the price has touched it several times, making lower highs.
📊 To confirm the next bullish move for this coin, the first confirmation we need is the breakout of the trendline. The trendline breakout trigger is at 3.1152.
✨ Once this level is broken, we can open a long position. This trigger is the first long position trigger and is considered risky since we haven't yet received the main confirmation for a bullish trend.
🔍 The main trigger for the start of a new bullish trend is the breakout of the 3.3101 level. Breaking this level could start a new upward move for XRP.
💥 A very important confirmation for both long and short positions on the RSI is the breakout of the range between 38.02 and 61.54.
🎲 As long as the RSI remains between these two levels, the probability of hitting stop losses is high. Therefore, for a long position, we can wait for the 61.54 level on the RSI to be broken.
🔽 For a short position, the 38.02 level on the RSI is a good momentum trigger. We can also use the 2.7218 level as a trigger, but keep in mind that the main market momentum is bullish, so this short trigger is considered risky.
📝 Final Thoughts
Stay calm, trade wisely, and let's capture the market's best opportunities!
This analysis reflects our opinions and is not financial advice.
Share your thoughts in the comments, and don’t forget to share this analysis with your friends! ❤️
XRP Swing Long Opportunity - LRKZ MODELXRP Swing Long Opportunity
📊 Market Sentiment
FED has resumed its rate-cutting cycle, starting with a 0.25% cut in September, with two more 0.25% cuts expected in the coming months. Additionally, institutional liquidity inflows have accelerated as the U.S. officially adopts crypto as part of its reserves. While inflation remains elevated, the weakening labor market is forcing the FED to ease, driving more capital into risk-on assets.
📈 Technical Analysis
Price made a new all-time high and is currently retracing before pushing higher again.
Price ran the weekly swing liquidity at $2.70 and closed above with a wick, confirming manipulation before expansion.
Price also retested the broken HTF Demand zone at $2.69, which was strong resistance previously and now acts as strong support.
These confluences strongly suggest rejection and continuation higher.
📘 Model to be used – HTF Liquidity Run into HTF Key Zone (LRKZ Model)
In this model, I first define the HTF trend. Then, I look for the most significant liquidity that lies opposite to the HTF trend (swing highs or lows). These zones often contain enough liquidity to trigger reversals or strong bounces. When price sweeps this liquidity and retests an HTF Key Zone (where strong limit orders sit), it creates a high-probability setup. Confirmation on LTF then provides the entry trigger.
📌 Game Plan
Price already closed above the $2.70 level, confirming entry. Looking for continuation higher with structured targets.
🎯 Setup Trigger
Setup is active long position valid after the daily close above $2.70.
📋 Trade Management
Stoploss: Daily close below $2.70 or hard stop at $2.50.
Targets:
TP1: $3.18
TP2: $3.37
TP3: $3.66 (ATH)
After TP1 is secured, I will move stoploss to breakeven and scale profits as price moves toward higher targets.
💬 Like, follow, and comment if this breakdown supports your trading! More setups and market insights coming soon — stay connected!
⚠️ Disclaimer: This content is for informational and educational purposes only and does not constitute financial, investment, or trading advice. Always DYOR before making any financial decisions.

Will Ripple (XRP) continue to sell XRP – Distribution Pattern & Elliott Wave Roadmap
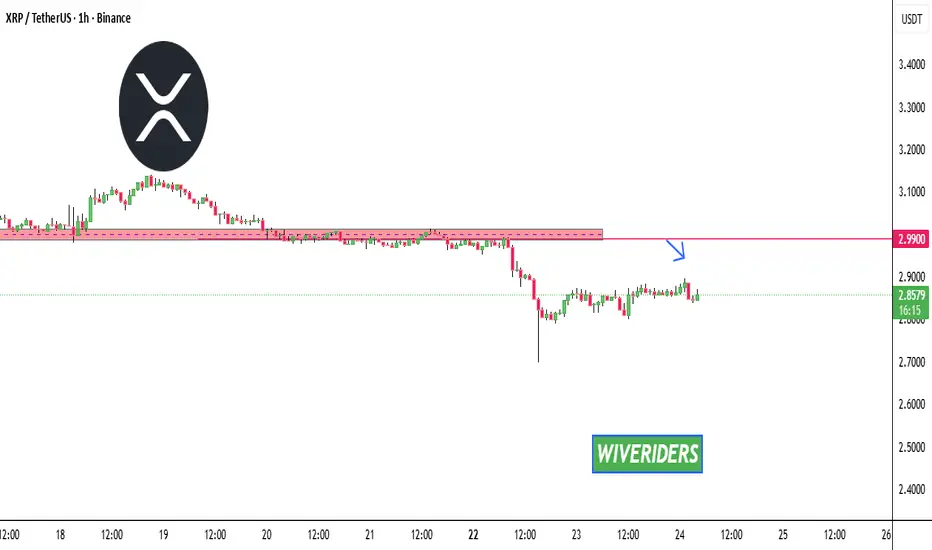
We’ve now tapped this support line five times. The structure looks like another Lower High (LH) forming inside a distribution pattern.
• Bullish scenario: If price breaks above the LH structure, we could see continuation toward a new all-time high.
• Bearish scenario: If lower highs persist, I don’t expect a sixth touch of this support. Instead, a decisive break lower would confirm the top of Wave (5) and start a larger correction.
That correction should complete as a 3-wave structure, setting up the Super Cycle Wave (1) top. From there, leg 2 develops before a true leg 3 rally begins. Based on my count, that rally zone could emerge from $0.05 – $0.14.
This chart is part of my overall Elliott Wave view (see my first post). I’ll update that main chart when a minor leg one within this corrective phase is confirmed.
⚠️ CRYPTO:XRPUSD Stay tuned—updates will follow as CRYPTO:XRPUSD defines its path.

$XRP are we back run it.As supported by momentum on the XRP side, upward momentum is accelerating with the reaction from the demand zone.

EUR USD AUD NVDA MSFT AVGO S&P500 BTC XRP Weekly InsightsIn this video, we dive into the key market movements and outlooks for major financial instruments over the past week. Highlights include:
Analysis of currency pairs: EUR/USD and AUD
Trends and technical setups for leading tech stocks: NVDA, MSFT, AAPL, AVGO
The S&P 500’s performance and what it suggests about broader market direction
Developments in cryptocurrency, with a focus on BTC and XRP
Whether you’re a trader, investor, or just interested in macro markets, this video gives you a consolidated, data-driven snapshot of where things stand and what to watch next.

XRP Still consolidating below all time highCRYPTOCAP:XRP continues to consolidate below all time high with no significant drop yet on the macro.
I expect this drop to come to complete wave 2 but with a shallow correction to the weekly pivot at $1.7 between the 0.236 and 0.382 Fibonacci retracement.
My previous analysis still stands about this being a terminal move due to the macro triangle (an Elliot wave pattern that comes before a final thrust) that would see price long term returning to the triangle bottom during a prolonged bear market $0.3-0.5.
For now the trend is up! Have an exit plan! I will be looking for long a those key levels.
Safe trading

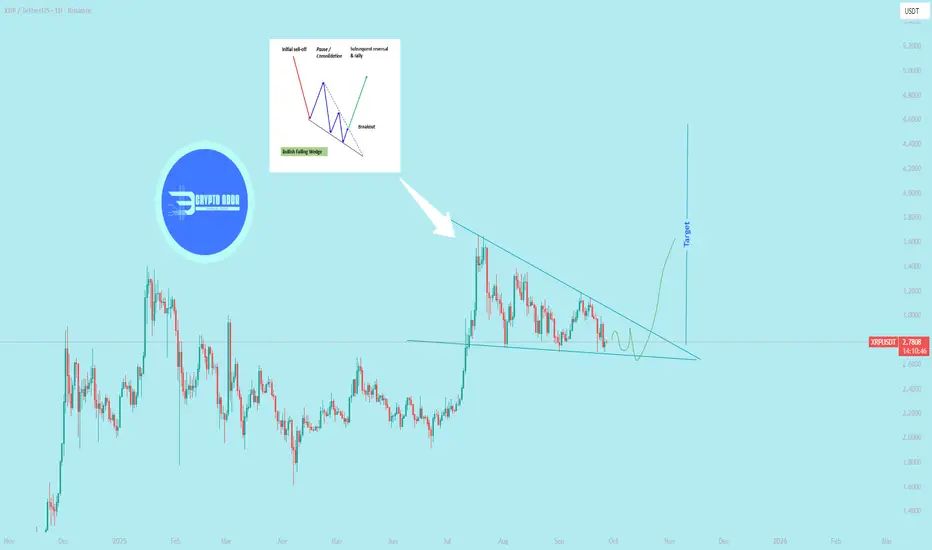
$XRP Performing falling wedge pattern in 1D
> Falling wedge as a reversal vs. continuation pattern
`As a reversal pattern`
`Location:` Occurs at the end of a prolonged downtrend.
Signal: The narrowing price action and declining volume suggest that sellers are exhausting their momentum. The pattern is completed when the price breaks above the upper resistance line, signaling a potential bullish reversal.
`As a continuation pattern`
`Location: `Appears after a strong uptrend.
Signal: The falling wedge acts as a temporary consolidation or pause in the current trend. The price then breaks out to the upside, continuing the original uptrend. @everyone
$ETH is trading around $4,000 after hitting the $4,800–5,000 $ CRYPTOCAP:ETH is trading around $4,000 after hitting the $4,800–5,000 resistance zone I mentioned in my last update. As expected, a short-term correction is playing out toward $3,500–$3,200, with possible extension to $3,100, where I’ll be looking to buy again. My bullish targets remain around $5,000 and $6,000, and I’ll share timely updates as the setup develops.

Is Crypto Entering a Bear MarketToday crypto was exceptionally weak.
Bitcoin & Ether sold off sharply with Ethereum breaking critical downside levels.
The total crypto market cap is so close to triggering a head and shoulders pattern which could cause a massive waterfall selloff.
I'm expecting BTC to start gaining dominance compared to other crypto coins.
Profits on BTC & ether shorts we secured today.

Descending channel/Bull flag on xrpusd revealedAfter the most recent resistance was found I was able to find the channel xrpusd price action is currently in which also is functioning as a bullflag. My guess is the uptrend will resume in October but we will know soon enough *not financial advice*

XRP ETF Approved, But Price Hurts—Will Big Players Act?At the time of writing, XRP trades at $2.84, just under the $2.85 resistance. A flip of this barrier into support would likely signal the beginning of a reversal, strengthening bullish sentiment. Traders are closely watching this zone for confirmation.
If support from LTHs holds, XRP could climb toward $2.94 in the short term. Breaching this level would pave the way for a further rise to $3.02, signaling broader recovery potential and invalidating near-term bearish concerns.
However, if market conditions worsen or LTHs shift their strategy to selling, XRP could lose momentum. The altcoin risks sliding toward $2.75 or even deeper to $2.64, putting bullish expectations in jeopardy and prolonging the consolidation phase.

The key is whether it can rise above 3.0361
Hello, fellow traders.
Follow us to get the latest information quickly.
Have a great day.
-------------------------------------
(XRPUSDT 1D chart)
The key is whether it can rise above 3.0361 and sustain the price after the next period of volatility, around October 2nd.
This period of volatility is expected to continue until September 25th, and we should examine whether support can be found around 2.9092 and whether it can rise.
-
If the price falls below the M-Signal indicator on the 1W chart,
1st: 2.5102-2.6013
2nd: 2.1453-2.2582
We should check for support near the 1st and 2nd levels above.
-
If the price remains above the M-Signal indicator on the 1D chart, further upside is highly likely, so it's important to determine whether support can be found near 3.0361.
The best time to buy was when support was found at key support and resistance levels, or around the 2.1453-2.2582 range.
Currently, a new buy is possible when support is found near 3.0361.
However, since this does not fit the basic trading strategy, a quick and rapid response is required.
-
The basic trading strategy is to buy in the DOM(-60) ~ HA-Low range and sell in the HA-High ~ DOM(60) range.
However, if the HA-High ~ DOM(60) range rises, a step-up trend is likely, while if the DOM(-60) ~ HA-Low range falls, a step-down trend is likely.
Therefore, the basic trading strategy should be a segmented trading approach.
-
The HA-High ~ DOM(60) range on the 1D chart is currently 3.4037-3.4540.
Therefore, a rise to around 3.4037 is possible.
However, since the DOM(60) point on the 1M chart is formed at 3.0361, if the price rises above 3.0361 and maintains, a long-term step-up trend is likely.
Therefore, the current buying opportunity should be when support is confirmed around 3.0361.
-
(1W chart)
To rise above 3.0361 and maintain support, the upward trend should continue.
- The StochRSI indicator should be trending upward. Ideally, it should not enter the overbought zone.
- The On-By-Value (OBV) indicator should be trending upward. Ideally, it should remain above the High Line.
- The TC (Trend Check) indicator should be trending upward. Ideally, it should remain above the zero level.
If the above conditions are met, the upward trend is expected to continue.
-
Thank you for reading.
We wish you successful trading.
--------------------------------------------------

$XRP run it back turbo.XRP is preparing for a new wave of growth following a breakout from a major downtrend and a retest.

XRP deadcat bounce?Today Bulls had their fun on XRP. The fall was only the beginning. This was a test of supply. In my opinion I believe demand for next month is $1.30 in that range. We shall see. We are still in a Wyckoff distribution pattern and haven't broke any eyes if we break higher than my green box we remain bullish.

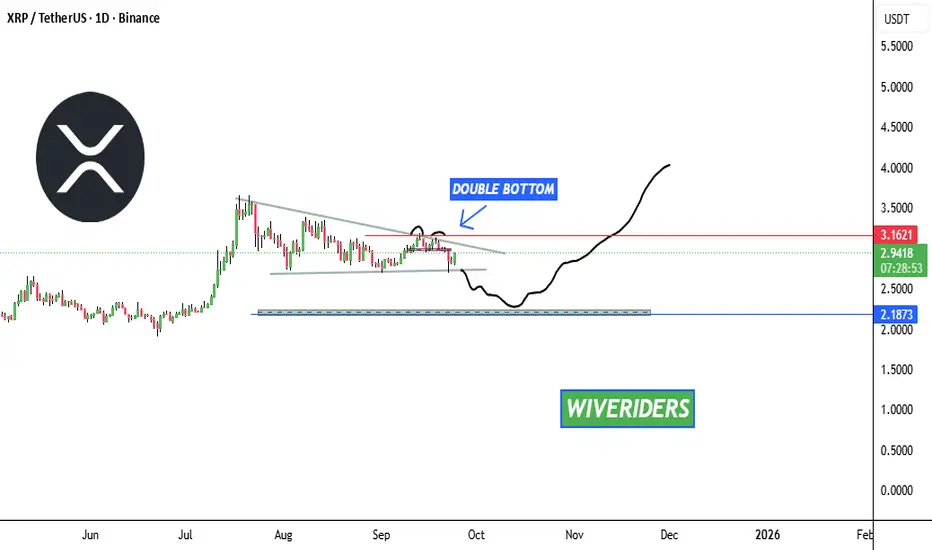
XRP Daily Market Update📊 CRYPTOCAP:XRP Daily Market Update
CRYPTOCAP:XRP is forming bullish patterns overall ✅ but here’s what’s next:
1️⃣ Around $3.1621 there is a Double Top bearish pattern. XRP needs to break this level with confirmation to indicate the trend remains bullish.
2️⃣ Another option ⚠️ — XRP could cross down, grab liquidity, hunt stop-losses, and reach the green support zone around $2.1873. From there, buyers may step in again since strong accumulation and volume exchanged at this level.
🔎 On the higher time frame, XRP is still bullish 📈 — but this is the daily scenario at the moment.
THE UNEXPECTED BREAK OF PROM TO $15Prom is one of the coins that did show before a signal of fall, but unexpectedly, a whale trend did save it, with now the possibility that it can break to $15 in the coming time.

XRP Market Update📊 CRYPTOCAP:XRP Market Update
If CRYPTOCAP:XRP reaches the red resistance zone 🔴, wait for confirmation before entering a short position ⚠️
This is the level where sellers are still active and could push the price down again 📉
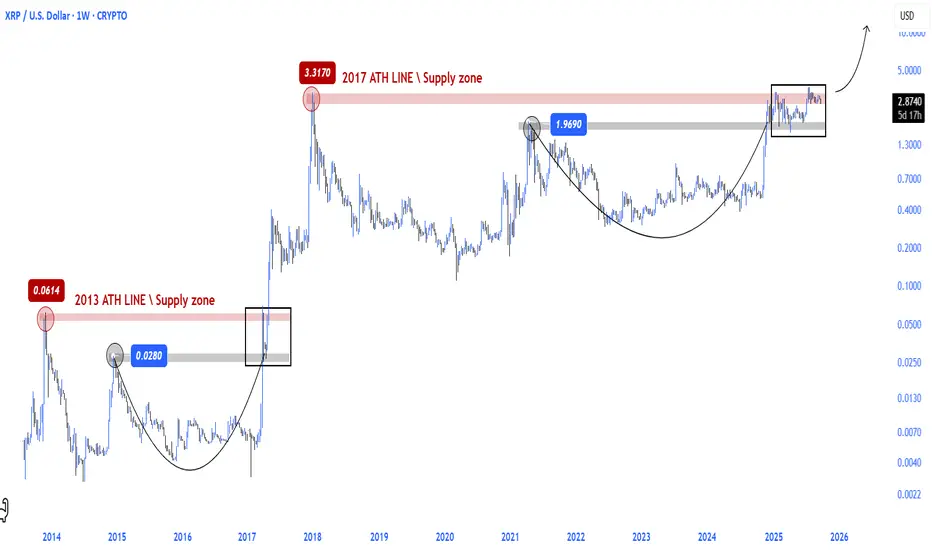
XRP running phaseRipple CRYPTOCAP:XRP before another epic running phase.
In the coming period, another major run may be seen with the breaking of the 2017 ATH level.
Xrp - The path remains bullish!🔔Xrp ( CRYPTO:XRPUSD ) will still head higher:
🔎Analysis summary:
Looking at the overall picture, Xrp has still been consolidating for the past eight years. This does not mean however, that Xrp cannot break out and head much higher in the future. It simply all just comes down to an all time high breakout, together with the potential bullish triangle breakout.
📝Levels to watch:
$3.0, $1,7
SwingTraderPhil
SwingTrading.Simplified. | Investing.Simplified. | #LONGTERMVISION

XRP Update📊 CRYPTOCAP:XRP Update
If XRP moves back to the red resistance zone, wait for confirmation before entering a short position. ⚠️
This is the zone where sellers could step in again and push the price down from this level. 📉

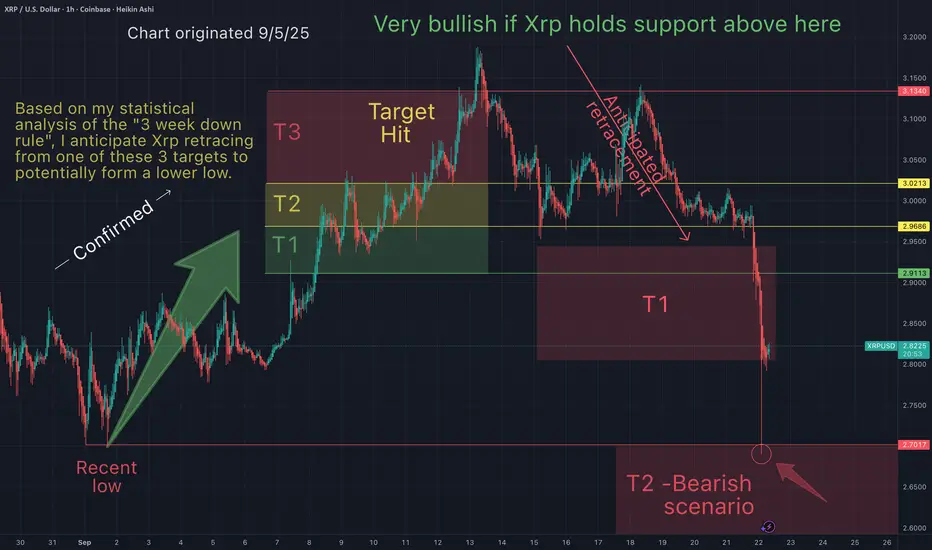
You will ask yourself, "how did he know Xrp would do that"?On Sept 5th I suggested that Xrp would bounce up to one of my 3 targets, then retrace to a lower low. This prediction was based on the "3 Red Week Down Rule". Things are going according to what I had expected.
Congratulations to everyone who have been making gains here based on what I have been outlining on my charts.
By applying historical data, statistical analysis and technical analysis, it becomes easier to forecast price action. The most important thing is to have a strategy and these strategies have made incredible gains here across the board.
May the trends be with you.