New entry idea for SAND! - Keep an eye on this setupHere's a quick Look at SAND daily chart . As we can see, the price has been forming a bigger descending triangle and the price is at the apex of the triangle! The price is very close to a bigger break to the upside. The best entry would be, when the price breaks above the descending triangle with good amount of volume . Definitely one to keep an eye on.
The market might shift soon, and big gains could be coming our way!
-------------------------------------------
The idea is: Buy when the price breaks above the descending triangle and take profits at the levels shown in the chart.
Targets:
1. 3.4$
2. 3.75$
3. 4.4$
4. 5.5$
-------------------------------------------
What are triangles when it comes to trading?
Key points:
"1. In technical analysis , a triangle is a continuation pattern on a chart that forms a triangle-like shape.
2. Triangles are similar to wedges and pennants and can be either a continuation pattern, if validated, or a powerful reversal pattern, in the event of failure.
3. There are three potential triangle variations that can develop as price action carves out a holding pattern, namely ascending, descending, and symmetrical triangles."
-------------------------------------------
If you like the content, then make sure to comment and like the post :D
Follow me for daily profitable trading setups
BTC dictates the market. If BTC falls, then Alts will fall as well. Trade safe!
SAND

SAND/USDT - Potential 74% SetupHello Traders!
SAND has been moving in a downtrend for a long time. The price has found support near the $2.73 level. RSI on the exit from the bearish zone, the price is approaching the breakdown of the downtrend.
Counting on the exit of the asset from the long correction, it is possible to work short-term from purchases, looking for such purchases can be in the price range of $2.72 - $3.00.
The targets for such purchases will be price levels of $4.00 and $4.74.
Close the deal using stop-loss only in case of price decrease below the price level of $2.05
Good luck and watch out for the market
P.S. This is an educational analysis that shall not be considered financial advice

SAND accumulation before next leg up ?SAND / USDT
the chart looks great & printed triple bottoms in support area
If resistance line brokeout successfully , we will have high potential for strong bullish wave so keep your eye on it And buy after breakout
Invalidation: breakdown of blue zone
Don’t forget to like & follow for more ideas and analysis
Best of wishes

SAND/USDTThe pattern it has formed in the long term is similar to the pattern of crab, and if it does not descend from the bottom of the channel, it can reach higher targets.

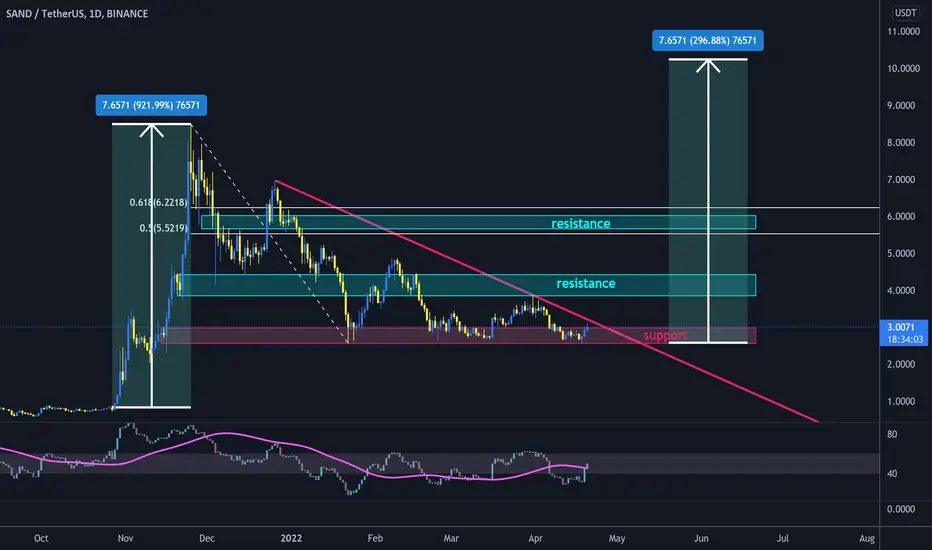
SAND near to break out triangle#SAND/USDT
$SAND hold the lower line of triangle, and price is below upper line of this pattern.
🐮 break out from upper line of triangle will head up price to resistance zone between 0.5 and 0.618 fib levels and potential to reach $10 in mid term.
$SAND 1D chart to watchprobably bitterer off trading confirmations
huge IF is ofc how $BTC plays out
4H EMAs ww
execute accordingly

Sand Getting Ready for another Bullish waveHello my friends, today I want to talk with you about Sand. Sand now Bullish after Breakout and retest.
Always do your analysis before making a trade.

Sandbox (SAND) and the $2.70 markSandbox (SAND) and the $2.70 mark
At this price level the volume in the first half of November 2021 was by far the biggest.
See how the price reacted so far at this level.
Good accumulation point on the one hand... bad if we loose this support on the other hand.
Who would buy here dear Crypto Nation?
Drop me a nice comment if you'd like me to analyze any other cryptocurrency.
*not financial advice
do your own research before investing

$SAND SANDUSDT WYCKOFF LONG$Sand has tested the bottom 3 times, I think it is currently phase C and about to enter phase D, it is very reasonable to buy Sand coin at below $3, cut loss when the price breaks $2.5. If this is phase C, the price will go up and create LPS points, you can also buy more coins at LPS points. I hope Sand can reach the old peak.


sandbox ready to movesandbox is close to a breaking point here
we could see a nice pump soon if we can break the down trend here
but if we fall below support could see it hit next level of support listed

sand box moveing 1 hour chart sand looking good short term scalping
do not enter with out puting the stop loss the market is very choppy
be careful

SAND Potential Swing Long Set Up 0.786 Fib Bounce$SAND has retraced back down to the 0.786 Fib level and is back at support. $SAND needs to hold this support in order for it to further continue to the upward side.


#BNB/USDT 2DAY UPDATE BY CRYPTOSANDERS#BNB/USDT 2day analysis in the chart
I have tried my best to bring the best possible outcome in this chart.
Hello members welcome to BNB/USDT 2D chart update by CRYPTOSANDERS.
First hit the like button and follow me, this motivates me to bring this kind of regular chart analysis.
As we can see from the above-mentioned chart that BNB/USDT broke the symmetrical triangle pattern and currently moving down to retest the upper trend line, for the bull trend we need a retest so we should wait for confirmation.
If it broke down the lower trend line and moves back inside then this chart will be invalidated.
This is not a piece of financial advice.
Sorry for my English it is not my native language.
Do hit the like button if you like it and share your charts in the comments section.
thank you.

sandusdtThe price is at the bottom of the long-term uptrend channel and also at the bottom of the triangle pattern

The Sandbox SAND short Price Targets and Stop LossSAND/USDT short
Entry Range: $2.84 - 3.10
Take Profit 1: $2.70
Take Profit 2: $2.35
Take Profit 3: $2.10
Stop Loss: $3.40

SAND - inside a triangle
SAND :
SAND :
The price is moving inside a triangle.
Crossing the trend line will determine the route ...


SAND🏖️ out of the box📦Sandbox seems to be breaking up out of this triangle 📐 and if successful I think there is chance for run to 5.4 and even higher.
ENTRY : local high @ 3.362
STOPLOSS (SL) : local low @ 2.99
TARGET (TP) : height of the triangle projected from midpoint of the local range (BUY STOP-LIMIT - SL) @ 5.4
REWARD RISK RATIO (RRR) : 5.0
INVALIDATION : when SL level hit
Check my other stuff in related ideas.
Please like👍, comment🗣️, follow me✒️, enjoy📺!
⚠️Disclaimer: I'm not financial advisor. This is not a financial advice. Do your own due dilingence.

SANDUSDT ( "4H Chart" 32% - 46% Profit Spot )Targets are : 4.42 - 4.86
StopLoss : 3.20
Buying Reasons :
3month ressistance breakout
bullish trend
FTR candle 23March
and other things
Dont be greedy
Wish you all health & wealth
GOD BLESS

SANDSAND breaks the support of the $3.30 area. The next good support is the $3.00-$3.05 area and we may see some accumulation near this level. A break below the $3.00 support area is bearish and we will see more downside movement towards the $2.65-$2.70 area. The resistance is $3.35 and $3.70 area.

Sand needs more volume to move upSand is out of triangle and it’s in an important price range right now. 3.5 could be new resistance or support.
New resistance for bullish move would be 3.77
And if it goes down (hope not) new resistance would be 3.5 and support would be 3.14
Current volume is not sufficient for bullish move. Watch it in the hours ahead.
