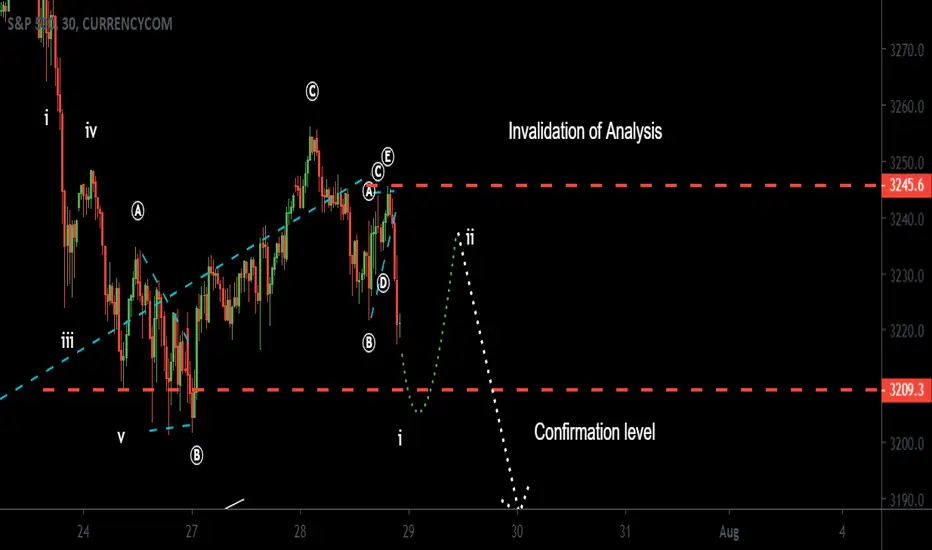
S&P 500 Elliot wave Update,29.09.2020the x wave as a irregular structure is completed
get ready to short
Sandp500

s&p500 crash explained using Elliot wave 26.09.2020I am explaining my prediction for the crash which was published on 30th of august 2020
also my prediction for the future move

SPY SPDR S&P 500 Trust Technical AnalysisBased on simple Technical analysis, the wisest option is to Hold - Stand aside -
Breakout of the trendline: Weakness signal
Breakout of the EMA: Weakness Signal
Major trend is bullish: The idea is to invest in the trend direction.
I would be tempted to go long although is too risky - Option 1 - 60% to follow the major trend

GLOBAL CRASH INBOUND?As charted, everytime we see a Ichimoku CLoud break in the VIX ( Volatility S&P 500 Index ) we see a strong rally out of it. The most recent example of this is on the 13th Feb 2020.
Inversely proportional to the VIX , the S&P 500 Index has massive negative price action, represented on the 21st Feb 2020.
Coincidence? I think not...
Since the beginning of COVID19 governments around the world have been scrambling to control there domestic economies by all means necessary. It's of no secret that there is a huge amount of Global Hyperinflation and we are starting to really feel the effects of what this virus has done.
Nothing is guaranteed and we have deflected out of Ichimoku Clouds before to stabilise as represented most recently on the 31st July 2020, (Remember though that the S&P 500 still dropped close to 6%)
Currently looking at price action on the S&P 500 Index entering the cloud doesn't fill me with confidence, along with the VIX ( Volatility ) shaping up to break through the cloud and destabilise the S&P 500 .
This isn't just isolated to the S&P 500 Index , check out all the other Major Indexes to see the relationship.
America is about to enter "Flu season" (Winter) and it has the Presidential Election coming up. This could be shaping up for a BIG ONE....
Will history repeat?
These Ideas are NOT 'Financial Advice'!. Scenarios are based off a mixture of TA and Fundamentals current at the time. All IMO GLTA. Happy Hunting!!! *Prices will differ depending on charts used

S&P 500 - Breaking Head & Shoulders!Hello Fam!
Short
Reasons:
reformed head and shoulders pattern and now breaking out.
Good luck to you!
Please consider to put a like to my idea for supporting me & subscribe for more ideas.
Idea is not the financial advice!


S&P 500 - Pullback Before Bullish MoveOn the matter of the S&P 500, I am long-term bullish. In fact I posted an idea suggesting $380 SPY within the next quarter. After a second look at this past week's price action, I still believe we'll hit $380 SPY, it most likely will be in 2021 though. We've had quite the bullish momentum running for awhile. I think an appropriate step back is about to take place.
I am unsure on the finishing price point of the fifth wave, there are just way too many factors to consider. But I believe this will play-out before we see more bullish mania.

SELL SIGNAL $SPX ~ Stock market about to crash? (Will drag $BTC(-Yurlo //
$SPX ~ $USD
Sell signal arrived on today's daily candle (price action) & on oscillator (momentum) ~ 2 confirmation's.
Is the stock market about to crash and drag gold and bitcoin down with it?


SPX - Follows My Plan!Hello Fam!
Short
Reasons:
rising wedge breakout, head and shoulders pattern
Good luck to you!
Please consider to put a like to my idea for supporting me & subscribe for more ideas.
Idea is not the financial advice!

S&P 500 elliott WAVE analysis week starting 07.09.2020I am still short but You can expect some bounce back at the beginning of the week
I will do live update under this post

$SPX ~ S&P 500 (LOSING $3350 WOULD SIGNAL BEARISH SELL PRESSURE)$SPX is heavily correlated with of course tradional markets, but also with $BTC which i day trade so paying attention to these charts is important for your future success as a trader.

S&P - US500 top-down video AnalysisHello everyone, here is the top-down analysis for US500, feel free to request any pair/instrument or ask any questions in the comment section below.
Best of luck!

SPX - Rising Wedge Pattern is Broken!Hello Fam!
S&P 500 index broke the rising wedge pattern and now goes downward.
Good luck to you!
Please consider to put a like to my idea for supporting me & subscribe for more ideas.
Idea is not the financial advice!

BTCUSDT | Bitcoin has crashed but is the growth phase finished?Overview
Bitcoin broke up through $12 000 but is now crashing. Gold set a new all-time high but has since pulled back. The S&P 500 keeps on setting high after high. Still, all of these assets have one thing in common: they’re all at risk for a sizable correction, primarily due to the dark cloud hanging over the coming United States 2020 Presidential election. However such explanation can describe short-term effect on Bitcoin's price action but what about long-term perspective?
Fractals
Bitcoin global ATH $19 798 was reached on December 17th in 2017. Afterwards the whole cryptocurrency industry entered a consolidation phase decreasing until April 2nd in 2018 when a new growth stage started. After 3 months of ascending trend Bitcoin made a local peak of $13 970 on June 26th where consolidation started again making a Fractal pattern.
Why are these Fractal patterns so important now?
Bitcoin price action tried to consolidate at previously broken resistance levels to stop crashing during the first Fractal in 2018. Retrospectively we can see it failed after several attempts reaching major support which was also rejected thus it resulted in a dramatic crash to base level of $3 156. Currently we see the very similar situation:
- Local support of $11 400 was broken
- Previously broken resistance level of $10 400 level is being tested but has low probability to withstand
Based on the Pitchfork and trend analysis we see a high probability of breaking down the level and further retest of major support level. Which will confirm repeating Fractal pattern and will signal for descending trend
Conclusion
Bitcoin is at decisive moment. The long-term price action development depends on whether BTC succeed to consolidate above $10 400 level or not. Most traders from SkyRock Signals think Bitcoin will break the level within next days because of bearish fundamental background, negative results of trend and technical indicators analyses. The scenario will bring the leading cryptocurrency to Major support near with $8 893 level. On a contrast with the first Fractal this level is close to fundamental production value which increase chances of bouncing back. However it is hard to accurately forecast what will happen when Bitcoin touches major Support because Fractal patterns do not guarantee retrospective will happen again. The most important now is to set tight risk management settings to your cryptocurrency assets positions until decisive moment is passed
Stay safe and confident. We will update this trading idea so stay tuned
Best regard,
SkyRock Signals team

S&P500 all the way to the moon? where is limit?well. I was counting this for almost 3 weeks as bearish but all the possibles got invalidated
we are at a level the there is no resistance level in front so it is hard to predict the limit.
first lets have look at the monthly chart.
I need to mention although it might look as an expanding triangle but the dimension of this triangle dose NOT meet what is written in the text book
for example the book say :Subways B,C,D each retrace at least 100% but not more than 150% of the preceding wave" Elliot wave principle , Frost page 91. this is invalidated in out case
all we have now is just a trend line that connects to peaks and RSI
I am gonna make my prediction mainly based on RSI.
The monthly RSI has a resistance level at 68.6
the weekly RSI is also near the bearish resistance level at 68.8
based on these evidence I can guess the market will crash at some level around the box plotted

SPX500 Bullish Bias Continues Pushing ALL TIME HIGHS!Trade with caution as SPX500 continues to push through and reaches all-time highs. The market can be very unpredictable, Very volatile, and vulnerable to News Impacts. Expect Pullbacks!

SPX500 Long Bullish BiasSPX500 is currently Consolidating. Looks like it might push through and continue Bullish bias.

S&P500 Elliott wave analysis for week starting 24.08.2020My whole Idea is based on the page III-9 of the book : Robert Balan - Elliott wave principle
there is big debate on the pattern he has provided as many people disagree with a leading triangle as B wave
but the pattern I am seeing highly confirms what is in the book
the triangle we have have impulsive legs 5-3-5-3. this is special type of triangle
the box I have plotted as the reversal zone is based on RSI

S&P 500 Elliot WAVE analysis update 17-07-2020 There are several valid scenarios and non of the contradict the other one,
this is the one I think is valid
I recommend stay away from the market until it unfolds completely

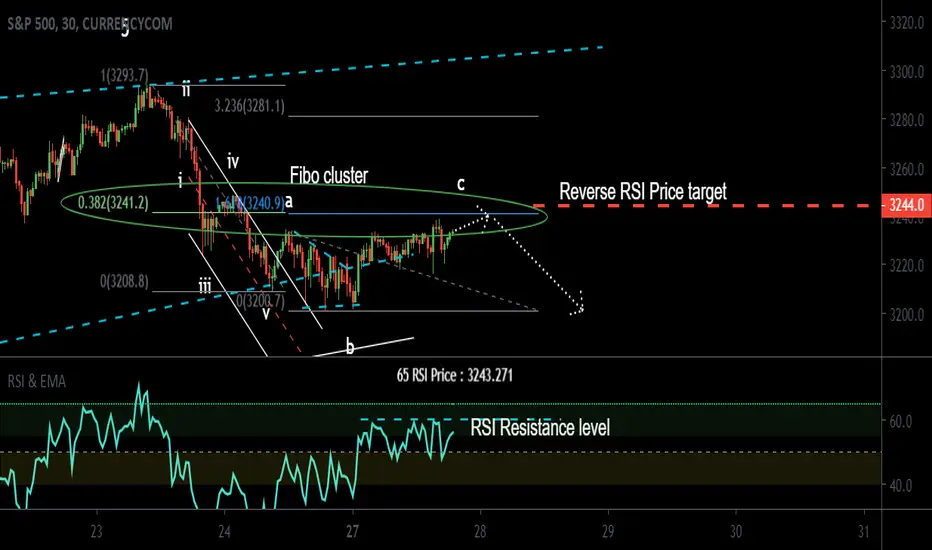
S&P500 Elliot wave analysis,25/07/20 watch 3180$The ending triangle tend line is broken. I will consider a bearish scenario and entering wave 1 of the reversal only if we break through 3180$
For Bullish scenario
1- Wait for the confirmation level(3180$) to break
2- You might see a pull back , sell if you see a sell candle in the pullback(usually happens at 50%-61.8% fibo ratio)
3- Stop loss at 3293.7$
** MAKE SURE YOU ARE NOT RISKING MORE THAN 1-3% Of YOU WHOLE TRADING ACCOUNT, THE AMOUNT OF MONEY YOU LOOSE IF WE HIT THE STOP LOSS MUST NOT BE MORE THAN 1-3% OF YOUR WHOLE CAPITAL***

S&P500 Elliot wave Update,27/07, bearish countThere is a fibo cluster at 2343 and also the RSI resistance level is at 2343
this suggest that this level could be a potential price target to start another wave down
S&p500 elliot wave Update, 28/07 crash time???I was counting this market and everything is going based on predication and things published before.
The crash after the triangle seems to be an impulsive wave but it is not confirmed yet.
DON'T SHORT , wait for the confirmation
I will wait for this down move to finish and if it is impulsive I will consider it as was 1 of 3