Breakdown or Bounce Incoming? | BTC 4H Analysis D4🥳 Hey everyone! Hope you’re doing great! Welcome to SatoshiFrame channel .
✨ Today we’re diving into the 1-Day BITCOIN analysis. Stay tuned and follow along!
👀 Yesterday I shared Bitcoin’s daily analysis in the channel, and today we’re going to review the 4-hour timeframe, from its recent all-time high up to the present.
🔍 After setting its ATH, Bitcoin entered a descending channel (driven by profit-taking and reactivated whale activity). Each time price reached the top of this channel, it was rejected and moved toward the midline or bottom. The last touch of the channel’s top led to another drop toward the midline, and price failed to break above the channel. The major buy zone (micro buyer area) at the top of the channel was lost and has now turned into a key static resistance, overlapping with the dynamic channel resistance — creating a crucial pivot zone for Bitcoin’s potential trend reversal. The next key support lies below this zone at $105,634; a confirmed break and close below it could extend the downtrend further.
🧮 The RSI oscillator is currently fluctuating between 30 (support) and 50 (resistance). A breakout beyond either side — as highlighted in the chart — could add significant momentum to Bitcoin’s next move. These RSI levels are default static zones, which makes their reliability stronger.
🕯 After the massive flash crash that shook the crypto market, traders have shown a stronger inclination toward selling, keeping Bitcoin within this descending channel. As seen in the volume data, the flash crash was accompanied by extreme selling pressure, and whales broke the micro buyer zone with a large “whale candle.” Continued selling pressure could push Bitcoin toward lower supports, while renewed buying volume and whale re-entry could drive it back toward the channel top to test that resistance once more.
🧠 For those without open positions, here are two key scenarios to consider:
🟢 Long Setup: A breakout above the key static + dynamic resistance zone at $109,222, along with increasing buy volume and RSI crossing above 50, could be a solid long opportunity.
🔴 Short Setup: A confirmed breakdown below the nearest support at $105,634, accompanied by strong selling pressure and RSI falling below 30 into oversold territory, could present a strong short setup.
❤️ Disclaimer : This analysis is purely based on my personal opinion and I only trade if the stated triggers are activated .
Satoshiframe

BITCOIN From ATH to Breakdown | BTC 1D Analysis D3😎 Hey everyone! Hope you’re doing great! Welcome to SatoshiFrame channel .
👍 Today we’re diving into the 1-Day BITCOIN analysis. Stay tuned and follow along!
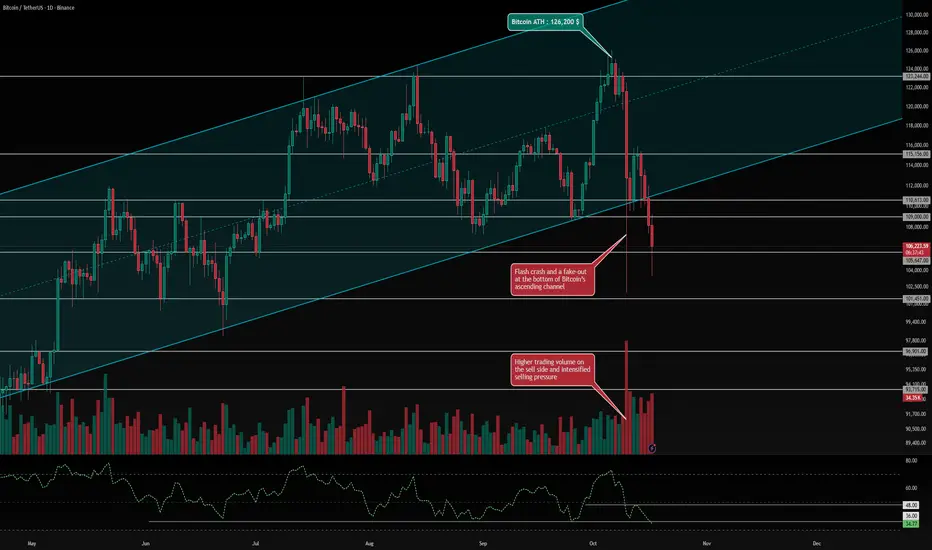
👀 Bitcoin has been trading within a strong ascending channel, recently hitting the upper boundary and setting a new all-time high (ATH) at $126,200. However, this was immediately followed by a flash crash that wiped out roughly $20 billion in futures positions. During the crash, the lower boundary of the ascending channel was also fake-broken, after which buyers temporarily pushed the price back inside the channel. Yet, due to extreme market fear and uncertainty, Bitcoin lost its key support zone at $110,613, continuing the downtrend that began with the flash crash. With yesterday’s daily candle close, Bitcoin officially broke down from its ascending channel, and price action is now heading toward lower support levels. The nearest support lies around $105,647, and if this zone fails to hold, Bitcoin could extend its decline toward the next support at $101,451.
🔍 Bitcoin currently faces two major resistance zones at $109,000 and $110,613. A confirmed breakout above these could signal the start of a reversal, but the main long trigger is located at $115,156. If Bitcoin breaks and holds above this zone with strong buying volume, it could mark the beginning of a powerful bullish leg, potentially leading to a new ATH.
🧮 The RSI oscillator is now sitting near its support region around 36. A daily close below this level would strengthen bearish momentum and could push RSI into oversold territory. The midline resistance sits near 48, and a breakout above this would indicate a possible trend reversal toward renewed bullish momentum.
🕯 Recent candlestick volume shows extremely high selling pressure, marking one of the most intense liquidation waves in recent crypto history. The number of red candles has surged in recent days, suggesting a continuation sell-off pattern, with traders increasingly favoring short positions. The market is currently in extreme fear, and for any bullish reversal to occur, Bitcoin would need massive buy-side volume and strong support to push prices back up. Without that, more long-term holders may start selling as well.
🧠 Current Scenarios (Daily Timeframe) — Patience is key. If you haven’t already entered a short based on previous analyses, consider these setups:
🟢 Long Scenario: Enter on a confirmed breakout and consolidation above $115,156, accompanied by a spike in buying volume and an RSI move above 48.
🔴 Short Scenario: Enter on a confirmed breakdown and close below $105,647, which could trigger a deeper correction toward lower levels. This move would likely coincide with continued selling pressure and RSI dropping below 36 into the oversold zone.
❤️ Disclaimer : This analysis is purely based on my personal opinion and I only trade if the stated triggers are activated .
Possible Next Moves for Ethereum | ETH 1H Analysis D2👋 Hey everyone! Hope you’re doing great! - ❤️ Welcome to Satoshi Frame .
📅 Today we’re diving into the 1-hour Ethereum analysis. Stay tuned and follow along!
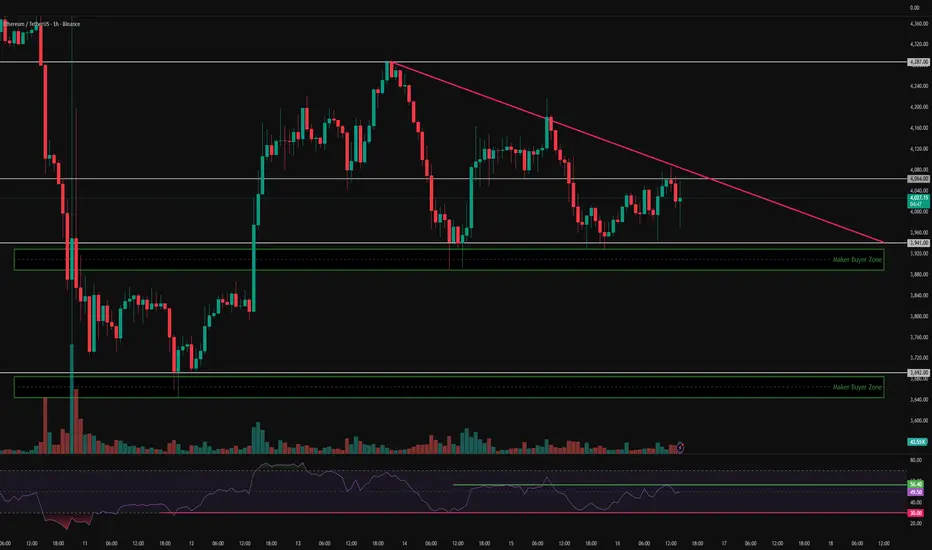
👀 On the 1-hour timeframe of Ethereum (ETH), we can see that ETH is currently moving inside a triangle compression structure, and it has now reached the final third of that triangle — meaning we’re waiting for a breakout to trigger a trade. The red trendline, which forms the upper edge of the triangle, acts as a dynamic resistance and overlaps with the $4064 resistance zone — creating a strong Long trigger setup. The bottom of the triangle acts as our Short trigger, where a confirmed break below it, combined with a Maker Buyer zone breakdown, could start ETH’s next move and break it out of this compression phase.
🧮 Looking at the RSI oscillator, ETH is currently fluctuating between 56.4 and 30. A breakout beyond either side of this range could enhance trading volatility and increase ETH’s momentum in the upcoming move.
🕯 Analyzing ETH’s volume, we can see that upon reaching the Maker Buyer zone, buying volume has increased — causing a noticeable reversal reaction from that level. If ETH continues to see increased buying pressure, it can break through resistance; otherwise, if it faces selling pressure, a large whale candle will be needed to break the Maker Buyer zone to the downside.
🧠 For Ethereum positioning, we can define two clear scenarios — since the price is near the end of its compression, these setups are relatively simple and well-defined:
🟢 Long Scenario: A breakout above the static + dynamic resistance at $4064, combined with RSI moving above 56.4 and increasing buying volume, could push ETH toward higher resistance levels.
🔴 Short Scenario: A break below the key Low at $3692, accompanied by a large whale candle cutting through the Maker Buyer zone and RSI dropping below 30 to enter its 1-hour OverSell area, would confirm bearish momentum. Note that if ETH dips slightly these days, many major projects, institutions, and even government-linked entities have been accumulating heavily within this identified Maker Buyer zone — so it’s wise to approach short positions with reduced risk exposure.
❤️ Disclaimer : This analysis is purely based on my personal opinion and I only trade if the stated triggers are activated .
Can BTC break the 111681$ resistance? | BTC 1H Analysis D2👋 Hey everyone! Hope you’re doing great! - ❤️ Welcome to Satoshi Frame .
📅 Today we’re diving into the 1-hour Bitcoin analysis. Stay tuned and follow along!
👀 On the 1-hour timeframe of Bitcoin (BTC), we can see that — similar to USDT.D — it is moving within a range box, but inversely positioned near a Maker Buyer support and a multi-timeframe Low at $111,681. A confirmed breakout above this zone could push Bitcoin upward toward the box midline.
🧮 Looking at the RSI oscillator, we can see that it’s currently oscillating between the Oversell (30) Low and the static ceiling around 53. A breakout beyond either of these boundaries would likely signal the start of Bitcoin’s next move.
🕯 Recent volume on Bitcoin has increased as it reached the Maker Buyer zone — strong buying pressure from market makers has helped defend this support level effectively. Right now, Bitcoin sits just below a resistance area that will require a significant uptick in buying volume to break and confirm stability above it.
🧠 For Bitcoin positioning, we can consider that this current Low is very strong and unlikely to break easily, so the main focus should remain on long positions:
🟢 Long Scenario: Once Bitcoin breaks the multi-timeframe resistance at $111,681, combined with RSI surpassing the 53 threshold and a visible increase in buying volume, a long position setup becomes valid.
🔴 Short Scenario: Since the Maker Buyer support is very strong and USDT.D has been repeatedly rejected at its top, it’s better to wait until the Maker Buyer zone breaks with a large whale candle before considering short setups.
❤️ Disclaimer : This analysis is purely based on my personal opinion and I only trade if the stated triggers are activated .

Ethereum 1H Analysis – Key Battle at $4,278 Resistance | D1👋 Hey everyone! Hope you’re doing great!
💥 Welcome to Satoshi Frame — today we’re diving into the 1-hour Bitcoin analysis. Stay tuned and follow along!
👀 1-hour timeframe of Ethereum, and we can see that Ethereum, after the heavy drop it experienced, broke down from the 4278$ area and moved toward its lower support levels. A major support level has formed around the 3692$ area, where we saw strong buyer support, and they pushed the Ethereum price upward. After the upward movement and buyer support, as Ethereum approached its resistance in the 4278$ area, the buying volume decreased, and then buyers’ strength ended. Sellers, with strong momentum and multiple red candles, pushed the price down toward the 3941$ support, where the price was supported again. Now a higher low has formed compared to the 3941$ bottom, and the price is moving toward its key resistance area at 4278$.
🧮 We can see in the RSI oscillator that there is a key level around 70, which is the OverBuy boundary. If the fluctuation limit passes this area, Ethereum can break its resistance around 4278$.
🕯 Regarding volume, there is an educational note that when the price approached the 4278$ resistance, it faced a decrease in buying volume and was rejected from this area with many red candles. Now that the price is moving toward this resistance, if it is accompanied by an increase in buying volume, it increases the probability of breaking this resistance for us.
🧠 For the Ethereum position, a breakout of the 4278$ area is needed, and now if the price moves toward this area, it will form our second touch and create several scenarios for us.
↗️ First scenario for long position: breakout of resistance accompanied by an increase in volume and setting the trigger at 4278$, which gives us a large stop size and reaches its risk-to-reward ratio later.
↗️ Second scenario for long position: wait for the price to have a reaction to the 4278$ area and then create a higher high and higher low for us, and we can enter on the created higher low and place our stop below that same low.
❤️ Disclaimer : This analysis is purely based on my personal opinion and I only trade if the stated triggers are activated .

BTC 1H Box Breakout Setup | D1👋 Hey everyone! Hope you’re doing great!
💥 Welcome to Satoshi Frame — today we’re diving into the 1-hour Bitcoin analysis. Stay tuned and follow along!
👀 On the 1-hour timeframe of Bitcoin, we can see that after its recent drop, Bitcoin has entered a one-hour consolidation box. The top of this box is around $115,802, and the bottom is at $110,224. A breakout from this box could lead to the next impulsive move. Currently, Bitcoin’s price is near the midline of the box at $113,222 — and if it breaks and stabilizes above this level, Bitcoin could start moving toward the top of the box and potentially break above it.
Notice that Bitcoin reacted to the buyer-maker zone near the bottom of the box, showing a reversal pattern. With buying pressure pushing it upward and a higher low forming, the probability of a midline breakout has increased.
🧮 Looking at Bitcoin’s RSI oscillator, it’s currently near the static resistance around the 54 range. If RSI breaks and stabilizes above this level, long-trade momentum is likely to increase, which could help Bitcoin break through the midline and become more bullish.
🕯 Let’s first discuss the maker-buyer zone, which acts as a major support area for buyers and institutions that accumulate their positions here. This area tends to create counter-direction reactions in Bitcoin. Right now, Bitcoin has formed a higher low just below the midline and is showing increasing buying volume, with larger candle sizes appearing on the chart.
🧠 For Bitcoin’s trading setup, once the midline breaks, we can consider entering a position, forming a potential long scenario:
↗️ Long Position Scenario:
If Bitcoin breaks and stabilizes above $113,222, accompanied by an RSI breakout above 54 and a rise in buying volume, it could move toward the top of the box and provide a solid long opportunity.
❤️ Disclaimer : This analysis is purely based on my personal opinion and I only trade if the stated triggers are activated .

$ETHUSDT Analysis - Oct 10 | 4H Time FrameBINANCE:ETHUSDT Analysis - 4H
Hello and welcome to another analysis from the Satoshi Frame team!
I’m Abolfazl, and today we’re going to analyze Ethereum on the 4-hour timeframe.
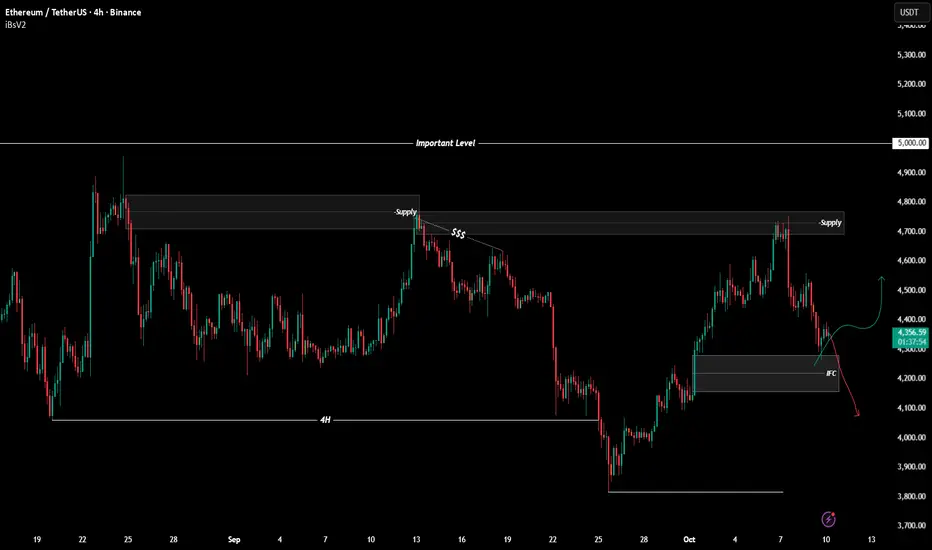
After rejecting from the supply zone, Ethereum has reached an IFC, which could cause a price pullback.
On the 15-minute timeframe, look for confirmation signals to enter a long position — the first target is around $4,520, followed by $4,750.
Keep in mind that this setup is very risky, and no entry should be taken without proper confirmation.
The second scenario is a break below $4,200, which could provide a short opportunity targeting $3,950, and then the 4H low. (The break must be confirmed by a full candle close, not just a shadow.)
These scenarios allow you to align with price movement in both directions — the key is to wait for precise confirmations before entering any trade.
See you in the next analyses!
Stay tuned with the Satoshi Frame team...
EigenLayer Daily view| DeFi’s Ethereum Restaking Power💀 Hey , how's it going ? Come over here — Satoshi got something for you !
⏰ We’re analyzing EIGEN on the 1-Day timeframe , this coin ranks 132 on CoinMarketCap. It’s a restaking project on the Ethereum network, highly valued and reputable in the DeFi space, and backed by well-known Ethereum developers .
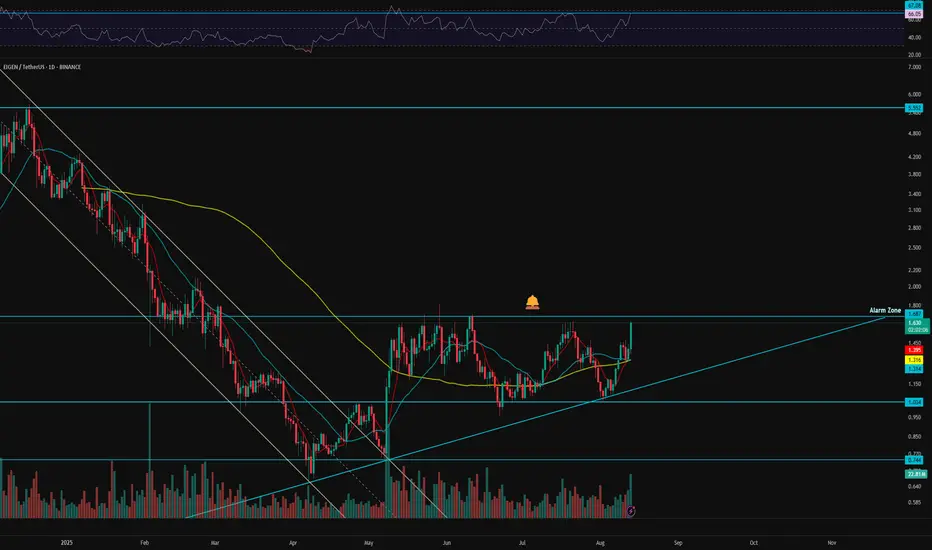
👀 After breaking out of a strong descending channel, this coin moved toward its resistance zone at 1.687 within just three days under strong buying pressure. It was then rejected from this level and formed a bottom at 1.034. This bottom is close to a drawn trendline, and the latest touch of this trendline triggered many buy orders, bringing in significant buying momentum. The key zone for entering a trade is the resistance area that has seen roughly five reactions, each time resulting in rejection. If this daily box breaks, the coin could move to higher price levels.
👑 The 7-day moving average has crossed above both the 25-day and 99-day moving averages, indicating strong buyer power and upward momentum. Moving averages are often used for martingale strategies and as setup confirmations.
⚙️ On the RSI, the key resistance lies around 67.08. A breakout above this level increases the chance of entering the overbought zone, though the major strong resistance is at 70.
🕯 Both trading volume and transaction count are rising, and usually, for coins considered “Ethereum ecosystem projects,” volumes can spike sharply when Ethereum dominance falls.
🔔 We’ve set an alert zone at the 1.687 resistance level. When the price reaches this zone, you can watch the price action and, with confirmation, consider entering a trade.
🖥 Summary : If EigenLayer breaks the 1.687 zone, it could reach much higher price levels. Since it offers a restaking product to the crypto community, it has the potential for strong price surges, as most of its past pumps have happened within just a few candles—even one candle. Don’t forget to set your alert at 1.687 .
❤️ Disclaimer : This analysis is purely based on my personal opinion and I only trade if the stated triggers are activated .
Memecoin DailyView | The Web3 Power of Memeland💀 Hey , how's it going ? Come over here — Satoshi got something for you !
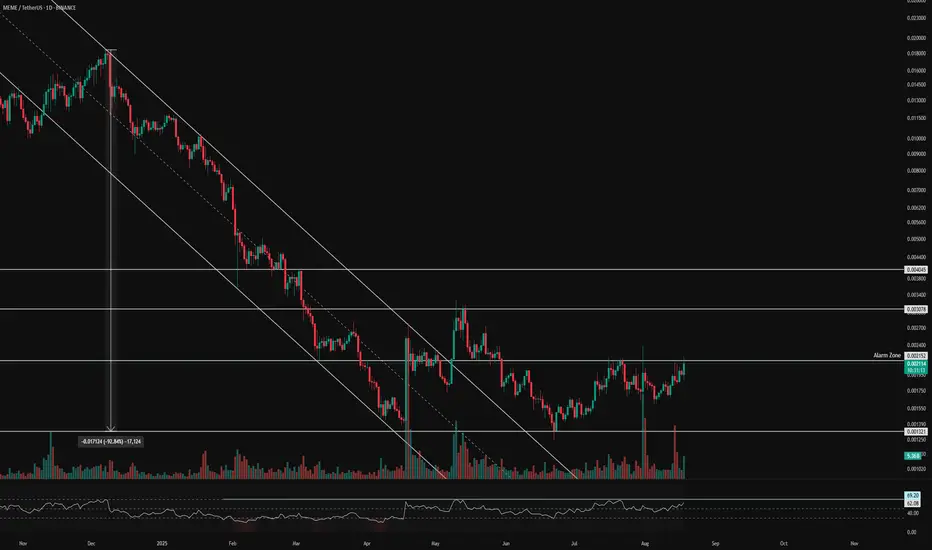
⏰ We’re analyzing Meme on the 1-Day timeframe .
👀 On the daily timeframe of Memecoin, we can see that after a deep 93% correction, MEME broke out of its descending channel. It then faced another pullback on lower timeframes. A very strong bottom was formed around 0.001321, and from this level, with increasing volume and trades, MEME moved upward towards the resistance at 0.002152. Currently, it is trying to break this resistance, which has previously acted as the top of the box and caused rejections .
⚙️ The key RSI level is at 69.20–70. If this level is broken, increased buying momentum could push MEME into the Overbought zone, attracting more buyers .
🕯 Today, the number of long trades has increased, and the size of today’s daily candle looks strong so far. With more buying volume, MEME could break this resistance and aim for higher price levels .
💡 This coin was created by the 9GAG team, who are active in the memecoin sector. The project is a new form of internet money inspired by meme culture. It currently ranks #337 on CoinMarketCap. The project is fully decentralized and operates as a DAO, where NFT holders take part in governance and decision-making .
🔔 The Alert zone is at 0.002152. If this level breaks and confirms, it could provide a good entry for long trades. The short position alert zone is below the daily bottom, but personally, I would avoid shorting this coin .
❤️ Disclaimer : This analysis is purely based on my personal opinion and I only trade if the stated triggers are activated .
BONK 4H Analysis – Key Triggers Ahead💀 Hey , how's it going ? Come over here — Satoshi got something for you !
⏰ We’re analyzing BONK on the 4-hour timeframe timeframe .
👀 In the 4-hour timeframe of Bank, we can see that Bank had a good descending channel, which with the recent drop reacted to the midline of the channel and then moved towards the top of the channel, and with a strong 4-hour whale candle, it stabilized above its descending channel and is now completing a pullback to its channel in multi-timeframe.
⚙️ The key RSI area is the 59 zone, which if the fluctuation passes this level, Bank can move upwards and have a trend reversal after this corrective wave.
🕯 The heavy and good increase in Bank’s volume at this bottom shows the presence of the market maker, the size of the 4-hour candle with which we broke the channel top also seems whale-like.
📊 The OTHERS.D index and we can see, this index is inside a 4-hour box, with the breakout of the top of this box which is at the 7.9% area, good money enters Bank. The midline of this box is at the 7.74% area, which if lost, our analysis can fail.
🔔 The areas we considered as alarm zones are the midline area and the top area. As long as we are above the midline area, we can open our position with low risk and a big stop, which is almost high-risk. The alarm zone 0.00002357 can be a more reliable area for breakout and taking trades. Keep in mind that the market conditions seem risky and the market is in decision-making mode.
❤️ Disclaimer : This analysis is purely based on my personal opinion and I only trade if the stated triggers are activated .

HBAR 4H Analysis – Key Triggers Ahead💀 Hey , how's it going ? Come over here — Satoshi got something for you !
⏰ We’re analyzing HBAR on the 4-hour timeframe timeframe .
👀 On the 4H timeframe for HBAR , we can observe that this coin is ranging inside a box with very strong support and resistance levels. The last time, it reacted to the midline of this box (50% zone) and has built a trading structure for a potential breakout.
⚙️ The key RSI levels are at 57 and 35. Once the oscillation surpasses these levels, the price of this coin can shift and bring momentum into the market. Keep in mind that these zones often indicate increased volatility in the direction of price movement.
🕯 The volume of this coin has been decreasing over the past few days, and the number of trades has significantly dropped. Many buy and sell orders have been filled, and the coin is currently ranging in this box, deciding its next direction. Notice that with declining volume, we can often identify a new trend forming, since the current trend may be coming to an end.
📊 On the OTHERS.D index 4H timeframe , we can see that it is also moving inside a box, with the top of the box at the 7.9% zone . Breaking this level along with the RSI surpassing 63 could bring strong volume into the market. At the same time,
📊 a breakout on the TOTAL3 index would also inject solid volume into the market. This index is likewise inside a box, and the last time it reacted to its midline, it rebounded upward and is now moving toward the 1.08 resistance.
💰 Looking at the HBAR/BTC pair , we can observe that it has formed a box-like structure, similar to its USDT pair. With a breakout above the midline, more Bitcoin could be liquidated and converted into this coin. HBAR is considered one of the whales’ favorite coins.
🔔 The alert zones for HBAR carry some risk, and the possibility of failure should also be considered. The long alert zone is around 0.25846, which is the midline of this 4H box. The short alert zone is around 0.22784. Breaking this zone could provide a short position, coinciding with a deeper correction for this coin.
❤️ Disclaimer : This analysis is purely based on my personal opinion and I only trade if the stated triggers are activated .

DOGE 1D Analysis – Key Triggers Ahead💀 Hey , how's it going ? Come over here — Satoshi got something for you !
⏰ We’re analyzing DOGE on the 1-Day timeframe timeframe.
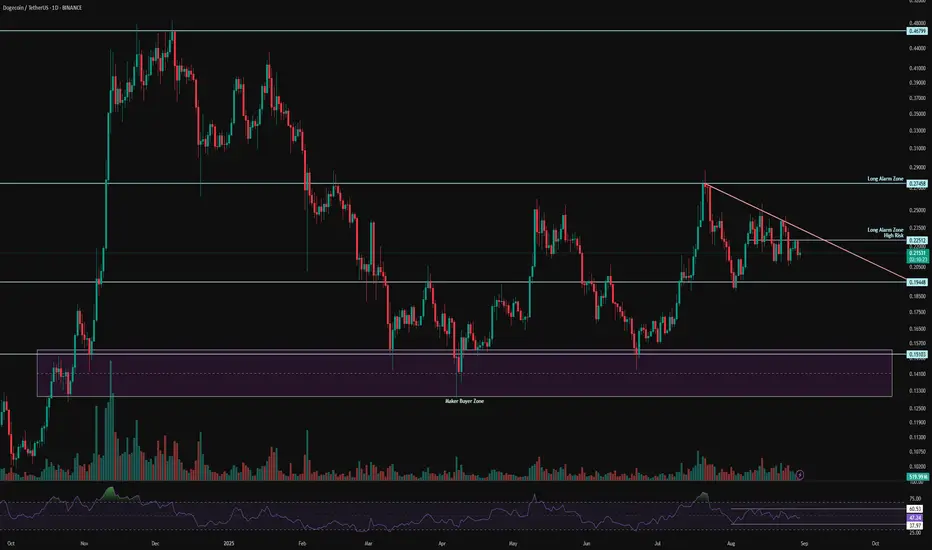
👀 In the daily timeframe of Dogecoin, DOGE is within a 170-day box with a ceiling at $0.27 and a floor at $0.15. With a breakout of this box, Dogecoin can experience a parabolic move. DOGE is currently in a triangle-like compression, and with an exit from this compression, DOGE can start its upward movement.
💰 In the daily timeframe of DOGEBTC , We observe that the volume has significantly decreased, and much less Bitcoin is being converted into DOGE! This is quite interesting. The reason DOGE has a box-like behavior against Tether is due to its pairing with Bitcoin. Bitcoin has gained more value against Dogecoin, and DOGE has entered an accumulation phase. Breaking out of this box can help DOGE experience a price jump.
⚙️ Two key RSI zones have been considered: 60 and 38. Exceeding these levels can help DOGE break out of the compression. The 60 level coincides with the break of the $0.22 area and the top of the compression.
🕯 There is a micro buyer zone around $0.15, where every time the price reaches this area, a reversal occurs, accompanied by an increase in the size and volume of green candles. Currently, during the holidays, we are in a compression with lower volume. As the new week begins, we need to see what happens next.
🔔 The alarm zone for Dogecoin is $0.22, which can present some risky trading opportunities, and the next zone is $0.27, which is a strong price action level. Breaking this ceiling can allow DOGE to reach higher recovery levels against Bitcoin.
❤️ Disclaimer : This analysis is purely based on my personal opinion and I only trade if the stated triggers are activated .
TON 1D Analysis – Key Triggers Ahead💀 Hey , how's it going ? Come over here — Satoshi got something for you !
⏰ We’re analyzing TON on the 1-Day timeframe timeframe .
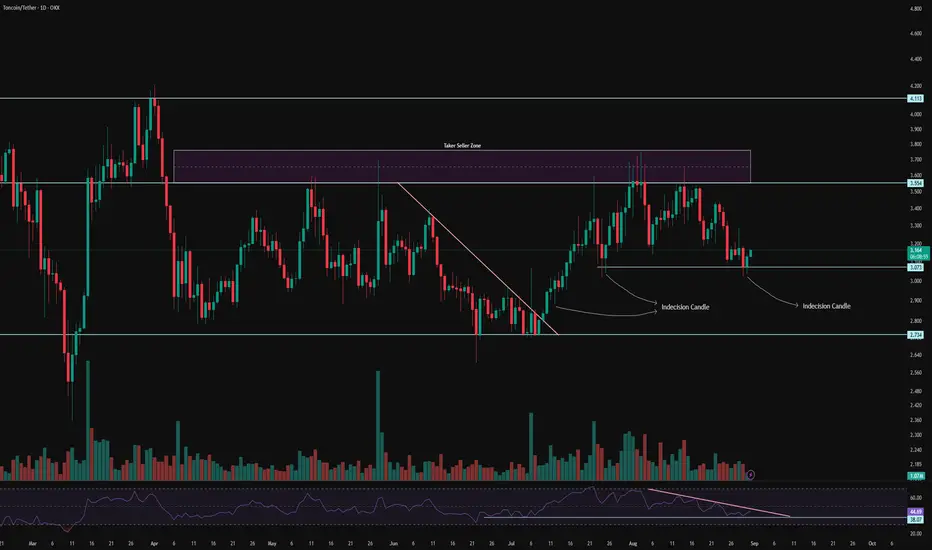
👀 On the daily timeframe of Toncoin, we can see that Toncoin has very high credibility in the crypto space, and recently even Snoop Dogg and Toncoin did an NFT drop together which was amazing. Toncoin is in a range with a box structure, with the top of this box at the $3.553 area and the bottom of this box at the $2.734 area. The price of Toncoin has been fluctuating inside this price box for about 150 days so far.
⚙️ This time, since we are analyzing the beloved coin of hearts, we try to use all the technicals we know. Our key RSI level is at 38, and a descending trendline has been drawn on this oscillator as well, which shows compression and reduced volatility. This means that Toncoin can soon break out of this compressed volatility. With increased volatility in the upcoming week, Toncoin could move upward.
🕯 Looking at Toncoin’s volume in the daily timeframe, we can see that after breaking its trendline, Toncoin broke out of its compression and showed a significant increase in volume for the bullish trend. The size and volume of green candles are larger compared to the red ones, and 50% of Toncoin holders are still keeping their coins and haven’t sold. The one-day indecision candles for Toncoin have been respected by buyers and each time have pushed the price upward.
💎💰 On the daily timeframe of TONBTC, we can see that after breaking its descending trendline, Toncoin experienced an upward trend and moved 25% higher, then it was rejected from the seller ticker area and moved toward the midline of its box. From this area, it has been supported by two indecision candles, but a compressed range structure has formed. With a breakout from this compression, Toncoin can experience other price levels.
🔔 To determine the alert zones for Toncoin, we look at the 4-hour multi-timeframe. On the 4-hour timeframe of Toncoin, we can see that a short-term resistance has formed at the $3.177 price level. With a breakout of this area, Toncoin can experience a short-term price recovery. This area seems to be a good level to observe price behavior.
❤️ Disclaimer : This analysis is purely based on my personal opinion and I only trade if the stated triggers are activated .
HYPE 4H Analysis - Key Triggers Ahead💀 Hey , how's it going ? Come over here — Satoshi got something for you !
⏰ We’re analyzing HYPE on the 4-Hour timeframe .
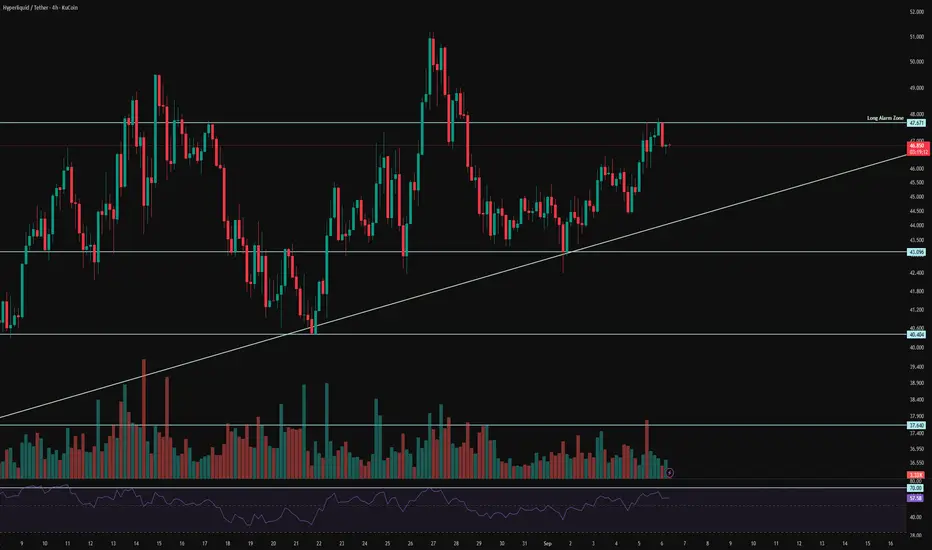
👀 On the 4H timeframe for HyperLiquid coin, we can see that the project is managed by the decentralized HyperLiquid exchange, which has become one of the notable platforms these days and has strong backing. Shortly after the news, the coin started moving toward its resistance but got rejected with a whale 4H candle from the $4,767 zone. Compared to other coins, this one has held up quite well and hasn’t gone through a deep correction. Yesterday’s rejection zone after the NFP news serves as a solid trigger point and even gives us a tight stop-loss setup.
⚙️ The key RSI level for HyperLiquid is around 70, which is the Overbought threshold. If RSI pushes beyond this zone, HyperLiquid could continue upward. Another point is that the coin’s recent price action has been moving along a trendline and has held well above the 50 level for several days.
🕯 The volume and size of HyperLiquid’s green candles have increased, showing strong upward momentum. Each time it forms a higher low, buyers respect the level and push in more volume. Based on this behavior and the previous leg up, the coin is now close to its all-time high, and with market strength, it has the potential to break that level and move higher.
📊 Looking at HyperLiquid vs. Bitcoin, there isn’t a chart available on TradingView, but you can see it on CoinMarketCap. HyperLiquid is a whale-favorite coin and has shown strong bullish performance against Bitcoin, moving steadily upward.
🔔 The alert zone for HYPE is at $47.67. If this level breaks, the coin could start a strong bullish move and head toward its all-time high.
❤️ Disclaimer : This analysis is purely based on my personal opinion and I only trade if the stated triggers are activated .
TAO 4H Analysis - Key Triggers Ahead💀 Hey , how's it going ? Come over here — Satoshi got something for you!
⏰ We’re analyzing TAO on the 4-Hour timeframe.
👀 On the 4-hour timeframe for Bittensor (TAO), we can see that this coin belongs to the AI category on CoinMarketCap and currently holds rank #35. TAO had been moving inside a continuation descending channel, but it has now successfully broken out of this channel. With a completed pullback and a proper setup candle confirmation in multi-timeframe analysis, this could present a trade opportunity.
⚙️ Key RSI levels for this coin are at 70 (overbought threshold) and 35 (near oversold). At the start of the current leg, during the holiday session, volatility increased strongly, and TAO managed to break through its swing resistances. If RSI pushes above 70 and enters the overbought zone, the coin could experience a solid bullish move.
🕯 The number of green candles has been increasing, and TAO also reacted well to the channel top. At the same time, a major resistance at $322 was broken, with all sell orders at that level fully absorbed.
🪙 Looking at the TAO/BTC pair on the 4-hour timeframe, we can see that after breaking through its previous resistance, the pair is currently consolidating and completing a pullback at this zone. Once the pullback is confirmed with a setup candle, we could have a strong trade confirmation.
💡 The key alarm zones for this coin are:
Around $322, where a reaction followed by a bounce can push the price higher.
With a successful breakout above $327, TAO could gain momentum and continue its bullish trend.
❤️ Disclaimer : This analysis is purely based on my personal opinion and I only trade if the stated triggers are activated .

BNB 1H Analysis - Key Triggers Ahead😃 Hey , how's it going ? Come over here — Satoshi got something for you!
⏰ We’re analyzing BNB on the 1-Hour timeframe.
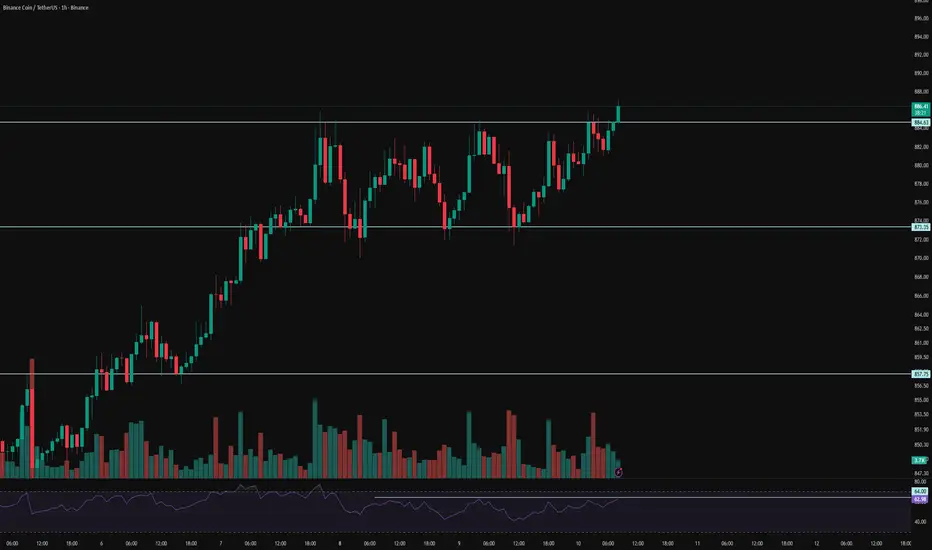
👀 On the 1-hour timeframe of Binance Coin we can see that this coin, the popular token of Binance exchange with very strong backing, has formed a very important resistance at $885. With a breakout and confirmation above this level, and if the PPI news is positive, BNB could start another strong upward move.
⚙️ The key RSI level for this coin is at 64, and breaking above this level could give BNB higher volatility and even a price surge.
🕯 The volume, size, and number of green candles are increasing, and it seems we are almost exiting the range structure. With buying pressure and rising volatility, BNB could form more green candles and experience solid price growth.
🌒 On the 1-hour timeframe of the BNBBTC pair we can see that it has been rejected from the 0.007915 zone, which has created a trigger for a breakout at this level. If this zone is broken, BNB could also break its marked resistance in the USDT pair and move upward.
💡 This coin had resistance at $885, which has now been broken, and it is moving upward. A pullback to this resistance also happened during this breakout, which was executed well. For confirmation, you can also check the 15-minute timeframe.
❤️ Disclaimer : This analysis is purely based on my personal opinion and I only trade if the stated triggers are activated .
ETH 4H Analysis - Key Triggers Ahead | Day 19😃 Hey , how's it going ? Come over here — Satoshi got something for you!
⏰ We’re analyzing ETH on the 4-Hour timeframe.
🔭 ETH 4H Chart: Observing Ethereum on the 4-hour timeframe, after breaking the midline of the box, ETH closed above the box. Then, following the news, it formed a shadow that hit the lower box level, triggering a series of buy orders. Now, we’re watching to see if ETH will continue upward. The overall trend behind ETH is still bullish, and a breakout above the multi-timeframe range could push it toward the box’s top again.
⛏ Key RSI Levels: ETH’s RSI is around 70 and 50. A breach of these levels could signal the start of a move, especially following today’s inflation news impact.
💰 Candle Size & Volume: Green candle sizes and volume have increased. Yesterday, $164M of ETH was bought via ETFs, which is notable.
🪙 ETHBTC 4H Chart: Observing the ETH/BTC pair on the 4-hour timeframe, this pair tends to act slightly more precisely compared to ETH/USDT. Currently, it’s trading within a box with declining volume. News caused a reaction at the top of the box. If the box’s top breaks, a significant amount of BTC could convert into ETH, potentially pumping the ETH/USDT pair as well.
🔔 Entry & Target Zones: A potential early entry is around $4443, with the box top at $4500 — a strong resistance. If ETH breaks this level, it could aim for a new ATH. Make sure to confirm across multiple timeframes before taking a position.
❤️ Disclaimer : This analysis is purely based on my personal opinion and I only trade if the stated triggers are activated .

BTC 1H Analysis - Key Triggers Ahead | Day 39😃 Hey , how's it going ? Come over here — Satoshi got something for you!
⏰ We’re analyzing BTC on the 1-Hour timeframe.
👀 On the 1H timeframe for Bitcoin, we can see that BTC has been ranging since yesterday’s news. A breakout and confirmation above the range high or below the range low will give us a trading setup. The key levels are $114,407 on the upside and $113,528 on the downside.
Today’s hot topic is the US CPI inflation data, which is a high-impact event at the very top tier of importance.
⚙️ On the RSI, Bitcoin is moving between the 50–70 zone. A breakout beyond these values, in alignment with a price breakout, could generate strong trade entries.
🕯 Candle structure shows that green candles are getting larger with more volume, while red candles are more frequent but smaller each time—so much that the market is starting to ignore them. The range high is very critical; it could break with a whale candle or even an indecision candle right before the move. Order type matters here—whether you use a trigger order or market entry on candle open will impact the trade.
📊 On the 1H Tether dominance, we’re also seeing a range—opposite in behavior to Bitcoin—with a range high at 4.37% and low at 4.32%. With BTC’s underlying trend on the 1H still bearish, there’s a decent probability of a downside break in USDT dominance while BTC breaks the upside of its range.
📊 On the 1H BTC.D , after a strong leg down, BTC.D has dropped below the 0.618 retracement level of its previous range and failed to hold support. We might see a small bounce/retest of that area, but unless today’s CPI causes major volatility, the broader expectation remains further downside in dominance.
🔔 The CPI report could bring serious volatility today. Yesterday’s news triggered nearly $750M worth of Bitcoin buys, sparking a strong rally with only minimal compression-style pullbacks. If today’s inflation data triggers a breakout above $114,407, and we see dominance dropping at the same time, large-cap projects are likely to pump even harder than Bitcoin itself.
❤️ Disclaimer : This analysis is purely based on my personal opinion and I only trade if the stated triggers are activated .

ETH 4H Analysis - Key Triggers Ahead | Day 18😃 Hey , how's it going ? Come over here — Satoshi got something for you!
⏰ We’re analyzing BTC on the 1-Hour timeframe.
🔭 On the 4-hour timeframe of Ethereum we can see that ETH is clearly in a very strong consolidation, and for several days even the oscillator has been ranging around the 50 zone. This time-based range will eventually come to an end. Ethereum now has two important levels ahead with the upcoming news: the top of the box midline at $4373, where breaking this zone could trigger a strong pump, and the bottom zone, which is a maker-buyer area at $4252, considered a very strong and important support for Ethereum.
⛏ The key RSI levels for Ethereum are at 57 and 40. If the range of oscillation crosses these levels, ETH could gain more volatility and even move toward its overbought or oversold regions. Usually, this type of short-term consolidation ends with a good price move once the compression is broken.
💰 The size, volume, and number of green candles have really decreased, and multiple candles inside the range have formed, creating a decision-making phase for ETH. With today’s PPI news, it is likely that one of these zones will either be touched or broken, and after this news, candles are expected to come with stronger volume.
🪙 On the 4-hour timeframe of the ETHBTC trading pair we can see that it is in a descending continuation channel. Each time the price has reached the top or bottom of this channel, it has reacted with a reversal and then moved in the opposite direction. Currently, ETHBTC is above its midline and has shown a positive reaction to it. The volatility of this pair has significantly decreased in recent days and is now ranging under its 50 zone. A breakout above the channel top and the 0.03893 level could start a bullish move.
💡 The zones we are considering for Ethereum’s top and bottom are $4493 and $4252. Breaking either of these levels after this multi-day consolidation could start a strong trend and even a sharp directional move! Keep in mind that war and economic news have created interconnections for risky markets—trade with low risk.
❤️ Disclaimer : This analysis is purely based on my personal opinion and I only trade if the stated triggers are activated .

BTC 4H Analysis - Key Triggers Ahead | Day 38😃 Hey , how's it going ? Come over here — Satoshi got something for you!
⏰ We’re analyzing BTC on the 1-Hour timeframe.
👀 On the 4-hour timeframe of Bitcoin we can see that Bitcoin was under a descending trendline, and each time it touched this trendline it faced selling pressure. Bitcoin broke this trendline at the end of August, and since the beginning of September until now it has been ranging below the $113,000 resistance, where it has touched this level 3 times and then got rejected downward. Usually, these kinds of zones don’t break easily, and if they do, it is together with major global economic news.
⚙️ The key RSI zone of Bitcoin in the 4-hour timeframe is at 65. A swing scenario is considered for Bitcoin after the news, and if this news comes in favor of the risky market (crypto), it can move above the 65 range and even enter overbought territory.
🕯 The size, volume, and number of green candles have almost increased, while red candles are still accompanied by selling pressure. There is a taker-seller zone above, at the $113,000 resistance, that has kept the price down. With the release of news, a good wave of capital can enter or exit the market.
📊 On the 4-hour timeframe of USDT.D we can see that Tether dominance is in a very important support zone, and losing this support can bring good volume into the market. I think this support break can also happen with today’s PPI news. Tether dominance, like Bitcoin, was above a continuation ascending trendline, but now it has broken the trendline and is ranging below it. This shows us the importance of the news!
📊 On the 4-hour timeframe of BTC.D we can see that Bitcoin dominance is in a support zone, and with a 4-hour candle that looks like multiple profit-taking it got supported and moved upward. Although the move is small, we should pay attention. The resistance zone of Bitcoin dominance is at 58.36%, and the support zone is at 58.06%. Losing these zones can give altcoins very strong moves.
🔔 Bitcoin is now under an important resistance at $113,000. If this zone is broken, it can move upward again. A very strong support zone is also built by maker buyers at $107,627, which is quite far from the current price. For a long position, wait until the taker-seller zone is taken out with a whale candle and then enter on the pullback. Also pay attention that altcoins can give us the most profit during this period when both Bitcoin dominance and Tether dominance are dropping.
❤️ Disclaimer : This analysis is purely based on my personal opinion and I only trade if the stated triggers are activated .

INJ 4H Analysis - Key Triggers Ahead💀 Hey , how's it going ? Come over here — Satoshi got something for you !
⏰ We’re analyzing MKR on the 1-Day timeframe timeframe .
👀 4H timeframe on Injective (INJ) – After breaking its downtrend line, INJ moved toward the $13.41 resistance, broke through it successfully, and is now sitting just below the $14 resistance zone. A clean breakout and confirmation above $14 could open the way toward the next resistance at $16, which also acts as a strong trigger level.
⚙️ On the RSI, the key zones to watch are 50 and 70. If momentum pushes above these levels, INJ could start a new upward leg.
🕯 Green candles are showing increased size and volume. At $14, we’ve seen a cluster of sell orders triggered – profit-taking, shorts, and spot sells. Once this selling pressure is absorbed and order books clear out, INJ has a good chance to stabilize above $14, which is a very critical level to monitor.
💰 On the INJ/BTC 4H chart, the pair also broke its trendline and resistance, now waiting for confirmation above that level. Buying volume has been strong – whales are showing preference for INJ over BTC. RSI is currently around 72+, reflecting heavy trading activity and strong momentum.
📊 Looking at the Bitcoin dominance 4H chart, after losing its support at 58.36%, dominance is moving lower toward the next support at 57.81%.
🔔 In short: $14 is the key resistance for Injective. Wait for a confirmed breakout, stabilization above it, and ideally a pullback retest before entering with a reasonable risk-to-reward setup.
❤️ Disclaimer : This analysis is purely based on my personal opinion and I only trade if the stated triggers are activated .

ETH 1H Analysis - Key Triggers Ahead | Day 17💀 Hey , how's it going ? Come over here — Satoshi got something for you!
⏰ We’re analyzing BTC on the 1-Hour timeframe.
🔭 On the 1H timeframe for Ethereum (ETH), price rejected strongly from the 4336$ resistance and started moving lower. ETH is now trading close to its support zone at 4286$, having recently broken out of a consolidation range.
⛏ On the RSI, the key levels are 70 and 37. A move beyond these zones could trigger momentum toward either overbought or oversold conditions. Keep in mind that volatility is still closely tied to macroeconomic news.
💰 Candle structure shows increasing red candle size and volume, signaling stronger selling pressure. With ETH being heavily involved in both futures contracts and DeFi markets, much of this move reflects profit-taking and sell pressure at higher levels.
🪙 Looking at the ETHBTC pair on the 1H, the chart shows a steady downtrend within a compression zone. If ETH loses its current support, the pair could extend further down. The volatility index for this pair is sitting at 45.52, below the 50 zone, and with short positions picking up, ETH could face additional sell pressure.
💡 The current zone ETH is trading in looks like a maker-buy area, but likely to be broken by whale candles.
For short positions : The better setup would be to wait for a whale candle break, then enter on the pullback for higher win rate.
For long positions : A clean breakout above 4336$ would allow for an order stop-buy entry or a pullback + candlestick confirmation setup to get in long.
⚠️ Note: Today looks like a high-impact day with global shifts in play—trade with reduced risk.
❤️ Disclaimer : This analysis is purely based on my personal opinion and I only trade if the stated triggers are activated.

BTC 1H Analysis - Key Triggers Ahead | Day 37💀 Hey , how's it going ? Come over here — Satoshi got something for you!
⏰ We’re analyzing BTC on the 1-Hour timeframe.
👀 On the 1H timeframe for Bitcoin, we can see that after breaking the 111,330$ resistance, BTC managed to push higher and is now approaching its next key resistance at 113,000$. This level overlaps with the multi-timeframe range high, making it a critical zone. A clean breakout above this area could drive BTC toward higher price targets.
⚙️ On the RSI, the key zones are around 70 and 50. If momentum pushes past these levels—especially with positive news flow—BTC could enter an overbought phase, fueling further upside.
🕯 Candle structure is showing strength: green candles are getting larger with more volume. At the range high, we’ve seen some red candles forming, reflecting seller absorption. However, each test shows weaker selling pressure compared to the last time BTC hit this level—back then, price dumped sharply within just 2 red candles.
📊 Looking at Tether Dominance (USDT.D) on the 1H, after reacting to 4.45%, it broke lower toward 4.39% and even closed below that level. Right now, it’s retesting 4.39%. If this new support fails, dominance could extend lower toward the next support. A breakdown below 4.37% would be strong confirmation for BTC breaking its range high.
🔔 Trading plan : Bitcoin is currently sitting just below the 113,000$ resistance. Don’t rush into a position here. Ideally, wait for : Another test of this resistance. A confirmed breakout with a pullback/retest of 113,000$. Enter long after the retest for a safer entry.
❤️ Disclaimer : This analysis is purely based on my personal opinion and I only trade if the stated triggers are activated .
