BTC 1H Analysis - Key Triggers Ahead | Day 36💀 Hey , how's it going ? Come over here — Satoshi got something for you!
⏰ We’re analyzing BTC on the 1-Hour timeframe.
👀 On the 1-hour timeframe for Bitcoin, we can see that BTC has successfully stabilized above the alarm zone at $111,300 and is now sitting right below the resistance at $112,105. With stronger volume and volatility, this setup could give us a long trade opportunity.
⚙️ Key RSI oscillator levels are at 70 and 50. If price action pushes RSI beyond these levels, Bitcoin can continue its current bullish move and sustain the trend. At the moment, RSI is sitting just below the Overbought threshold, and once it enters this zone, the identified resistance could be broken more easily.
🕯 With the start of the new week, buying volume has increased, and the weekly candle closed fairly strong. On the 1-hour chart, the size, volume, and number of green candles are all rising.
📊 Looking at the 15-minute timeframe of Tether dominance (USDT.D), after breaking and stabilizing below 4.45%, dominance continues to move lower. The next support lies at 4.41%, and if this is broken and confirmed, Bitcoin could see even stronger upside momentum early in the week.
🔔 Currently, Bitcoin is sitting just below its resistance. The best approach is to wait for a pullback, either below or above this level, and then open a position with a setup candle confirmation or a multi-timeframe breakout. Two possible scenarios exist here, where a pullback could also give us a tighter stop-loss opportunity.
❤️ Disclaimer : This analysis is purely based on my personal opinion and I only trade if the stated triggers are activated .
Satoshiframe

ETH 4H Analysis - Key Triggers Ahead | Day 15💀 Hey , how's it going ? Come over here — Satoshi got something for you !
⏰ We’re analyzing ETH on the 4-Hour timeframe .
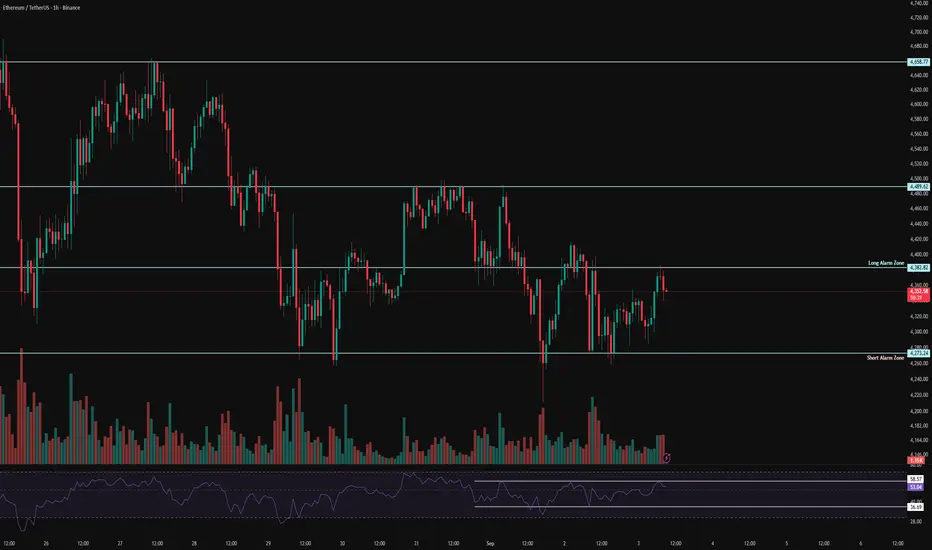
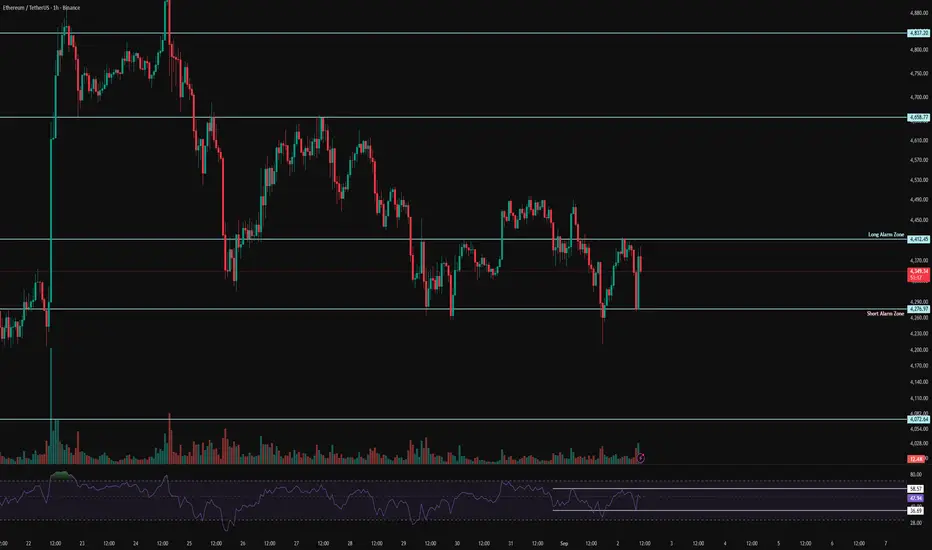
🔭 On the 4-hour timeframe for Ethereum, we can see that ETH is currently moving inside a very strong box and is preparing for this week’s upcoming news. The resistance (ceiling) of this box sits at $4,471, while the support (floor) is around $4,254. Once either of these levels is broken, Ethereum could make a strong move after this long consolidation phase. There’s also an early trigger zone at $4,332; if ETH breaks and stabilizes above this level, we can consider entering a position toward the top of the box.
⛏ Key RSI levels for Ethereum are at 58 and 40. Breaking these ranges could signal the start of a strong move. With increased volatility, ETH could even push toward the overbought (OB) or oversold (OS) zones.
💰 Currently, the size and volume of candles have dropped significantly — something we often see during holiday sessions. But with the start of the new week and upcoming economic reports, Ethereum could generate bigger candles and stronger momentum once it breaks out of this box.
🪙 Looking at the ETHBTC pair on the 4-hour timeframe, the chart still looks bearish with decreasing volume. The current zone is considered a maker-buyer area, and we’ll need to watch how the whales react here. If this level is lost, Ethereum could face a deeper correction and move toward its lower support levels.
💡 Ethereum currently has 3 alarm zones:
A short alarm zone at the bottom of the box — if broken, it could trigger stronger selling pressure.
A long alarm zone #1 at $4,332, acting as an early trigger for a potential breakout toward the top.
A long alarm zone #2 at $4,471 — breaking and holding above this level could lead to a solid upward move.
❤️ Disclaimer : This analysis is purely based on my personal opinion and I only trade if the stated triggers are activated .

BTC 1H Analysis - Key Triggers Ahead | Day 35💀 Hey , how's it going ? Come over here — Satoshi got something for you !
⏰ We’re analyzing BTC on the 1-Hour timeframe .
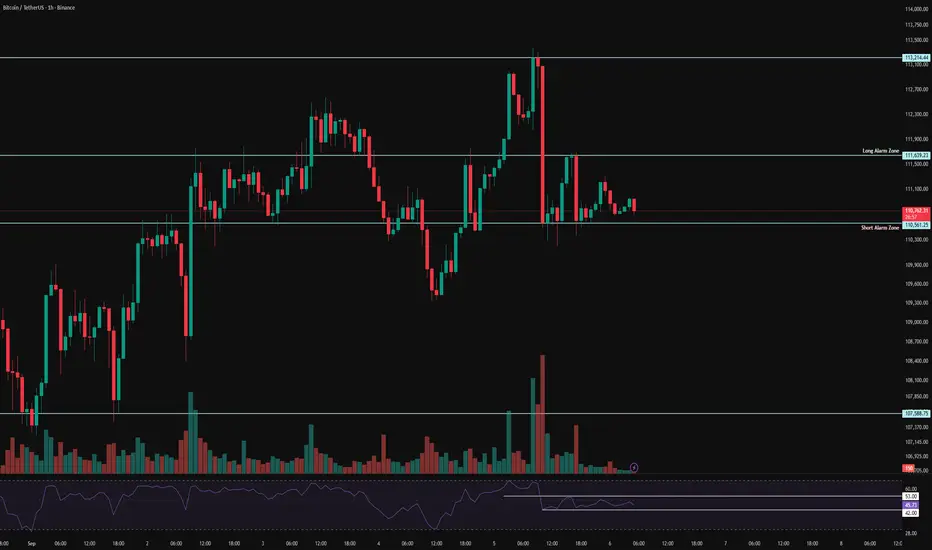
👀 On the 1-hour timeframe for Bitcoin, we can see that after touching its resistance at $111,300, Bitcoin moved toward its short alarm zone and activated it. However, the market didn’t show much selling pressure or bearish momentum. Currently, Bitcoin is ranging with very low volume, but with the new week starting, stronger volume could enter the market.
⚙️ Key RSI levels for Bitcoin are at 70 and 50. If RSI crosses these thresholds, Bitcoin could start a strong move — most likely at the beginning of the new week.
🕯 The size and number of green candles have slightly increased, and we are now sitting right below the critical resistance at $111,300. It’s likely that this level will be broken in the coming week.
🖥 This week has plenty of economic news events, which means the market could see high volatility. Overall, it looks like a good week for trading.
📊 Looking at the 1-hour timeframe of Tether dominance (USDT.D), after a strong rally it recently got rejected from the 4.51% level. The market sentiment shifted toward long positions, and selling pressure didn’t sustain. If 4.45% in Tether dominance breaks down, significant USDT could flow into Bitcoin and altcoins.
🔔 The key alarm zones for Bitcoin are set at $110,500 for short positions and $111,300 for long positions. Breaking these zones in the upcoming week could give us solid trade opportunities. Keep in mind that the economic news scheduled this week can strongly influence the market.
❤️ Disclaimer : This analysis is purely based on my personal opinion and I only trade if the stated triggers are activated .

ETH 1H Analysis - Key Triggers Ahead | Day 14💀 Hey, how's it going ? Come over here — Satoshi got something for you!
⏰ We’re analyzing ETH on the 1-hour timeframe timeframe.
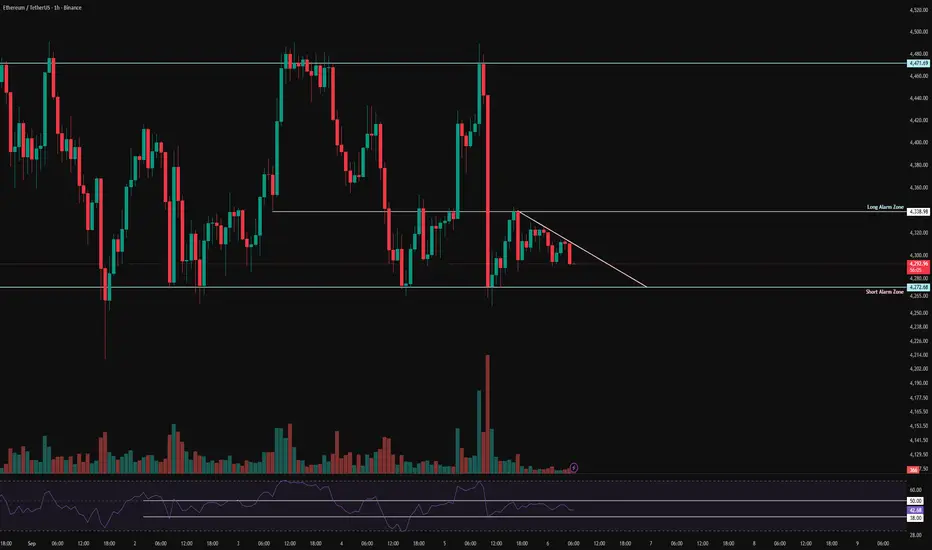
🔭 On the 1H timeframe for Ethereum, we can see that after yesterday’s news, ETH pushed upward toward the top of its range but failed to break out. From that resistance, it faced a heavy rejection, and this drop happened within just two 1H candles! At the moment, ETH is in a consolidation zone, and breaking out of this compression could provide us with an entry.
⛏ The key RSI oscillator levels are at 38 and 50. Once RSI breaks above or below these zones, Ethereum could start its next move following the effects of yesterday’s NFP news.
💰 The size and volume of red candles have increased sharply, showing strong selling pressure. The corrective bounce happened step by step, but then another fairly large red 1H candle was printed. With continued selling pressure, Ethereum may test lower price levels.
🪙 On the 1H timeframe for the ETHBTC pair, we can see it is moving inside a multi-timeframe range. Each time it reaches the bottom of the box, volume increases and the price reacts with zig-zag moves. Note that the bottom of this box is at 0.03864, which has already been tested twice. This area should be considered as a short alert zone for ETHBTC.
💡 The alert zones for Ethereum itself are at 4,272$ and 4,338$. If either of these levels is broken, ETH could start a strong move, especially considering the momentum after yesterday’s NFP News.
❤️ Disclaimer : This analysis is purely based on my personal opinion and I only trade if the stated triggers are activated .
BTC 1H Analysis - Key Triggers Ahead | Day 34💀 Hey, how's it going ? Come over here — Satoshi got something for you!
⏰ We’re analyzing BTC on the 1-hour timeframe timeframe.
👀 On the 1H timeframe for Bitcoin, we can see that after yesterday’s NFP news, Bitcoin moved toward its resistance levels but then faced a very strong rejection. Personally, I expected some big green candles after that news. Right now, Bitcoin is consolidating, and the top and bottom of this range should be considered as breakout zones.
⚙️ The key RSI levels for Bitcoin are around 42 and 53. Once RSI breaks out of this range, Bitcoin can start its new move following the impacts of yesterday.
🕯 The size and volume of the red candles after the news increased sharply, and with one strong selling-pressure candle, the price dropped from the top of the range to the bottom.
💵📊 On the 1H timeframe for USDT.D, we can see that after yesterday’s news it had a very strong reaction from its support area and, with one massive hourly whale candle, pushed up toward its resistance at 4.49%. From there, it got rejected with several red candles and formed a higher low compared to its previous bottom. Keep in mind that if 4.49% is broken, Bitcoin could go into a deeper correction.
🔔 The alert zones for Bitcoin are the top and bottom of this range, which can give us entry signals. Our long alert zone is at 11,600$, and if this level breaks, Bitcoin could move higher. On the other hand, 11,056$ is our short alert zone, and with a breakdown of this level and selling pressure, Bitcoin could push toward lower levels.
❤️ Disclaimer : This analysis is purely based on my personal opinion and I only trade if the stated triggers are activated .
ETH 1H Analysis - Key Triggers Ahead | Day 13💀 Hey , how's it going ? Come over here — Satoshi got something for you !
⏰ We’re analyzing ETH on the 1-hour timeframe timeframe .
🔭 On the 1H timeframe of Ethereum, we can see that ETH has had a solid upward move and is now facing resistance at $4416. If this level breaks, price could move toward the next resistance at $4481. A early trigger for a long position is right at the current level, which I’ve already used to open a trade. I’ve also set a low-risk order around $4481, which is the top of ETH’s box structure on the multi-timeframe view.
⛏ The key RSI zones for ETH are around 50 and 70. Breaking out of these levels could trigger a strong leg. With news coming, volatility is expected to increase sharply. ETH is currently trading below 70 but above 50, which suggests long setups have more momentum.
📊 The size and volume of ETH’s green candles are increasing, showing clear buying strength. If today’s NFP news comes out positive, ETH could make a very strong upward leg.
💸 On the 1H ETHBTC chart, the pair is inside a descending channel, and within this channel, it has formed a tight box-like consolidation. The box top is at 0.03999, while the bottom sits at 0.0387. With higher volume and volatility, ETHBTC could break out, leading to either a pump or a dump in Ethereum.
💡 The alarm zones for Ethereum are set at $4416 and $4481. Breaking and holding above these levels can provide strong trading opportunities. Personally, I’ve already opened a position on the $4416 breakout, and I plan to add more size if the $4481 zone is taken out. The NFP release could bring momentum similar to last time, with sharp and powerful moves.
❤️ Disclaimer : This analysis is purely based on my personal opinion and I only trade if the stated triggers are activated .

BTC 1H Analysis - Key Triggers Ahead | Day 33💀 Hey , how's it going ? Come over here — Satoshi got something for you !
⏰ We’re analyzing BTC on the 1-hour timeframe timeframe .
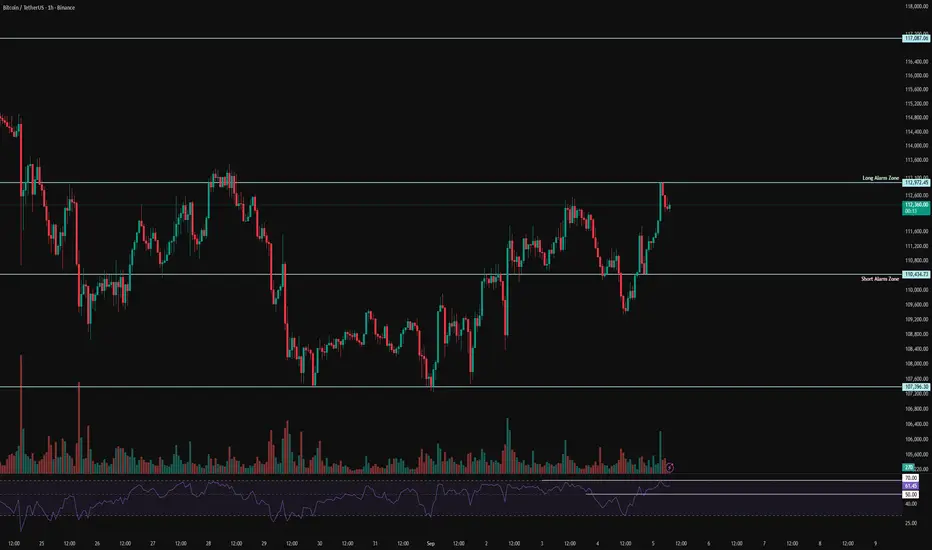
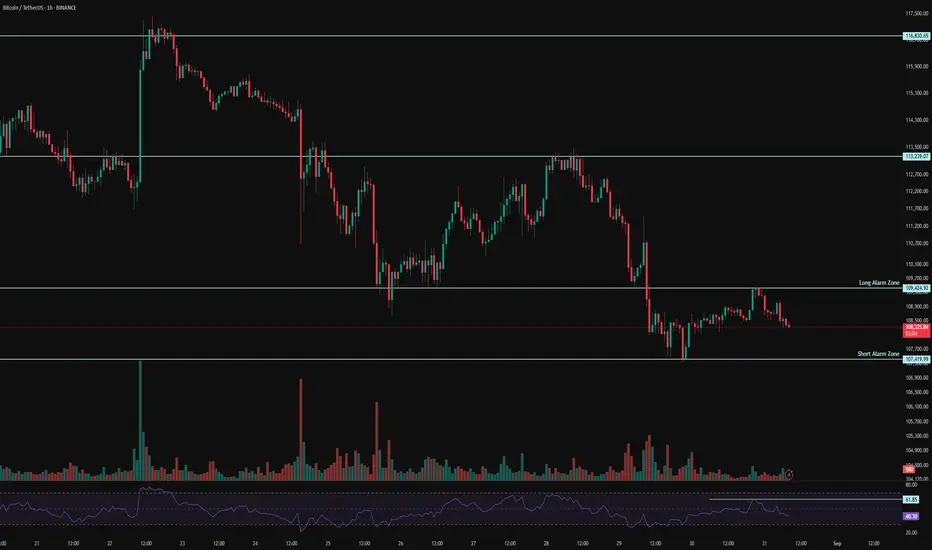
👀 On the 1H timeframe of Bitcoin, we can see that BTC moved upward after breaking through its taker-seller zone, with the breakout fueled by high volume and a whale candle. A strong resistance has now formed at $113,000, while a solid support floor is holding at $110,400. With today’s news, one of these levels is very likely to break. Keep in mind, today’s news is extremely important—if it turns out positive for crypto, the market could push higher and start a strong bullish leg.
⚙️ The RSI key zones are at 50 and 70. If volatility increases and momentum crosses above these levels, Bitcoin could kick off a strong move.
🕯 The size and volume of green candles have increased, building a very solid support around $110,400. Price is currently sitting in a resistance area, and with the NFP release we could see strong candles forming with high volume.
📊 On the 1H timeframe of Tether dominance (USDT.D), we see that after its recent bullish leg, it formed a trendline which has now been broken, followed by a pullback. Currently, USDT dominance is sitting at a very important support floor. If this floor breaks, a significant amount of Tether could flow into Bitcoin and altcoins.
🔔 The alarm zones for Bitcoin are set at $113,000 and $110,400—these are the levels to watch and place alerts on. Since we have the NFP news release today, a potential whale move is likely. If you’re planning to trade the news, define a small risk, use trigger orders, and make sure to apply strict risk management!
❤️ Disclaimer : This analysis is purely based on my personal opinion and I only trade if the stated triggers are activated .
ETH 1H Analysis - Key Triggers Ahead | Day 12💀 Hey , how's it going ? Come over here — Satoshi got something for you !
⏰ We’re analyzing ETH on the 1-hour timeframe timeframe .
🔭 On the 1H timeframe of Ethereum, we can see that ETH is moving inside a very tight consolidation box along with heavy profit-taking. It has been strongly supported around the $4277 level. As a result, both the top and bottom of this 1H range appear very solid. Ethereum is currently in an accumulation phase, and it could break out of this box with tomorrow’s news. The key levels to watch are exactly the top and bottom of this range.
⛏ On the RSI, the critical zones are around 40 and 70 (Overbought). If price momentum pushes beyond these zones, Ethereum could experience a strong move. Tomorrow’s news is likely to have a significant impact on ETH volatility.
💰 The size, volume, and number of green candles are greater compared to the red ones. This structure indicates a price compression pattern. A taker-seller zone exists around $4480, where more sell orders keep activating. On the other hand, there’s a maker-buyer zone at the bottom of the box that supports ETH whenever price reaches it.
📊 On the 4H timeframe of ETHBTC, the pair is moving inside a descending channel. Each time price touches the channel’s bottom, it finds support. Currently, ETHBTC has formed a V-pattern, and if it breaks the neckline, more Bitcoin could be converted into Ethereum. However, for this breakout to happen, the RSI across the 1H–4H multi-timeframes needs to move into the Overbought zone.
💡 The alarm zones for Ethereum are set at $4272 and $4480. Breaking either of these levels could trigger a strong move. For a long setup, breaking above $4480 requires high volume and strong buying pressure to absorb the sell orders placed there. Tomorrow’s news is extremely important—most of the market is waiting for it. There’s a lot of talk about a potential interest rate cut, which will directly affect Ethereum’s trend. From a technical perspective, strong patterns have already formed, and their breakout will likely align with the NFP news release tomorrow.
❤️ Disclaimer : This analysis is purely based on my personal opinion and I only trade if the stated triggers are activated .

BTC Analysis 1H - Key Triggers Ahead | Day 32💀 Hey , how's it going ? Come over here — Satoshi got something for you !
⏰ We’re analyzing BTC on the 1-hour timeframe timeframe .
👀 On the 1H timeframe of Bitcoin, we can see that after yesterday’s news BTC moved upward but got rejected at the $112,300 zone. It then found support at the bottom of its ascending channel. Bitcoin is now waiting for tomorrow’s NFP release. The key level that price reacted to is $112,300 — a breakout above this zone could trigger another move to the upside. The current support is around $110,340, and if this level breaks, the next major support lies near $107,500.
⚙️ RSI key zones are at 36 and 70. If momentum breaks through these areas, Bitcoin could start a stronger move.
🕯 The size and volume of the recent red candles indicate selling pressure. However, when price bounced from the channel bottom, the bearish momentum weakened. If selling pressure increases and the support is lost, red candles may grow even larger.
📊 Looking at the 1H Tether dominance (USDT.D), after the recent drop it shows signs of a rebound and is completing its pullback on this timeframe. The key zones to watch are 4.39% and 4.47%. A breakout above these levels could bring significant trading volume into Bitcoin.
🔔 Alert zones for Bitcoin are set at $110,340 and $112,334. A breakout of either zone could provide us with trade opportunities. Keep in mind that the current structure is ranging and compressed, so it’s better to trade with lower risk.
❤️ Disclaimer : This analysis is purely based on my personal opinion and I only trade if the stated triggers are activated .

ETH 1H Analysis - Key Triggers Ahead | Day 11💀 Hey , how's it going ? Come over here — Satoshi got something for you !
⏰ We’re analyzing ETH on the 1-hour timeframe timeframe .
🔭 On the 1-hour timeframe of Ethereum, we can see that ETH has a similar situation to yesterday. It has an important resistance at $4382, and with a breakout and confirmation above this level, Ethereum could experience a good bullish leg. Keep in mind, according to the data we posted in the channel, yesterday people in the U.S. sold their ETH and bought Bitcoin.
⛏ Two key RSI zones for Ethereum are considered: 58 and 37. Once the oscillation limit crosses these numbers, ETH can start its move.
💰 The volume and the size of green candles in Ethereum have slightly increased, and with more volume and the filling of sell orders at the $4382 resistance, Ethereum could move upward.
🪙💸 On the 1-hour timeframe of the ETHBTC trading pair, we can see that this pair had a resistance at 0.03909, which was successfully broken with higher volume. With a completed pullback and breakout above 0.03939, Ethereum could move upward. Note that this level is directly related to the maker buyers of this pair, and in this timeframe, it’s almost at its bottom.
🔔 Two alarm zones are considered for Ethereum: the $4382 level as our long trade alarm zone, where with a breakout and confirmation above it ETH could move higher; and the $4273 level as the short trade alarm zone, where a breakdown could give us a short position.
❤️ Disclaimer : This analysis is purely based on my personal opinion and I only trade if the stated triggers are activated .
BTC 1H Analysis - Key Triggers Ahead | Day 31💀 Hey , how's it going ? Come over here — Satoshi got something for you !
⏰ We’re analyzing BTC on the 1-hour timeframe timeframe .
👀 On the 1-hour timeframe of Bitcoin, we can see that after activating the alarm zones we had mentioned in previous analyses, Bitcoin moved upward and is now in a range and compression in its multi-timeframe structure, which with the New York session open could break out of this compression.
⚙️ The key RSI zones are 64 and 50. Once the oscillation limit crosses these zones, Bitcoin could break out of this compression. Preferably, follow long trades when the oscillation limit is crossed.
🕯 The size of green candles on the 1-hour timeframe is almost getting bigger with increasing volume. We are in a relatively important zone where, with the increase of candle size and volume, Bitcoin could move upward.
📊 On the 1-hour timeframe of USDT.D , we can see that after losing the 4.44% zone and the buyers’ money running out, it has faced a temporary trend weakness. With the New York session open, it could continue its decline. Notice that Tether dominance is also in a compression state both in terms of volatility and the RSI oscillator, in a decision-making mode. Confirmation of breaking the 4.44% zone could mean the loss of the 38 support level.
🔔 The trading alarm zones for Bitcoin are at $111,664 for long and $110,666 for short. Preferably, I’m not considering short trades these days, but I do think about opening a long position on a pullback or breakout of $111,664, and if the price action behavior suits such a trade, I will take action.
❤️ Disclaimer : This analysis is purely based on my personal opinion and I only trade if the stated triggers are activated .

ETH 1H Analysis - Key Triggers Ahead | Day 10💀 Hey , how's it going ? Come over here — Satoshi got something for you !
⏰ We’re analyzing ETH on the 1-hour timeframe timeframe .
🔭 On the 1-hour timeframe for Ethereum, we can see that in the last few candles ETH faced a drop with some selling pressure, reaching the support zone at $4276, and then bouncing back. Now we need to see whether Ethereum manages to break the $4400 resistance or not. If it does, this level could give us a strong long position opportunity.
⛏ Two key RSI zones are being watched: 58 and 37. Once the RSI swings beyond these levels, ETH could start a solid move.
💰 Volume and green candles could continue to increase, and even while I’m writing this, a strong whale green candle with very good volume just closed for Ethereum.
🪙 On the 1-hour timeframe of ETHBTC, if the drawn support zone is lost, ETH might struggle to move upward, since Bitcoin dominance is closing green candles and this adds selling pressure on Ethereum. However, a long alarm zone has been set — and if ETH breaks above this zone, it could pump massively.
🔔 Two alarm zones are considered for Ethereum: $4400 and $4276. Personally, I’m not really thinking about short positions today, and if ETH gives a good setup, I’d rather look for a long entry.
❤️ Disclaimer : This analysis is purely based on my personal opinion and I only trade if the stated triggers are activated .
BTC 1H Analysis - Key Triggers Ahead | Day 30💀 Hey , how's it going ? Come over here — Satoshi got something for you !
⏰ We’re analyzing BTC on the 1-hour timeframe timeframe .
👀 On the 1-hour timeframe of Bitcoin, we can see that after activating our alarm zone, Bitcoin moved toward the top of the channel and then got rejected from this area. There is a resistance in the 1-hour timeframe at the price of $110,450, and by breaking this level Bitcoin can move upward.
⚙️ We have 2 key RSI zones at 38 and 64, and if the fluctuation limit passes these numbers, Bitcoin can experience either a corrective move or the continuation of the bullish leg.
🕯 The size of the green candles has grown and their volume has increased. This happened with the end of August and the beginning of September. With increased buying volume and positive news results in favor of crypto, Bitcoin can make another move upward. News has a very direct impact on our inflows and outflows.
📊 On the 1-hour timeframe of USDT.D , we can see that it is moving inside a box with a top at 4.56% and a bottom at 4.47%. By breaking out from either side of the box, it can bring strong trading volume. Notice that Tether dominance is currently pulling back to the midline of the box. By breaking the midline and stabilizing above this area, Bitcoin may face more selling pressure. By getting rejected from this area and losing the bottom, our long position trigger for Bitcoin can be activated.
🔔 The alarm zones specified for Bitcoin are at $110,450 and $107,800. By observing behavior in these areas we can trade. Personally, with the breakout of $110,450 along with a 15-minute indecision candle, I will try to take a position. Note that Bitcoin can make a pullback to its midline box and then bounce upward. If the midline is lost, this scenario will be invalid.
❤️ Disclaimer : This analysis is purely based on my personal opinion and I only trade if the stated triggers are activated .

AAVE 4H Analysis | Key Triggers Ahead💀 Hey , how's it going ? Come over here — Satoshi got something for you !
⏰ We’re analyzing AAVE on the 4-Hour timeframe timeframe .
👀 On the 4-hour timeframe of AAVE, we can see that after breaking the trendline, its volume increased and it moved toward the $361 resistance, then entered a corrective trend. Currently, this coin is ranging inside a triangle consolidation, and the volume has dropped significantly.
⚙️ The RSI fluctuation of this coin is still below the 50 zone, and two key levels have been considered for its movement: 55.15 and 37.89. If the RSI passes beyond these levels, this coin can experience another movement leg.
🕯 The size and volume of the candles have decreased, with the red candles being bigger and more numerous than the green ones. This could be a sign of the end of selling pressure or the beginning of a new wave of selling pressure. The coin is in a very important area, and with today’s news it may move upward and end this corrective trend.
💰 On the 4-hour timeframe of the trading pair AAVEBTC, after a strong rally against Bitcoin, this coin is now in a triangle consolidation and the volume has dropped. A significant amount of this coin has been sold and converted to Bitcoin (buyer makers of Bitcoin). A ceiling and floor have also been formed as our alarm zones, where price action in these areas can help us make the best decision for this trading pair.
🔔 The alarm zone for this coin is considered at $323 for a long trade and $301 for a short trade. Today, this coin recorded a historic milestone in DeFi, and with the breakout and confirmation of the marked trendline and the activation of triggers, it can experience good growth. 🚀
❤️ Disclaimer : This analysis is purely based on my personal opinion and I only trade if the stated triggers are activated .

MANA 1D Analysis | Key Triggers Ahead💀 Hey , how's it going ? Come over here — Satoshi got something for you !
⏰ We’re analyzing MKR on the 1-Day timeframe timeframe .
👀 On the daily timeframe of MANA, we can see that the coin is inside a compression with a triangle pattern. With the daily candle open, it is moving upward, and the reason for this is the clearing of sellers’ orders. MANA currently has a very important resistance at the $0.2995 area, which is considered a major resistance in the multi-timeframe view.
⚙️ Looking at MANA’s volatility, on the daily timeframe it is positioned above the 50 level and has a key resistance at the 54.25 area. If the oscillator crosses this level, MANA can build a higher low compared to its previous lows.
🕯 The number and size of red candles inside this triangle are much greater than the green ones, and to break out of this pattern and compression, we need more green candles in the multi-timeframe, especially on the 4-hour chart. If you zoom in on the chart, the 4-hour candles and patterns will display more clearly.
💰 On the daily timeframe of MANABTC, we can see that in the past 3 days, its trading volume and volatility have increased. A Fibonacci has been drawn from the breakout area to the corrective bottom, and with a breakout of the 0.38 Fib level, it can once again move upward.
🔔 The alert zones we have considered are the $0.274 area and the $0.3015 area. Based on price action in these zones, we can make the best trading decisions. Note that MANA has an important chart compared to Bitcoin, so be sure to check that chart as well.
❤️ Disclaimer : This analysis is purely based on my personal opinion and I only trade if the stated triggers are activated .

MKR 1D Analysis | Key Triggers Ahead💀 Hey , how's it going ? Come over here — Satoshi got something for you !
⏰ We’re analyzing MKR on the 1-Day timeframe timeframe .
👀 On the daily timeframe of MKR, we can see that after breaking its ascending trendline, the coin was rejected from the top of its box, and the trendline was also broken. Then it moved downward and was supported by buyer makers at the $1480 area, forming a V-pattern. With a breakout of this level, the coin can give us confirmation for the end of its correction.
⚙️ Looking at this coin’s volatility on the daily timeframe, if the oscillator crosses the 50 RSI level, the coin can start a new trend and move upward. Note that in the multi-timeframe from 1 to 4 hours, the coin is currently in its OverBuy zone.
🕯 The size and number of red candles are much greater than the green ones, but if in this leg the coin manages to create a trend reversal, it can close some strong green candles. Keep in mind that most of the large-sized, high-volume candles were recorded after major news releases.
💰 On the daily timeframe of MKRBTC, we can see that it is in a long-term 185-day range box. A breakout from this box could bring a very strong move. For breaking out of this box, we can take futures positions earlier. Breaking the 0.01562 level can serve as confirmation of a trend reversal for this coin against Bitcoin.
🔔 The alert zone we’ve identified is at the $1677 level. With a breakout and consolidation above this zone, the coin can move upward. Be sure to follow today’s U.S. session news, as an important economic announcement will be released that could impact the market.
❤️ Disclaimer : This analysis is purely based on my personal opinion and I only trade if the stated triggers are activated .

ETH 1H Analysis – Key Triggers Ahead | Day 9💀 Hey , how's it going ? Come over here — Satoshi got something for you !
⏰ We’re analyzing ETH on the 1-hour timeframe timeframe .
🔭 On the 1-hour timeframe of Ethereum, we can see that after being rejected from the \$4500 alert zone, Ethereum moved downward and formed short-term support at the \$4371 area. If this level is broken, Ethereum could experience a deeper correction in the multi-timeframe view.
⛏ The key RSI levels are at 58 and 39. Once the oscillator crosses these levels, Ethereum can start its move.
💰 The size and number of Ethereum’s red candles are significantly greater than the green ones, and if this support is lost, Ethereum could move further downward into selling pressure.
🪙 On the 1-hour ETHBTC timeframe, we can see that after activating the short alert zone and receiving confirmation for a sell trade, Ethereum is moving downward. It has support at the 0.03996 level, which coincides with the 30 RSI zone or the OverSell boundary.
🔔 The alert zones considered for Ethereum are the \$4371 area and the \$4500 area. Based on price action in these zones, we can find the best trade opportunities. With further decline of ETH against Bitcoin, reduced volatility, and price leaning toward selling, we may see a deeper correction.
❤️ Disclaimer : This analysis is purely based on my personal opinion and I only trade if the stated triggers are activated .

BTC 4H Analysis – Key Triggers Ahead | Day 29💀 Hey , how's it going ? Come over here — Satoshi got something for you !
⏰ We’re analyzing BTC on the 4-hour timeframe timeframe .
👀 On the 4-hour timeframe of Bitcoin, we can see that Bitcoin is inside a descending continuation channel. With the open of the new weekly candle, it reacted to the midline of this channel and had a pullback, faking the \$109,424 level and moving downward. The price of Bitcoin is now near its resistance at \$109,400.
⚙️ Two key RSI levels are considered for Bitcoin’s volatility: 50 and 33.20. Once the oscillator crosses these levels, Bitcoin can start a new move.
🕯 The size and volume of Bitcoin’s red candles are considerably larger than the green ones, and we still don’t have confirmation that the correction has ended. With increased buying volume and a trend change, Bitcoin can print strong green candles upward.
📊 On the 4-hour timeframe of Tether dominance, we can see that Tether dominance is ranging within an ascending channel. Breaking out of this channel could bring a strong move to the market. These levels won’t unlock easily for us to step into a bull run. Complementary news is needed for whales to sell their Tether and start buying Bitcoin and strong altcoins. The results of the coming month’s news could set the trend in whichever direction it may be.
🔔 The alert zones we have considered for Bitcoin are the \$107,400 level and the \$109,400 level. With increased volume and volatility, Bitcoin can touch one of these two price levels, and if confirmation of a breakout is given, it can start its trend. There are different scenarios in this regard, but the outcome of U.S. economic news can play a key role in confirming trades.
❤️ Disclaimer : This analysis is purely based on my personal opinion and I only trade if the stated triggers are activated .

NOT 1D Analysis – Key Triggers Ahead💀 Hey , how's it going ? Come over here — Satoshi got something for you !
⏰ We’re analyzing NOTCOIN on the 1-DAY timeframe timeframe .
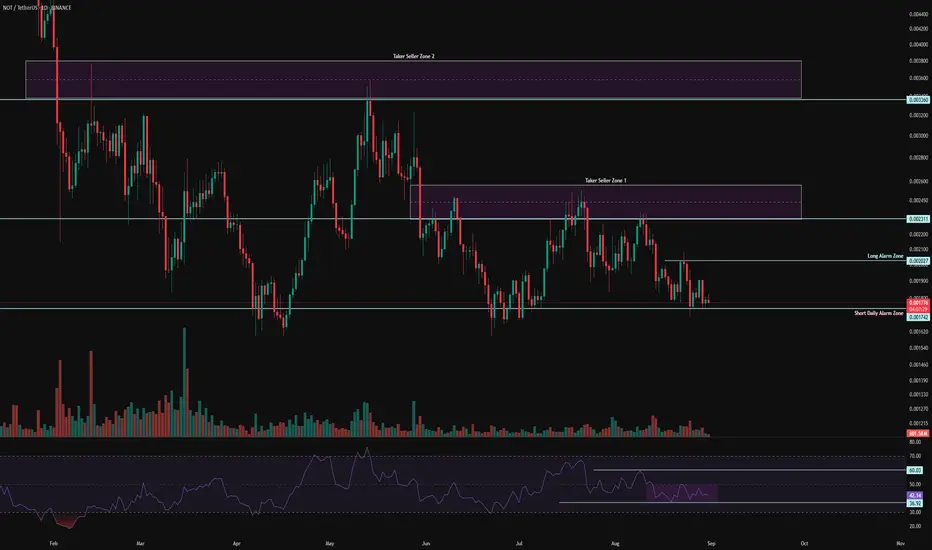
👀 On the daily timeframe of Notcoin, we can see that Notcoin is one of Telegram’s well-known airdrops, and many Telegram users got familiar with Notcoin through it. On the daily chart, after its recent drop, the volume has decreased sharply, and we can consider the possibility of reduced selling pressure at this bottom since the price has taken on a compressed and accumulation phase. Regarding the zones, a quick note: because Notcoin was distributed as an airdrop, many of its users are considered as seller tickers.
⚙️ The key RSI zones for Notcoin are at 60 and 36. If the oscillator crosses these levels, Notcoin can experience a solid move. A box-like compression has formed inside the RSI, and breaking out of this compression could bring about a parabolic swing.
🕯 The volume of Notcoin, along with its reduced volatility, has decreased sharply and reached an accumulation stage. Once this accumulation phase ends, Notcoin can experience a good move. Note that the size and volume of red candles are increasing, so price action behavior can provide the best decision-making opportunity for taking trades.
🔔 The alert zone considered is the 0.002 area, which is set as the long trade alert zone. (A short clarification: price behavior in this zone doesn’t necessarily only mean a long position—it could also be a reversal. We trade based on probabilities.)
❤️ Disclaimer : This analysis is purely based on my personal opinion and I only trade if the stated triggers are activated .
ETH 1H Analysis – Key Triggers Ahead | Day 8💀 Hey , how's it going ? Come over here — Satoshi got something for you !
⏰ We’re analyzing ETH on the 4-hour timeframe timeframe .
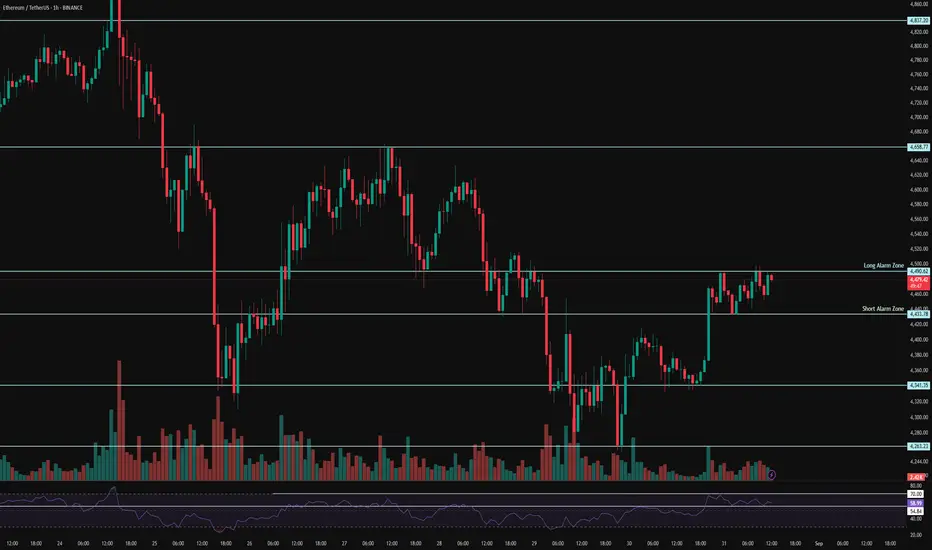
🔭 On the 1-hour timeframe of Ethereum, we can see that after a correction, Ethereum was supported at the $4263 area and moved upward. It had a resistance at the $4341 level which, after breaking and completing a pullback, pushed towards its next higher resistance. Currently, it is in a 1-hour or 15-minute multi-timeframe range, and with a breakout from this pattern, it can give us a trade opportunity.
⛏ Key RSI levels are at 70 and 55. If the fluctuation limit crosses these numbers, Ethereum can have significant volatility and start a new trend.
💰 The volume and number of green candles have increased, and their size also looks bigger. This can be a sign of Ethereum’s bias, showing that buyers are more willing to spend money compared to sellers. The volume and number of red candles have decreased, and they don’t create much selling pressure, although the market is currently in a holiday period.
🪙🪙 On the 1-hour ETHBTC timeframe, after breaking out of its box, Ethereum moved upward and also had a pullback to this box. Now there is resistance at the 0.04145 area, and with a breakout of this level, Ethereum can continue moving upward.
🔔 The alert zones considered for Ethereum are $4433, which is at the bottom of this range as the short alert zone, and $4490, which is at the top of this range as the long alert zone. With a breakout and confirmation above these levels, Ethereum can start its move in the new week. Note that this pattern has strong price action significance, and Ethereum’s monthly candle will also close tonight.
❤️ Disclaimer : This analysis is purely based on my personal opinion and I only trade if the stated triggers are activated .
BTC 1H Analysis – Key Triggers Ahead | Day 28💀 Hey , how's it going ? Come over here — Satoshi got something for you !
⏰ We’re analyzing BTC on the 1-hour timeframe timeframe .
👀 With the breakout of this one-hour box, Bitcoin can give us either a long or short position. Keep in mind that the market is currently in the holidays and volume is decreasing. The start of the new week can be interesting for Bitcoin.
⚙️ A key RSI zone exists at 62, and with the swing limit breaking this number, Bitcoin can move upward again. The next key RSI zone is 30, which is the oversold boundary for Bitcoin.
🕯 Bitcoin’s volume has sharply decreased as we are in the holidays. The size and volume of red candles are increasing each time, but still micro buyers are present, leaving good reversal candles from supports. With increasing volume, Bitcoin can start a good trend in the new week.
📊 1H timeframe USDTDominance We observe that this dominance, upon hitting its ceiling at 4.56%, was rejected and moved down toward its support at 4.46%. Then it bounced from this area and hit the key resistance at 4.49%. With the breakout of this one-hour dominance box in either direction, good volume can flow into Bitcoin.
🔔 The alarm zone for Bitcoin is the ceiling and floor of this one-hour box, which has high price action value.
❤️ Disclaimer : This analysis is purely based on my personal opinion and I only trade if the stated triggers are activated .
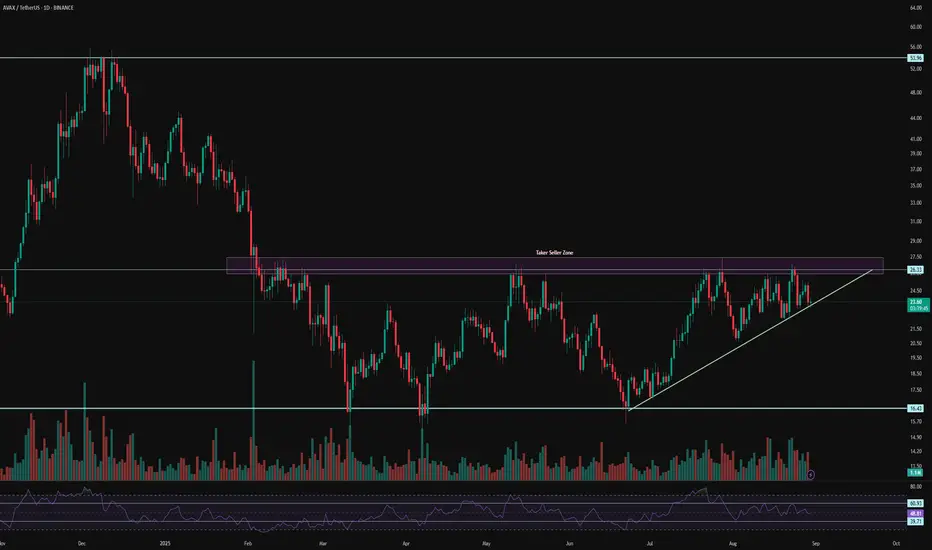
AVAX 1D Analysis – Key Triggers Ahead💀 Hey , how's it going ? Come over here — Satoshi got something for you !
⏰ We’re analyzing AVAX on the 1-Day timeframe timeframe.
👀 In the daily timeframe of AVAX, after the drop it experienced, AVAX entered a box with a long-term range. The ceiling and floor of this box are in the area of $16 and $26. The time range of this box or its length is almost 170 days. At the ceiling of this box, there are strong seller tickers that get their sell orders activated every time the price reaches this area. To break this zone and for a good rise of AVAX, we need a very strong and high-volume momentum that causes a price jump and fills the sell orders.
💰 In the daily timeframe of AVAXBTC we can see a relatively good compression formed in this area, and with the breakout of the Bitcoin ceiling, more Bitcoin will be converted into AVAX and it can be a good confirmation for a long position and some spot buying. The area considered for the alarm zone is 0.0002286.
⚙️ Two key areas for RSI have been considered. Passing the swing limits of 61 and 40 can bring good volatility to AVAX and help it break out of this RSI compression that is seen as a box.
🕯 The area considered as the seller ticker is a strong one, and every time the price reached this area, we faced selling pressure. The size of the green candles is also larger compared to the red candles, and each time the compression area became smaller and the price is ready for a breakout and reaction (not today but next week).
🔔 The area we considered as the alarm zone for AVAX is $26, and with the breakout of this area, AVAX can move towards higher price levels. Price behavior at $26 can give us complete awareness for trading.
❤️ Disclaimer : This analysis is purely based on my personal opinion and I only trade if the stated triggers are activated .
ETH 4H Analysis – Key Triggers Ahead | Day 7💀 Hey , how's it going ? Come over here — Satoshi got something for you !
⏰ We’re analyzing ETH on the 4-hour timeframe timeframe .
🔭 In the 4-hour timeframe of Ethereum, we can see that after registering its all-time high, Ethereum was rejected downwards and then took support from the $4,273 area and moved upwards. We need to see how valid this support can remain in the new week. There is also an important resistance at the $4,515 area, and breaking this level could end Ethereum’s corrective trend.
⛏ The key RSI areas are 35 and 58. If the fluctuation passes these levels, Ethereum could enter a new phase of volatility and eventually start its movement.
💰 The size and number of red candles have almost decreased, and with increasing volume and larger candle sizes, Ethereum can start a good trend. Keep in mind that today is a holiday, so not much volume enters the market. On the other hand, there are rumors on Twitter about the death of Donald Trump, which could also prevent an increase in volume.
🪙 In the 4-hour timeframe of the ETHBTC index , we can see that this index broke its box at the 0.03946 area and registered an all-time high for Ethereum against Tether pair. Then it was rejected from this area and showed two rebound reactions at the 0.03946 support, which is the broken box top. With a breakout of the highlighted areas in this index analysis, both Bitcoin and Ethereum could see more liquidity, and this directly affects the ETH/USDT pair.
🔔 The alarm zones that can be considered for Ethereum in this timeframe are the $4,273 and $4,514 areas. The price action in these areas can be of high value, and with increasing volume, they could give us either a short or long trade opportunity.
❤️ Disclaimer : This analysis is purely based on my personal opinion and I only trade if the stated triggers are activated .
