ETH 1H Analysis – Key Triggers Ahead | Day 6💀 Hey , how's it going ? Come over here — Satoshi got something for you !
⏰ We’re analyzing ETH on the 1-hour timeframe timeframe .
🔭 On the 1H timeframe for Ethereum, we can observe that ETH broke its midline to the downside and moved toward the bottom of the box. With the slightly higher-than-expected U.S. inflation news, Ethereum bounced again from the bottom of its box, and now we need to see whether it can consolidate above the midline or not.
⛏ The key RSI levels are at 50 and 30, and once the oscillation surpasses these thresholds, Ethereum can begin its main move.
💰 The volume and number of red candles increased after the midline break, accompanied by selling pressure. The volume and size of Ethereum’s reversal candles can show us the strength of the rebound and the strength of the box bottom, since the bottom has not been lost yet.
📊 On the 1H ETHBTC chart, we can observe that if the bottom of the 1H box at 0.03972 is lost, more Ethereum will be sold and converted into Bitcoin. This index reflects the relative value between ETH and BTC. Breaking this marked level could serve as a confirmation for a short trade on Ethereum.
💡 The Ethereum alert zones remain the same as before, with the difference that for an early trigger we can consider a break and consolidation above the midline, which is relatively risky.
❤️ Disclaimer : This analysis is purely based on my personal opinion and I only trade if the stated triggers are activated .
Satoshiframe

BTC 1H Analysis – Key Triggers Ahead | Day 26💀 Hey , how's it going ? Come over here — Satoshi got something for you !
⏰ We’re analyzing BTC on the 1-hour timeframe timeframe .
👀 On the 1H timeframe for Bitcoin, we can observe that BTC was rejected from the alert zone we had previously marked and moved downward. With this rejection, the selling volume and the size of red candles increased slightly. Currently, Bitcoin is sitting at its alert zone, and we need to see whether it will find support here or lose this support and go into a deeper correction.
⚙️ The key RSI levels are 30 and 70. Once the oscillation surpasses these levels, Bitcoin can start its main move and give us a position.
🕯 The size and volume of red candles have increased considerably, and selling pressure is being applied more easily each time. The green reversal candles are smaller compared to the red ones, and sellers’ tickers are consistently pushing the price downward with less resistance.
💵📊 On the 1H Tether Dominance chart ,we can see that Tether Dominance has reacted four times to this resistance zone, and right now we are at the top of Tether Dominance and the bottom of Bitcoin. If Tether Dominance gets rejected from this area, Bitcoin could find support and move upward. However, if this zone is broken with strong whale candles, heavy selling pressure could flow into Bitcoin. Keep in mind that this is a major resistance zone for Tether Dominance and will not be broken easily.
🪙📊 On the 1H Bitcoin Dominance chart ,we observe that at the same time Bitcoin prints green reversal candles and Tether Dominance shows red rejection candles, Bitcoin Dominance itself is forming a green structure. This means Bitcoin’s weight in the market is increasing. Now we need to see whether the market maker supports Bitcoin or not.
🔔 The Bitcoin alert zones are still the same as yesterday. If price reacts with a breakout confirmation, trading setups could form. Keep in mind that it’s the weekend, so avoid taking unusual or overly risky trades.
❤️ Disclaimer : This analysis is purely based on my personal opinion and I only trade if the stated triggers are activated .
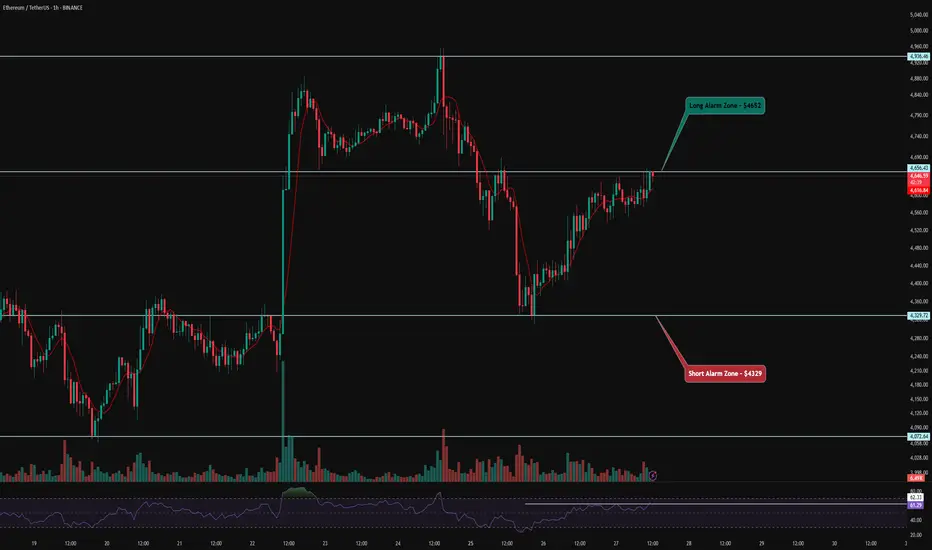
ETH 1H Analysis – Key Triggers Ahead | Day 5💀 Hey , how's it going ? Come over here — Satoshi got something for you !
⏰ We’re analyzing ETH on the 1-hour timeframe timeframe .
🔭 On the 1H timeframe for Ethereum, we can observe that ETH is moving inside a 1-hour range box, which has also formed with a V-pattern structure. A breakout and consolidation above or below this box can provide us with either a long or short trade setup.
⛏ The key RSI level is around 62, where Ethereum has been ranging for almost 2 days below this level with support around the 50 zone. Once the oscillation surpasses these levels, Ethereum can start its next move.
💰 The volume and number of green and red candles are almost equal. However, with larger green candles and rising volume, we can say that Ethereum is holding a good amount of accumulation volume.
📊 On the 1H timeframe of ETHBTC , we can observe that the alert zone for confirming a long position in Ethereum has slightly shifted lower, now sitting around 0.0415. Breaking this zone could allow Ethereum to move toward higher resistance levels and potentially even register a new all-time high.
💡 Looking at Ethereum’s alert zones, the level for a long position is around $4556, while the level for a short position is around $4329. With a breakout and consolidation above or below these areas, Ethereum gives us trade opportunities. Monitoring price behavior in these zones can be of great help in decision-making.
❤️ Disclaimer : This analysis is purely based on my personal opinion and I only trade if the stated triggers are activated .
BTC 1H Analysis – Key Triggers Ahead | Day 25💀 Hey , how's it going ? Come over here — Satoshi got something for you !
⏰ We’re analyzing BTC on the 1-hour timeframe timeframe .
👀 On the 1H timeframe for Bitcoin, we can observe that BTC is ranging inside a box with a top around $113,000 and a bottom around $109,100. With a breakout from either side of the box, Bitcoin can experience a sharp and parabolic move.
⚙️ The key RSI zones are 70 and 45, and once the oscillation surpasses these levels, Bitcoin can experience a solid move with an increase in trading activity.
🕯 The size and volume of green candles are increasing, the underlying trend of the market is bullish, and we are at an important zone. With rising buying volume and larger green candles, Bitcoin could break out of the top of the box and move upward toward resistance levels.
📊 On the 1H timeframe for USDT.Dominance we can observe that Tether Dominance is slowly losing weight in the market after dropping below the 4.35% zone.
At the same time, Bitcoin.Dominance is also declining . This means that altcoins are providing more profit than Bitcoin .
🔔 The zones we have selected as alert zones are $113,200 and $109,000. By monitoring price behavior and recognizing breakouts, we can open our positions accordingly .
❤️ Disclaimer : This analysis is purely based on my personal opinion and I only trade if the stated triggers are activated .

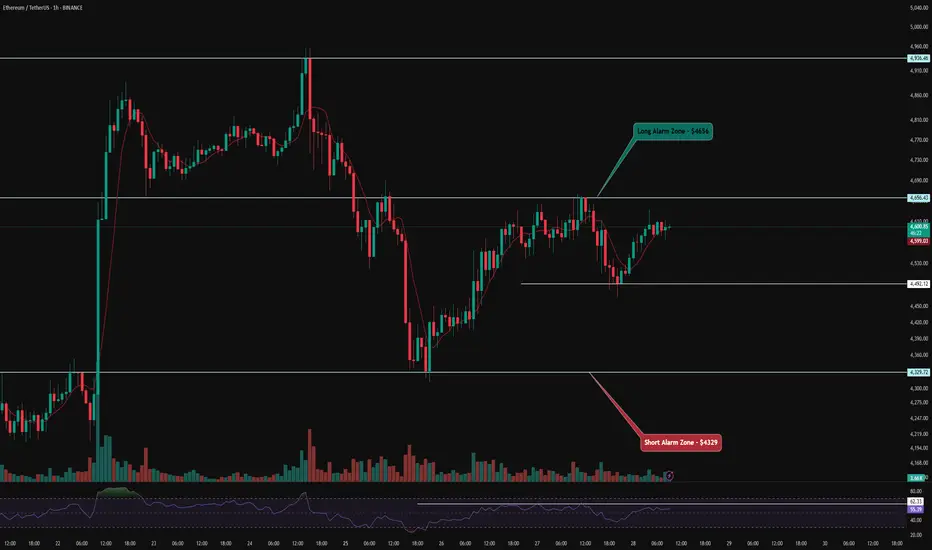
ETH 1H Analysis – Key Triggers Ahead | Day 4💀 Hey , how's it going ? Come over here — Satoshi got something for you !
⏰ We’re analyzing ETH on the 1-hour timeframe timeframe .
👀 On the 1H timeframe for Ethereum, we can observe that ETH is currently moving inside a V-pattern. If the price breaks out and consolidates above the neckline of this pattern, we could see a strong bullish continuation. Checking ETF flow data also shows heavy accumulation of Ethereum, which supports the bullish bias.
⚙️ The key RSI level for ETH sits around 62. Once the RSI crosses above this threshold, Ethereum has the potential to break the neckline of the V-pattern and push into the overbought zone, signaling further upside momentum.
🕯 Additionally, the volume, candle size, and number of green candles are increasing as ETH approaches this resistance. With rising trading volume, ETH could target higher price levels and potentially confirm a new all-time high.
🪙 On the 1H BINANCE:ETHBTC chart , we see a significant resistance level around 0.04274. A breakout above this zone with strong volume and volatility would provide an additional confirmation for a long position in Ethereum.
🔔 Our long setup alert zone is placed around $4652, while the short setup alert zone is positioned near $4329.
❤️ Disclaimer : This analysis is purely based on my personal opinion and I only trade if the stated triggers are activated .
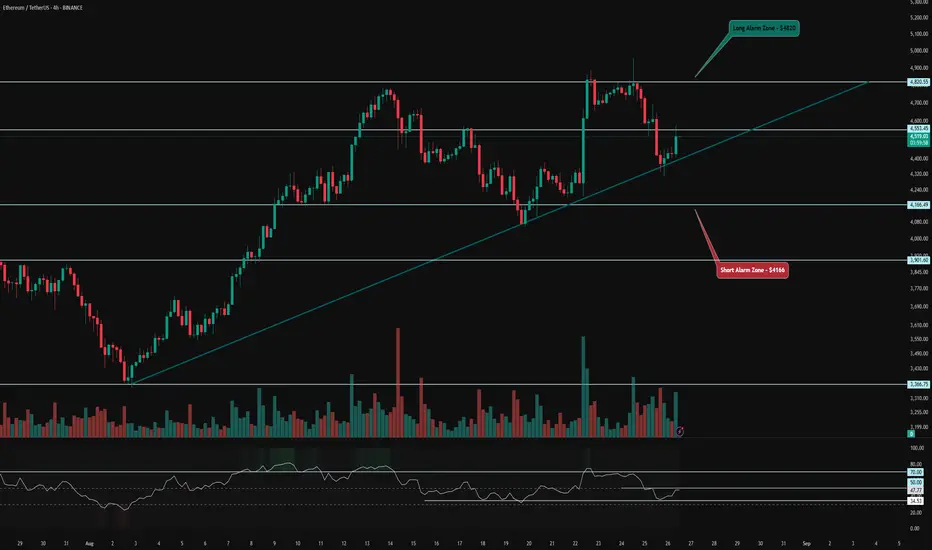
ETH 4H Analysis – Key Triggers Ahead | Day 3💀 Hey , how's it going ? Come over here — Satoshi got something for you !
⏰ We’re analyzing ETH on the 4-hour timeframe timeframe .
👀 We’re observing the 4-hour Ethereum chart, and ETH is trading within a 4-hour box. The ceiling of this box is at the $4,820 level, and the floor is at $4,166. The floor was once faked out, showing a reaction toward the ceiling but got rejected from this area. Buyer makers have kept the price near the midline of the box. A trendline has been drawn from the box’s lower level, and each time ETH hits this trendline, it has shown an upward reversal. Breaking and holding above the midline of the box could push ETH toward the ceiling, with the midline acting as an early trigger .
⚙️ Key RSI levels are at 50 and 70. With increased volatility, long trades on Ethereum could drive it upward, and crossing the 50 level could push ETH’s price into the upper part of the box, giving it another chance to test breaking the 70 level and setting a new high. If rejected and this scenario fails, ETH could experience a deep correction, as it hasn’t entered oversold territory or seen a deep correction for several days .
🕯 The size and volume of green candles have increased compared to red candles, which prevents a deep correction in ETH. However, yesterday in ETFs, people bought a significant amount of Ethereum, and this weakness in the corrective trend suggests that ETH has a stronger tendency to rise and climb .
🪙 We’re observing the 4-hour ETH/BTC index chart, and ETH has a strong support level against Bitcoin at 0.03972, where increased volume triggered a reversal. There’s also a resistance level at 0.04275, and breaking this level with increased volume and RSI entering overbought territory could confirm a long trade for ETH .
🔔 Our trading alarm zones for ETH positions are at $4,820, where breaking this level could signal a long position. An early trigger for a long trade could be at $4,553, where breaking this level increases the likelihood of breaking the ceiling of the 4-hour box. The short trade alarm zone is at $4,166, where breaking this level could initiate a deep correction for ETH .
❤️ Disclaimer : This analysis is purely based on my personal opinion and I only trade if the stated triggers are activated .
BTC 4H Analysis – Key Triggers Ahead | Day 23💀 Hey , how's it going ? Come over here — Satoshi got something for you !
⏰ We’re analyzing BTC on the 1-hour timeframe timeframe .
👀 On the 4-hour Bitcoin chart, after hitting a new high, BTC faced a quick rug pull/sell-off with strong momentum toward the $112,000 support. It then bounced with a solid 4-hour candle toward the $117,000 resistance but got heavily rejected again with selling pressure. BTC is now around $110,000, supported once by buyer makers. Today, check Forex Factory for key US economic news that could impact the market.
⚙️ Key RSI level is near 30; crossing this with high volatility could intensify selling pressure, offering a small risk opportunity. Another key level at 64; breaking this could form a higher low compared to the previous one.
🕯 Red candles are increasing in size and volume, with fewer but larger candles moving downward, indicating sustained selling pressure.
💵 On the 1-hour USDT.D chart, after breaking 4.44%, it’s moving upward but showing trend weakness. This level is key for BTC’s highs and lows. A rejection and drop in dominance could boost BTC and BTC pairs, while a hold above 4.44% could deepen BTC’s correction.
🔔 Trading alarm zones are at $112,240 and $109,800. A break and hold above/below these could offer trade setups. Always check oscillator conditions and Tether dominance. Also, focus on BTC pairs — they provide more momentum with less capital.
❤️ Disclaimer : This analysis is purely based on my personal opinion and I only trade if the stated triggers are activated .

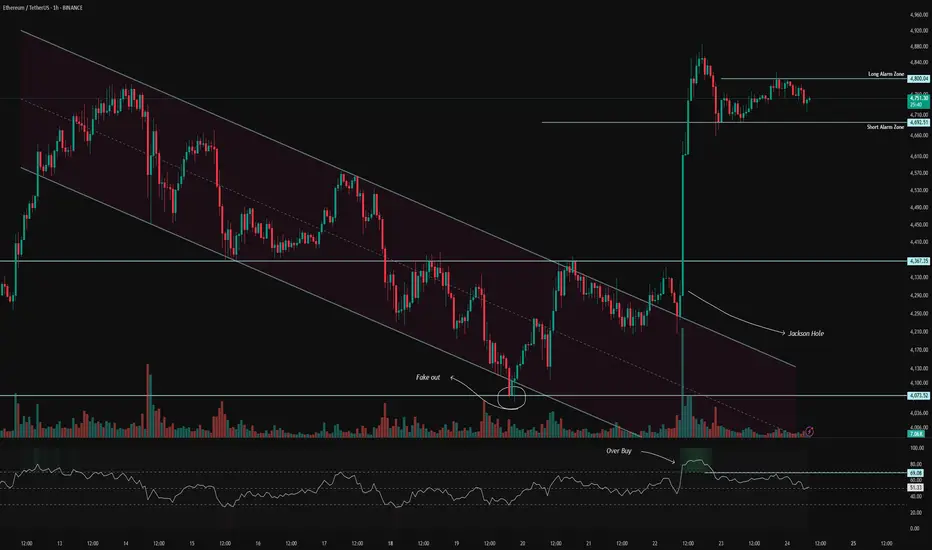
ETH 1H Analysis – Key Triggers Ahead | Day 2💀 Hey , how's it going ? Come over here — Satoshi got something for you !
⏰ We’re analyzing BTC on the 4-hour timeframe timeframe .
👀 On the 1-hour Ethereum chart, after last night’s rally, ETH hit a new all-time high but was rejected and is now moving downward while maintaining its uptrend.
⚙️ Key RSI levels are 50 and 30. Breaking these levels with high volatility could trigger ETH’s next move in either direction.
🎮 Fibonacci drawn from the Jackson Hole event to ETH’s all-time high shows the 0.61 level as a key zone. Losing this could lead to a deeper correction. The 0 Fib level at $4,852 acts as a breakout zone for long trades.
🕯 Red candles are relatively large, but ETH’s pullback is milder than Bitcoin’s. It’s currently at a decision-making zone with a new structure forming.
🪙 ETHBTC pair shows whales are undecided after last night’s drop. The alarm zone for the ETH/BTC pair is at 0.04218; a break above could spark a new bullish leg for ETH.
🔔 ETH’s alarm zone for longs is at $4,852.52. A breakout here with increased volatility and volume could push ETH to higher highs.
❤️ Disclaimer : This analysis is purely based on my personal opinion and I only trade if the stated triggers are activated .

BTC 1H Analysis – Key Triggers Ahead | Day 22💀 Hey , how's it going ? Come over here — Satoshi got something for you !
⏰ We’re analyzing BTC on the 1-hour timeframe timeframe .
👀 On the 1-hour Bitcoin chart, after the last attempt to push toward resistance, it faced a strong rejection at $115,000 and moved toward the box's lower boundary. Currently in the alarm zone for a short position, but personally, I wouldn’t open a short here.
⚙️ Key RSI levels are 45 and 20. The 20 level is a support in the heart of oversold territory, where Bitcoin’s volatility spikes and often sees a reversal. The 45 level acts as resistance, with volatility triggering reversals upon hitting it.
🕯 Volume shows larger and more frequent red candles, with price heading toward its support levels.
💵 USDT.D broke and held above 4.27% but got rejected at 4.4%. A break and hold above 4.4% could increase selling pressure on Bitcoin.
🔔 Bitcoin’s alarm zones today aren’t very logical, so we can focus on altcoins instead. I’ll post a few altcoin picks on TradingView and the channel today.
❤️ Disclaimer : This analysis is purely based on my personal opinion and I only trade if the stated triggers are activated .

BTC 1H Analysis – Key Triggers Ahead | Day 21💀 Hey , how's it going ? Come over here — Satoshi got something for you !
⏰ We’re analyzing BTC on the 1-hour timeframe timeframe .
👀 On the 1-hour timeframe of Bitcoin, we can see that Bitcoin has still maintained a good bullish trend after breaking out of the channel and is currently in correction, but it hasn’t yet formed a proper structure for trades.
⚙️ The key RSI zones are 40 and 70. When the oscillator crosses these levels, trading volatility increases and this will cause price movement.
🕯 Candle size and volume grew during the Jackson Hole event, but since the market is in holidays, there isn’t much volume present. We need to wait for the opening of the next weekly candle for volume to enter the market.
💵 On the 1-hour timeframe of USDT.D , we can see that during the Jackson Hole event, Tether dominance moved strongly downward into an oversold area, and a large amount of Tether entered the market.
🔔 Bitcoin alarm zones are still the same as before. Breaking these levels can give us positions. Since Bitcoin hasn’t built a complete structure yet and the market is in holidays, we won’t take trades.
❤️ Disclaimer : This analysis is purely based on my personal opinion and I only trade if the stated triggers are activated .

ETH 1H Analysis – Key Triggers Ahead | Day 1💀 Hey , how's it going ? Come over here — Satoshi got something for you !
⏰ We’re analyzing BTC on the 4-hour timeframe timeframe .
👀 On the 1-hour timeframe of Ethereum, we can see that it had a descending channel. It faked out once at the bottom of the channel and then ranged at the top of the channel. Before the Jackson Hole event, it broke out of the channel, and with the Jackson Hole event, it pumped. The price jump Ethereum experienced was remarkable. That’s why we couldn’t open a position on Ethereum .
⚙️ The key zone at 70 can be a good volatility level for long trades, and the key zone at 50 can be a volatility level for short trades .
🕯 Looking at the candle sizes, during the Jackson Hole event the green candles became bigger, and excellent volume entered Ethereum during this event .
🪙 Ethereum to Bitcoin pair , we can see that with breaking the marked zone, Ethereum compared to Bitcoin can gain more value and move upwards again .
🔔 Ethereum alarm zone for long positions is $4800. For short positions, it’s better not to set an alarm because the trend is bullish. The pair against Bitcoin is also bullish, and Tether dominance has faced a heavy rejection from its top .
❤️ Disclaimer : This analysis is purely based on my personal opinion and I only trade if the stated triggers are activated .
BTC 4H Analysis – Key Triggers Ahead | Day 20💀 Hey , how's it going ? Come over here — Satoshi got something for you !
⏰ We’re analyzing BTC on the 4-hour timeframe timeframe .
👀 On the 4-hour timeframe, Bitcoin is moving inside a 4H range box. The top of this box is at the $122,300 level and the bottom is at the $112,000 level. The midline of the box is around $117,000, and after touching this level the price got rejected downwards .
⚙️ On the RSI, we have two key zones: 30 and 64. When the oscillator crosses these zones, long or short trading volatility increases and the probability of entering overbought or oversold conditions rises .
🕯 On the 4H chart, the size of the buying candles has become noticeably large. After yesterday’s news, the market faced holidays and volume decreased, but with the opening of the new weekly candle, we may see an increase in trading volume. This could bring more volume into long positions .
💵 USDT.D on the 4-hour timeframe has a support at 4.19% and a resistance at 4.35%. Breaking either of these levels could inject significant volume into Bitcoin. Tether selling volume has been relatively strong and faced selling pressure, which could push this drop further .https://www.tradingview.com/x/4bTsKokC
🔔 Our trading alarm zones are placed at $117,000 and $112,000. Price action around these levels, with the start of the new week, can be strong. Selling pressure on Tether and a potential interest rate cut may shift the market sentiment toward long positions .
❤️ Disclaimer : This analysis is purely based on my personal opinion and I only trade if the stated triggers are activated .

BTC 4H Analysis – Key Triggers Ahead | Day 19💀 Hey , how's it going ? Come over here — Satoshi got something for you !
⏰ We’re analyzing BTC on the 4-hour timeframe timeframe .
👀 On the 4H timeframe of Bitcoin we observe that, after being rejected from the 115,000$ area, it is moving towards its support in the 112,000$ zone .
⚙️ We have two key areas on RSI: the support area around 30, where RSI is currently located, and the key zone for a trend change around 73, where volatility usually increases .
🕯 The size of the red candles has each time been larger than the green candles, showing stronger selling pressure .
💵 USDT.D on the 4H timeframe has resistance around the 4.46% area. If this area breaks, Bitcoin selling pressure will increase .Note that Tether dominance is close to its 4H top .
🔜 Today is the Jackson Hole event .
🔔 The alarm zone for a short position is at the 112,000$ level. If this level is lost and price action confirms, we can have a very low-risk trade. For a long position, breaking the 115,000$ area could be the start of a trend reversal .
❤️ Disclaimer : This analysis is purely based on my personal opinion and I only trade if the stated triggers are activated .

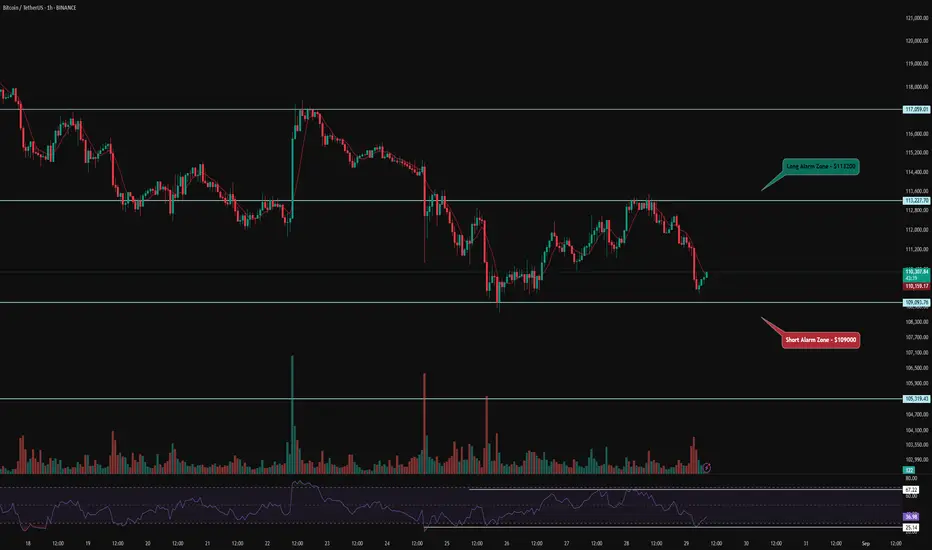
BTC 1H Analysis – Key Triggers Ahead | Day 18💀 Hey , how's it going ? Come over here — Satoshi got something for you !
⏰ We’re analyzing BTC on the 1-hour timeframe timeframe .
👀 On the 1-hour timeframe of Bitcoin, we can see that after hitting the $115,000 zone, it got rejected with a relatively strong red candle and is now moving toward its support at $112,700 .
⚙️ We have two key zones in the RSI : the support zone at 30 , and the resistance zone for long positions at 59.67. Breaking these levels can push Bitcoin toward its alarm zone and sensitive price area for a breakout .
🕯 The size of the red candles is getting smaller , showing reduced selling pressure , while the green reversal candles from $112,700 are closing larger and stronger than before .
💵 USDT.D on the 1-hour timeframe is moving toward its resistance at 4.46% , but the trend is weakening and the size of the buying candles is shrinking . In previous attempts to reach this zone, it faced rejection . If the 4.36% support level is lost , strong inflows could move into Bitcoin .
🔔 Our trading alarm zones are at $115,000 and $112,700 . These zones usually break with increased volume and volatility , and by watching price behavior there , we can find the best trading opportunities .
❤️ Disclaimer : This analysis is purely based on my personal opinion and I only trade if the stated triggers are activated .

BTC 1H Analysis – Key Triggers Ahead | Day 15💀 Hey , how's it going ? Come over here — Satoshi got something for you !
⏰ We’re analyzing BTC on the 4-hour timeframe timeframe .
👀 On the 4H timeframe of Bitcoin, we can see that after breaking the $117,000 zone, Bitcoin faced strong selling pressure, which aligned with the Tokyo session open.
⚙️ The key RSI level is at 26. If this level is lost, Bitcoin could face even stronger selling pressure. The current RSI is around 30, which is marking a boundary for short-trade volatility.
🕯 Both trading volume and sell orders are increasing. With stronger selling pressure, Bitcoin could see a deeper correction.
💵 USDT dominance is getting heavier and forming green candles. However, the dominance is showing weakness in its upward trend. With strong support from USDT buyers, it could trigger a deeper correction across the broader market.
🔔 It’s better not to set alert zones yet, as Bitcoin is currently in a decision-making area, building a new structure. Once this new structure forms, our alert zones will become clearer.
❤️ Disclaimer : This analysis is purely based on my personal opinion and I only trade if the stated triggers are activated .

BTC 1H Analysis – Key Triggers Ahead | Day 14💀 Hey , how's it going ? Come over here — Satoshi got something for you !
⏰ We’re analyzing BTC on the 1-hour timeframe timeframe , we can see that Bitcoin is building a range above the $117,000 support level while trading with reduced volume.
👀 After breaking through the $118,000 zone (which acted as the midline of the range), Bitcoin has formed a consolidation just above $117,000. At the moment, it is ranging with a slight upward bias in the short term.
🕯 Trading volume and the number of transactions have decreased due to the weekend/holidays.
⚙️ On the RSI, the key resistance zone is 65.63. A breakout above this level could increase the probability of moving into overbought territory. On the other hand, losing the support zone around 37.82 could trigger selling pressure and push RSI into oversold territory.
🔔 Our alarm zones are set at $119,000 and $117,000. Breaking either of these levels could provide a trading signal. Monitoring price action around these zones will give clearer entries.
💵 Looking at USDT.D , we can see a 1-hour box range structure. It recently broke down from the bottom of the box. Now, the question is whether this decline will continue or if it will return inside the range.
🖥 Summary: Bitcoin is currently consolidating in a range with a slightly upward slope. However, due to the weekend, trading volume has dropped significantly, so any breakout needs confirmation with stronger liquidity.
❤️ Disclaimer : This analysis is purely based on my personal opinion and I only trade if the stated triggers are activated .

BTC 1H Analysis – Key Triggers Ahead | Day 13💀 Hey , how's it going ? Come over here — Satoshi got something for you !
⏰ We’re analyzing BTC on the 1-hour timeframe timeframe, we’re observing price action.
👀 After the recent drop, Bitcoin has moved into a 1H range box. A breakout on either side of this box can give us a potential long or short setup.
🕯 Trading volume is lower due to the holidays, and Bitcoin usually carves out a decision zone toward the end of each week.
⚙️ Our RSI oscillator shows an important swing area around the 50 level. Holding above 50 increases the odds that the $117,000 floor will act as stronger support.
🔔 Two alert zones based on the chosen breakout: price behavior around $119,000 and $117,000 can help determine which position to take.
💵 We’re monitoring Tether (USDT) dominance. It’s also sitting in a 1-hour range box; a breakout in either direction could feed trading volume into Bitcoin .
🖥 Summary: Bitcoin is in a 1-hour multi-timeframe range box, and the $117,000 support looks firmer than before.
❤️ Disclaimer : This analysis is purely based on my personal opinion and I only trade if the stated triggers are activated .

BTC 1H Analysis – Key Triggers Ahead | Day 12💀 Hey , how's it going ? Come over here — Satoshi got something for you !
BINANCE:BTCUSDT
⌛ On the 1-hour Bitcoin timeframe, we can see that the trend has shifted from bullish to a deep correction. The reason for this move was the release of higher-than-expected Producer Price Inflation, influenced in part by Trump’s tariff policies. As a result, the likelihood of an interest rate ( CPI) cut has decreased — which is not particularly favorable news for the market.
👀 After forming a new all-time high, Bitcoin faced heavy selling pressure and a sharp rejection, pushing it towards support levels. The current key support for Bitcoin is at $117,200, which could attract market makers (buyer entries). The next support is likely around $115,000.
🎮 Fibonacci levels have been drawn from a higher low to Bitcoin’s all-time high. The most important levels are $117,200 and $119,800. A breakout above or below these levels could provide potential long or short trading opportunities.
⚙️ On the RSI, the key resistance zone is at 35.88. Historically, each time the RSI has reached this level, Bitcoin has reacted strongly. A rejection here could lead to a deeper correction, while a breakout above it could trigger upward momentum.
🕯 Both trading volume and the number of transactions are increasing, but selling pressure is leaving increasingly “red” candles. This rise in volume could be a useful signal for planning entries.
🔔 There’s no specific alarm zone today since Bitcoin is in a phase of uncertainty, and the exact reason for the market’s drop has not yet been fully absorbed.
CRYPTOCAP:USDT.D 📈USDT.D has broken a strong resistance level and is now moving toward its next resistance .
🖥 Summary: Trump’s tariffs have fueled higher producer inflation, reducing the chances of a rate cut. Bitcoin’s critical support is at $117,200; if this breaks, the price could move towards lower levels.
❤️ Disclaimer : This analysis is purely based on my personal opinion and I only trade if the stated triggers are activated .

BTC 1H Analysis – Key Triggers Ahead | Day 11💀 Hey , how's it going ? Come over here — Satoshi got something for you !
⏰ We’re analyzing BTC on the 1-hour timeframe , we observe it approaching the 99 moving average .
👀 Bitcoin moved upwards after breaking the $117,500 level, creating a new historical high at $124,474, then was rejected by sellers at this level and is now correcting this upward leg. Today is a news day, so keep an eye on the market.
🎮 A Fibonacci retracement has been drawn from the channel breakout to the new high, showing support at the 0.61 level, which coincides with our 99 moving average, making it a relatively good support zone. The key level for an upward movement is breaking 0.37, which would end our correction trend.
👑 We observe the moving averages where the 7-period moving average has crossed over the 25-period moving average from above, and the price is approaching the 99 moving average.
⚙️ The key RSI zone for us is at 37.84, which has shown an upward reversal, serving as our RSI support. Breaking this zone could lead to further oscillation towards 30. The next key zones are 50 and 70, where Bitcoin could move towards with increased volume and number of trades.
🕯 We see that Bitcoin has experienced increased volume at breakout zones, and there's a strong seller zone above this area where buy orders are triggered each time the price reaches this zone. Breaking this zone would require a significant volume increase from major buyers.
🔔 An alert zone for Bitcoin has been set at 0.37, where upon reaching this price, you can check market behavior for a long position and make the most logical trading decision.
📊 We observe Tether's dominance, which has moved upward after breaking the 4.10 resistance level. The next resistance for Tether's dominance is the 4.20 zone. If this level is broken, Bitcoin could undergo a deeper correction. 💸 Conversely, if it breaks below the 4% level, it could move toward forming a new high.
🖥 Summary : Today is a news day, and Bitcoin could experience unusual fluctuations. Make sure to manage your capital and risk properly. Also, remember that the news released can have several scenarios: initial impact, secondary impact, long-term effects, ... .
❤️ Disclaimer : This analysis is purely based on my personal opinion and I only trade if the stated triggers are activated .
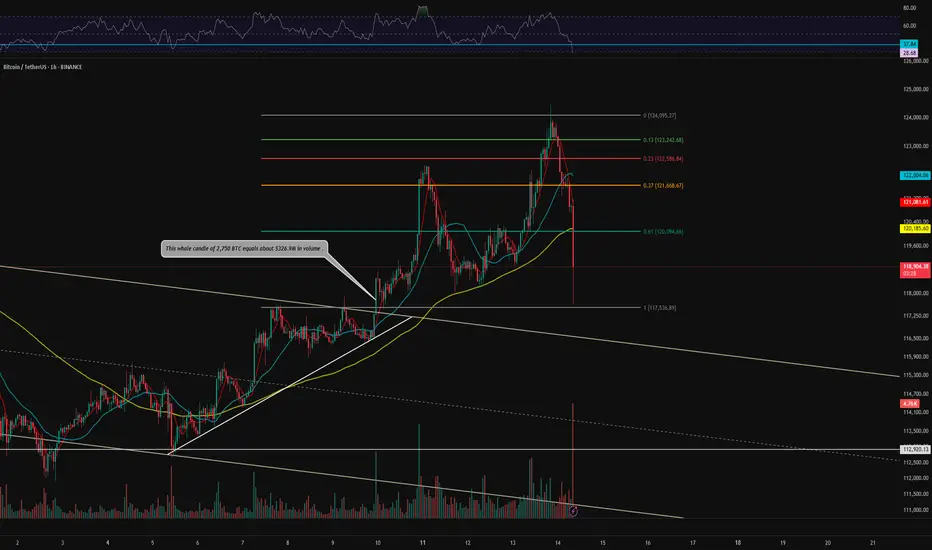
BTC 1H Analysis – Key Triggers Ahead | Day 10💀 Hey , how's it going ? Come over here — Satoshi got something for you !
⏰ We’re analyzing BTC on the 1-hour timeframe .
👀 After completing its correction, BTC broke the 120,140 zone and consolidated above it, now heading toward higher resistance levels. Increasing buy volume and support from moving averages are observed .
🎮 Fib drawn from the bearish channel breakout to the 122,300 ticker seller zone. The last resistance for ending the correction and forming a new bullish structure was the 0.61 Fib level, which was broken and consolidated above. The next resistance (potential new ATH) is at the 0 Fib level .
⚙️ BTC is approaching the overbought zone on RSI , which could facilitate a stronger push toward resistance and a potential breakout .
👑 Moving Averages:
MAs (medium and low wave cycles) are strongly bullish , showing high momentum .
🕯 Volume & Market Session :
Rising buy volume is noted . We're approaching the New York session, which may bring increased buying pressure. Stay at your system during this session to monitor the chart .
🔔 Set an alert at 122,300 to observe price behavior. This zone offers low-risk trading opportunities , and price action here can guide trade decisions .
🖥 Summary : BTC has broken the key Fibonacci zone, signaling the end of its correction. Taking a long position now may be challenging , but price action at 122,300 can provide a good trading opportunity .
📊 On the 1H timeframe for USDT.D , USDT.D broke the 4.10 zone and is moving downward. The next support is at 3.92 .
❤️ Disclaimer : This analysis is purely based on my personal opinion and I only trade if the stated triggers are activated .
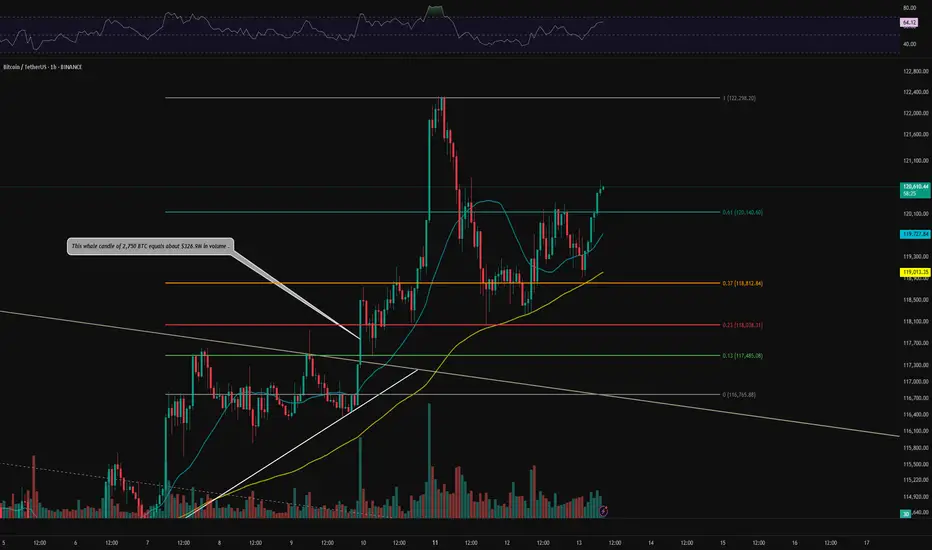
BTC 1H Analysis – Key Triggers Ahead | Day 9💀 Hey , how's it going ? Come over here — Satoshi got something for you !
⏰ We’re analyzing BTC on the 1-hour timeframe after today’s CPI release .
👀 Following the CPI news, Bitcoin broke through key areas — including the descending channel and the $117,000 resistance — and moved higher. It then faced rejection from the previous high, pulling back to around $118,000, which aligns with a multi-timeframe 4H SMA25 bounce. After that, it broke the $119,000 level and is now heading toward its key resistance at $120,000.
🎮 Fibonacci drawn from the current high to the price jump zone shows our current key level at 0.61, which is a relatively strong resistance. Breaking above this Fibonacci level could send BTC toward its current high and potentially lead to a new ATH.
⚙️ On the RSI oscillator, the key level is 70. Entering the overbought zone could push BTC toward its current high.
👑 The 99 MA is forming a strong base below the 0.37 level, while the 25 MA is working to break resistance and push price upward. On the 4H multi-timeframe view, the 0.23 area acts as a rebound zone after touching the 25 MA.
🕯 Volume and trade count are increasing, with solid consolidation above zones where whales have been buying and accumulating. Following today’s CPI results, fresh capital has flowed into risk assets like Bitcoin. This could be highly attractive for other coins, especially BTC pairs that are bullish in these conditions.
🔔 You can set an alert at the $120,000 area to watch price action when it reaches this level. If it matches your setup confirmations, you can open a position. Personally, I have a profitable long position on Ethereum, which is considered a BTC pair.
📊 On the 1H timeframe for USDT.D, we can see that after reacting to 4.20%, it faced a drop, and with a break below 4.10%, BTC could set a new high.
🖥 Summary: Bitcoin is moving toward its $120,000 resistance, where we could consider opening positions. The most important factor will be holding and confirming above this level.
❤️ Disclaimer : This analysis is purely based on my personal opinion and I only trade if the stated triggers are activated .

BTC 1H Analysis – Key Triggers Ahead | Day 8💀 Hey , how's it going ? Come over here — Satoshi got something for you !
⏰ We’re analyzing BTC on the 4-hour timeframe , Bitcoin is pushing toward its all-time high with a massive, high-volume whale candle .
👀 After breaking through its resistance zones, Bitcoin surged toward its ATH but faced rejection and selling pressure near that level. Key potential support areas are the 25 and 99 moving averages, marked in yellow and sky blue on the chart. The 25 MA is close to the 0.61 Fibonacci level, around $118,000, and is moving toward the average of the last 25 candles. A reaction to this moving average could indicate whether Bitcoin will rebound or drop further .
⚙️ Bitcoin’s key RSI zone is at 55.25, which corresponds to the $118,000 range. Breaking below this could push RSI under 50 .
🎮 Fibonacci retracement drawn from the breakout and pullback of the V-pattern shows that the 0.13 and 0.23 levels failed under selling pressure, sending BTC toward lower support levels. The current support based on Fibonacci is at 0.37. If this is lost, BTC could range on the 4-hour chart between 0.37 and 0.61 .
✉️ Tomorrow at 8:30 AM New York time, the official CPI (Consumer Price Index) report will be released by the U.S. Bureau of Labor Statistics. This news can significantly impact the crypto market — if inflation decreases, purchasing power rises , and Bitcoin could set a new all-time high .
🕯 BTC trading volume and activity are strong in both directions. Each price surge is followed by a quicker consolidation, and corrections occur under selling pressure .
🔔 An alert zone is set at the 0.13 Fibonacci level to observe price behavior when it reaches that point, then decide on the best course of action .
📊 A break below Tether dominance at 4.10% would signal a long position on BTC, while a break above 4.20% could lead BTC into a deeper correction .
🖥 Summary : Tomorrow’s CPI news could spark large, powerful candles and potentially a new ATH for Bitcoin. If U.S. inflation increases, stronger selling pressure is possible. There’s no specific trigger for this current level, but breaking 0.13 will prompt me to open a position — or at least take trades on altcoins with a bullish correlation to Bitcoin .

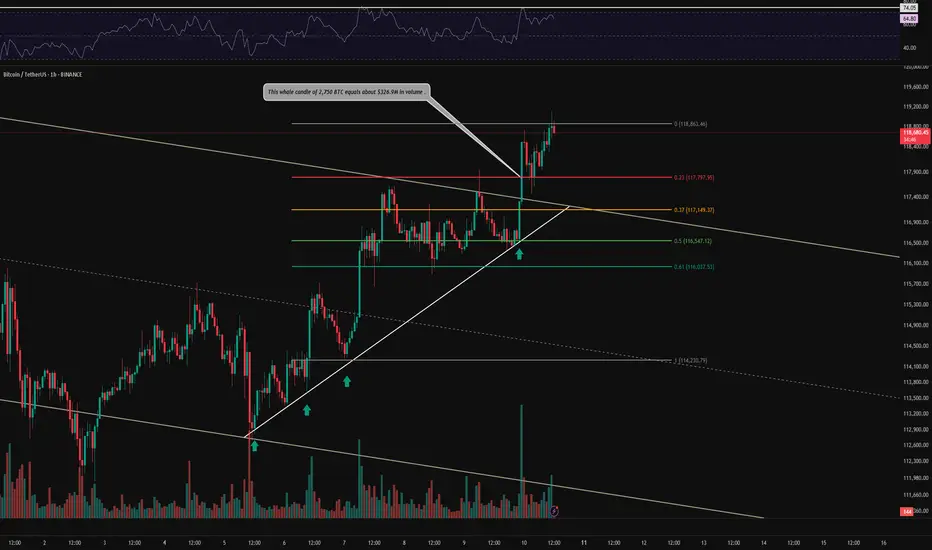
BTC 1H Analysis – Key Triggers Ahead | Day 7💀 Hey , how's it going ? Come over here — Satoshi got something for you !
⏰ We’re analyzing BTC on the 1-hour timeframe .
👀 After breaking out of its descending channel, Bitcoin is moving upward with a high-volume whale candle.
🕯 The trading volume and number of trades are rising sharply, and this volume increase during the New York session could lead to Bitcoin forming a new high.
⚙️ Our key RSI level is 74.05. If this level breaks, the volatility of Bitcoin’s long positions could increase significantly, potentially triggering a price surge.
🎮 After breaking the 0 Fibonacci level and pulling back to it, we can open our positions in line with the market structure change and move with the market.
🔒 An upward-sloping trendline has been drawn from the channel’s bottom to the top, and on the fourth reaction to it, Bitcoin bounced and beautifully broke through the channel’s top.
🔔 There’s no specific alert zone unless the current market structure changes, in which case an alert zone will be provided.
🖥 Summary: Bitcoin is moving upward, our long position trigger has been activated, and if the current structure is maintained, it could continue toward higher price levels.
📊 If USDT.D drops below 4.20% BTC might push toward higher targets .
❤️ Disclaimer : This analysis is purely based on my personal opinion and I only trade if the stated triggers are activated .