#EURJPY , BuySide QuickScalp ?📊 Morning Market Brief | London Session Prep
🔎 Instrument Focus: #EURJPY
⚠️ Risk Environment: High
📈 Technical Overview:
Lets have it in BUY side as well .
🚀 Trading Plan:
• Wait for Momentum around key levels
• LTF ENTRY NEEDED
• Manage risk aggressively, protect capital first
🧠 Stay updated with real time news and macro events, visit 👉 @News_Ash_TheTrader_Bot
#Ash_TheTrader #Forex #EURUSD #MarketInsight #PriceAction #TradingPlan #RiskManagement #LondonSession #Scalping #Futures #NQ #Gold
Scalper

First 2026 Shot on #NZDUSD ?📊 Morning Market Brief | London Session Prep
🔎 Instrument Focus: #NZDUSD
⚠️ Risk Environment: High
📈 Technical Overview:
I'm Not a fan of it but , lets see . with a valid momentum Structure we can take it as a QuickScalp
🚀 Trading Plan:
• Wait for Momentum around key levels
• No chasing moves, let price come to you
• Manage risk aggressively, protect capital first
🧠 Stay updated with real time news and macro events, visit 👉 @News_Ash_TheTrader_Bot
#Ash_TheTrader #Forex #EURUSD #MarketInsight #PriceAction #TradingPlan #RiskManagement #LondonSession #Scalping #Futures #NQ #Gold

Last Shot on #EURUSD 📌 Market Insight: {#EURUSD }
⚠️ Risk Assessment: {High}
🚀 Approach:
Not a Quality setup and its a NO NEWS DAY .
I don't wanna risk too much on these 2 days and just wanna chill .
EU couldn't be ok if and if we do have a MOMENTUM Structure ... just for QuickScalp
#Ash_TheTrader #Forex #GBPJPY #MarketAnalysis #TradingSetup #RiskManagement #GOLD #Scalper #NQ #EURUSD

Another QuickScalp on #USDJPY ? ... 📌 Market Insight: {#USDJPY }
⚠️ Risk Assessment: {High}
🚀 Approach:
Not a Quality setup but by a valid momentum structure we can take it as QuickScalp .
#Ash_TheTrader #Forex #GBPJPY #MarketAnalysis #TradingSetup #RiskManagement #GOLD #Scalper #NQ #EURUSD

#EURUSD , Risky Setup📌 Market Insight: {#EURUSD }
⚠️ Risk Assessment: {High}
🚀 Approach:
Not a Quality setup at all ... need VALID LTF entry sign first. ... shouldn't go to Edge and then back up .... QuickScalp setup
#Ash_TheTrader #Forex #GBPJPY #MarketAnalysis #TradingSetup #RiskManagement #GOLD #Scalper #NQ #EURUSD

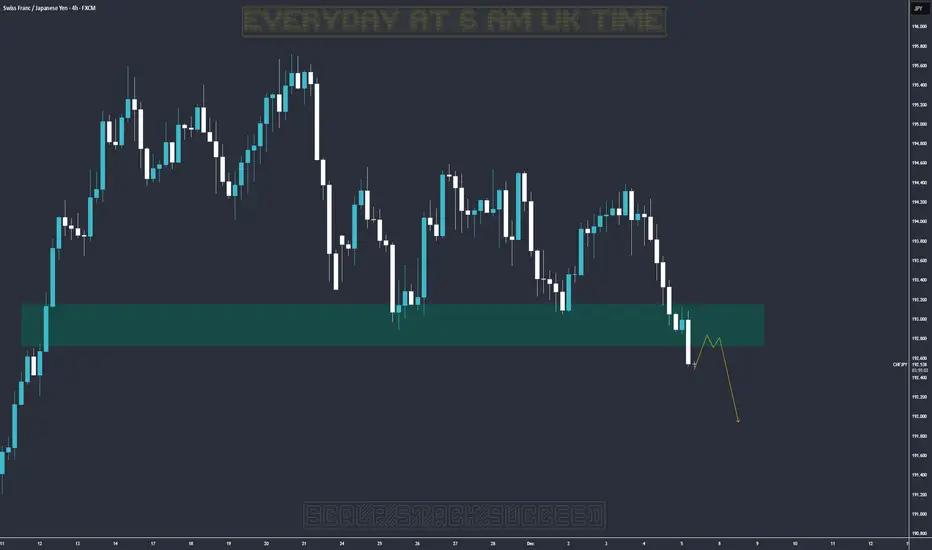
a Risky one , #CHFJPY📌 Market Insight: {#CHFJPY }
⚠️ Risk Assessment: {High}
🚀 Approach:
Not a Quality setup but maybe it follows its daddy's momentum . need valid momentum structure first .
#Ash_TheTrader #Forex #GBPJPY #MarketAnalysis #TradingSetup #RiskManagement #GOLD #Scalper #NQ #EURUSD

QuickScalp on #GBPJPY 📌 Market Insight: {#GBPJPY }
⚠️ Risk Assessment: {High}
🚀 Approach:
At opening and this kinda moves , shows me its a Risky Setup
IF we do have LTF entry sign ... we can have it . as QuickScalp
Both #GBPUSD and #EURUSD is still valid .
#Ash_TheTrader #Forex #GBPJPY #MarketAnalysis #TradingSetup #RiskManagement #GOLD #Scalper #NQ #EURUSD

QuickScalp on #GBPUSD 📌 Market Insight: {#GBPUSD }
⚠️ Risk Assessment: {High}
🚀 Approach:
Last setup of the week. need valid momentum structure first .... Just for QuickScalp .
i'll be wait for it , for like next 3 hours .
#Ash_TheTrader #Forex #GBPJPY #MarketAnalysis #TradingSetup #RiskManagement #GOLD #Scalper #NQ #EURUSD

an Add on position on EU ? 📌 Market Insight: {#EURUSD }
⚠️ Risk Assessment: {High}
🚀 Approach:
Maybe we could have a chance to add another position to EU . but no rush . as its friday i rather to be safe than do a risky trade
#Ash_TheTrader #Forex #GBPJPY #MarketAnalysis #TradingSetup #RiskManagement #GOLD #Scalper #NQ #EURUSD

another Runner QuickScalp on #GBPUSD📌 Market Insight: {#GBPUSD }
⚠️ Risk Assessment: {High}
🚀 Approach:
a HighRisk Setup ... super risky
Ony and Only By LTF entry we can take it .... as QuickScalp
#Ash_TheTrader #Forex #GBPJPY #MarketAnalysis #TradingSetup #RiskManagement #GOLD #Scalper #NQ #EURUSD

#GBPUSD Quickscalp📌 Market Insight: {#GBPUSD }
⚠️ Risk Assessment: {High}
🚀 Approach:
Not a perfect market to trade at all ... but lets have it in our watchlist .
Need valid Momentum structure and just for QuickScalp .
#Ash_TheTrader #Forex #GBPJPY #MarketAnalysis #TradingSetup #RiskManagement #GOLD #Scalper #NQ #EURUSD

QuickScalp on #USDJPY📌 Market Insight: {#USDJPY }
⚠️ Risk Assessment: {High}
🚀 Approach:
Not a Quality Setup ... Need VALID Momentum Structure .
As its NO NEWS day better to just chill .....
#Ash_TheTrader #Forex #GBPJPY #MarketAnalysis #TradingSetup #RiskManagement #GOLD #Scalper #NQ #EURUSD

QuickScalp on #CHFJPY📌 Market Insight: {#CHFJPY }
⚠️ Risk Assessment: {High}
🚀 Approach:
Not a Quality Setup ... Need VALID LTF entry Sign first ! ... NO RUSH... Its friday i rather to have NO trade than have a RISKY trade .
#Ash_TheTrader #Forex #GBPJPY #MarketAnalysis #TradingSetup #RiskManagement #GOLD #Scalper #NQ #EURUSD
HighRisk QuickScalp on #GBPJPY📌 Market Insight: {#GBPJPY }
⚠️ Risk Assessment: {High}
🚀 Approach:
Not a Quality Setup ... Need VALID LTF entry Sign first ! ... NO RUSH
#Ash_TheTrader #Forex #GBPJPY #MarketAnalysis #TradingSetup #RiskManagement #GOLD #Scalper #NQ #EURUSD

QuickScalp on #EURUSD 📌 Market Insight: {#EURUSD }
⚠️ Risk Assessment: {High}
🚀 Approach:
Need a valid Momentum Structure , a nice one
better to have LTF entry sign first
#Ash_TheTrader #Forex #GBPJPY #MarketAnalysis #TradingSetup #RiskManagement #GOLD #Scalper #NQ #EURUSD

a QuickScalp on #GBPUSD📌 Market Insight: {#GBPUSD }
⚠️ Risk Assessment: {High}
🚀 Approach:
Same as UJ , Not a perfect setup ... need valid LTF entry sign first .
No rush .
Just for QuickScalp
#Ash_TheTrader #Forex #GBPJPY #MarketAnalysis #TradingSetup #RiskManagement #GOLD #Scalper #NQ #EURUSD

a Risky QuickScalp on #EURUSD📌 Market Insight: {#EURUSD }
⚠️ Risk Assessment: {High}
🚀 Approach:
Not a Quality setup and market seems need time be sorted out .
We can have it as a Quickscalp by a nice valid momentum Structure .
#Ash_TheTrader #Forex #GBPJPY #MarketAnalysis #TradingSetup #RiskManagement #GOLD #Scalper #NQ #EURUSD

#EURJPY , HighRisk QuickScalp📌 Market Insight: {#EURJPY }
⚠️ Risk Assessment: {High}
🚀 Approach:
Super Risky Setup ... at ATH and we need becareful
Just for QuickScalp
#Ash_TheTrader #Forex #GBPJPY #MarketAnalysis #TradingSetup #RiskManagement #GOLD #Scalper #NQ #EURUSD

#EURUSD , Maybe ... a BuySide QuickScalp📌 Market Insight: {#EURUSD }
⚠️ Risk Assessment: {High}
🚀 Approach:
Not a Quality setup ... Lets see
need valid Momentum Structure ...
#Ash_TheTrader #Forex #GBPJPY #MarketAnalysis #TradingSetup #RiskManagement #GOLD #Scalper #NQ #EURUSD

#BTC – Isn’t it time to buy?#BTC – Isn’t it time to buy? 🚀
By analyzing market structure and outside news, BTC is approaching the zone where I’d seriously consider entering .
📍 88k–76k is the key range I’m watching for potential buys, aiming for 15–40%+ profit with a 15% stop los s.
⚡️ Important: Wait for LTF entry sign – don’t jump in blindly . Always do your own research before making a move.
#CryptoTrading #Bitcoin #BTC #ScalpTrading #CryptoAnalysis #BTCScalp #CryptoStrategy #TradeSmart #HODL #BitcoinAnalysis

another BuySide QuickScalp #GBPJPY 📌 Market Insight: {#GBPJPY }
⚠️ Risk Assessment: {High}
🚀 Approach:
Lets see , does it give us another QuickScalp or not ... its More Riskier than Yesterday
#Ash_TheTrader #Forex #GBPJPY #MarketAnalysis #TradingSetup #RiskManagement #GOLD #Scalper #NQ #EURUSD

a BUYSIDE setup at #EURUSD 📌 Market Insight: {#EURUSD }
⚠️ Risk Assessment: {High}
🚀 Approach:
EU Would be OK SAME as #GBPUSD ... we need momentum structure ...
#Ash_TheTrader #Forex #GBPJPY #MarketAnalysis #TradingSetup #RiskManagement #GOLD #Scalper #NQ #EURUSD

Taking tiny profits from very short-term trades USDJPY USDJPY Technical Outlook - 11 Nov 2025
USD/JPY consolidates at 154.322 (8:25 AM UTC+4) within a critical decision zone
━━━━━━━━━━━━━━━━━━━━━━━━━━━━━━━━━━━━
⚡ EXECUTIVE SUMMARY
Price action reveals Wyckoff distribution characteristics following the October surge. Dow Theory signals weakening momentum with lower highs forming. Gann analysis identifies 154.50 as a pivotal resistance level, while 153.80 provides critical support through Square-of-9 calculations.
━━━━━━━━━━━━━━━━━━━━━━━━━━━━━━━━━━━━
🔬 CROSS-TIMEFRAME ANALYSIS
💠 Daily Perspective: Spinning top candlestick cluster near 154.00 suggests indecision; Ichimoku cloud support rests at 152.50; RSI 48 (neutral territory)
💠 4-Hour View: Rectangle consolidation pattern (153.80-154.50); bearish divergence on RSI; EMA50/EMA200 flat (trend exhaustion)
💠 1-Hour Structure: Potential head-and-shoulders formation with neckline at 153.80; VWAP oscillating around 154.15; volume declining
💠 30-Minute Action: Descending triangle forming; Bollinger Bands in extreme squeeze (bandwidth 0.6%); hidden bear divergence
💠 15-Minute Setup: Bearish pennant below 154.40; Tenkan55 + VWAP reclaim
━━━━━━━━━━━━━━━━━━━━━━━━━━━━━━━━━━━━
🎯 BREAKOUT SCENARIOS
⬆️ Upside Break: Sustained 1H close above 154.50 opens 155.00 target (invalidates H&S;)
⬇️ Downside Break: 1H close below 153.80 activates 153.20 measured move (H&S; completion)
━━━━━━━━━━━━━━━━━━━━━━━━━━━━━━━━━━━━
📉 TECHNICAL INDICATOR CONSENSUS
RSI (Multiple TFs): Bearish divergence on 4H; neutral 1H; overbought 15M
Bollinger Bands: Extreme squeeze on 30M signals imminent volatility expansion
VWAP: Acting as dynamic resistance; sellers defending 154.20
Moving Averages: Death cross risk on 4H (EMA21 approaching EMA50 from above)
Ichimoku: Price below cloud on 1H; Chikou span trapped below price (bearish)
━━━━━━━━━━━━━━━━━━━━━━━━━━━━━━━━━━━━
⚠️ CRITICAL PATTERN ALERTS
🚨 Head-and-shoulders neckline at 153.80 (breakdown = -70 pip target)
🚨 Harmonic bearish Gartley forming; PRZ completion at 154.50
🚨 Bull trap risk above 154.40 if volume remains weak
🚨 Elliott Wave suggests Wave C correction targeting 153.50-153.20
━━━━━━━━━━━━━━━━━━━━━━━━━━━━━━━━━━━━
🕐 TIMING & CATALYSTS
Tokyo session close at 09:00 UTC typically triggers volatility
BoJ intervention zone historically around 155.00+ (extreme caution)
Gann time cycle suggests reversal window 10:00-12:00 UTC
ATR(14) = 0.85 (elevated intraday range expected)
━━━━━━━━━━━━━━━━━━━━━━━━━━━━━━━━━━━━
🛡️ RISK PARAMETERS
Position Size: Limit to 0.75% account risk (intervention uncertainty)
Avoid holding through London open (08:00 GMT) without stops
Scale out 40% at first target; trail remainder with 20-pip buffer
False breakout probability HIGH—wait for confirmation closes
━━━━━━━━━━━━━━━━━━━━━━━━━━━━━━━━━━━━
This analysis serves educational purposes. Central bank intervention risk remains elevated. Trade with strict risk management and adapt to evolving price action.
