GBPUSD M15 FVG Pullback and Intraday Bullish Continuation Setup📝 Description
FX:GBPUSD is holding above intraday demand after a corrective pullback, with price reacting cleanly from a 30m FVG. The structure remains constructive, suggesting continuation rather than reversal.
________________________________________
📈 Signal / Analysis
Primary Bias: Bullish while price holds above the M15 pullback low and FVG base
Preferred Setup:
• Entry: 1.3447
• Stop Loss: Below 1.3445
• TP1: 1.3452
• TP2: 1.3458
• TP3: 1.3464 (intraday liquidity / FVG fill)
________________________________________
🎯 ICT & SMC Notes
• Reaction from M30 FVG confirms short-term demand
• No bearish BOS on lower timeframes
• Pullback classified as corrective within bullish intraday flow
________________________________________
🧩 Summary
As long as price holds above the current FVG support, GBPUSD is expected to continue higher toward nearby liquidity targets.
________________________________________
🌍 Fundamental Notes / Sentiment
With easing US inflation pressure and reduced USD momentum, GBPUSD is supported to the upside. As long as the dollar remains capped, pullbacks are likely corrective, favoring bullish continuation rather than reversal.
________________________________________
⚠️ Risk Disclosure
Trading involves substantial risk and may result in capital loss. This analysis is for educational purposes only and does not constitute financial advice. Always apply proper risk management, predefined stop-loss levels, and disciplined position sizing aligned with your trading plan.
Scalping

SUIUSDT 30m LTF BSL Reaction and Pullback Setup📝 Description
BINANCE:SUIUSDT has pushed into a local liquidity high and is reacting below the HTF range high. The current move shows exhaustion after a sharp upside leg, suggesting a corrective pullback rather than continuation.
________________________________________
📈 Signal / Analysis
Primary Bias: Bearish while price holds below the LTF BSL and 30m supply
Preferred Setup:
• Entry: 1.803
• Stop Loss: Above 1.816
• TP1: 1.786
• TP2: 1.778
• TP3: 1.767
________________________________________
🎯 ICT & SMC Notes
• Reaction from LTF BSL
• No valid bullish BOS after last pullback
• Downside liquidity still untouched
________________________________________
🧩 Summary
As long as price remains capped below local highs, a corrective pullback toward lower M30 PD arrays is favored.
________________________________________
🌍 Fundamental Notes / Sentiment
Although Core CPI came in below expectations, the market quickly reversed, showing the USD has not lost meaningful strength. Risk appetite remains weak, keeping SUI biased to the downside in short-term.
________________________________________
⚠️ Risk Disclosure
Trading involves substantial risk and may result in capital loss. This analysis is for educational purposes only and does not constitute financial advice. Always apply proper risk management, predefined stop-loss levels, and disciplined position sizing aligned with your trading plan.

ETHUSDT M15 BPR Rejection and Short-Term Pullback Setup📝 Description
BINANCE:ETHUSDT has pushed back into a prior H1 BPR / liquidity zone after a strong recovery leg. The current move appears corrective, with price reacting near resistance rather than showing clean continuation strength.
________________________________________
📈 Signal / Analysis
Primary Bias: Bearish while price holds below the H1 BPR and recent high
Preferred Setup:
• Entry: 3,141
• Stop Loss: Above 3,148
• TP1: 3,134
• TP2: 3,121
• TP3: 3,093 (lower liquidity)
________________________________________
🎯 ICT & SMC Notes
• Rejection from H1 BPR signals supply presence
• No confirmed bullish BOS after the rally
• Downside liquidity remains unfilled
________________________________________
🧩 Summary
CRYPTOCAP:ETH is showing signs of rejection at resistance. As long as price remains capped below the BPR, a controlled pullback toward lower PD arrays is favored over upside continuation.
________________________________________
🌍 Fundamental Notes / Sentiment
This week’s US macro data supports a stronger USD and higher-for-longer rates, keeping liquidity tight for risk assets. In this environment, Ethereum remains vulnerable to downside, with bearish continuation favored and any short-term rebounds likely corrective rather than trend-changing.
________________________________________
⚠️ Risk Disclosure
Trading involves substantial risk and may result in capital loss. This analysis is for educational purposes only and does not constitute financial advice. Always apply proper risk management, predefined stop-loss levels, and disciplined position sizing aligned with your trading plan.

USDJPY M15 FVG Rejection and Short-Term Bearish Rotation Setup📝 Description
USDJPY on M15 is trading inside a corrective pullback after a recent bullish push. Price has moved into the 15M FVG and is showing rejection from the upper imbalance, suggesting weak acceptance at higher prices. This behavior points to a liquidity-driven pullback rather than continuation.
________________________________________
📈 Signal / Analysis
Primary Bias: Short-term bearish while below 156.80
Short Setup (Preferred):
• Entry (Sell): 156.73
• Stop Loss: Above 156.82
• TP1: 156.63
• TP2: 156.46
• TP3: 156.30 (sell-side liquidity)
________________________________________
🎯 ICT & SMC Notes
• Price rejected from 15M FVG
• Failure to hold premium pricing
• Sell-side liquidity resting below recent lows
________________________________________
🧩 Summary
As long as USDJPY remains capped below the 15M FVG, the higher-probability path is a downside rotation toward 156.46 and 156.30 liquidity. Acceptance above the imbalance invalidates the short idea.
________________________________________
🌍 Fundamental Notes / Sentiment
Short-term moves remain sensitive to US yield fluctuations and BoJ expectations. In the absence of strong USD momentum, technical rejection zones are likely to guide price action.
________________________________________
⚠️ Risk Disclosure
Trading involves substantial risk and may result in capital loss. This analysis is for educational purposes only and does not constitute financial advice. Always apply proper risk management, predefined stop-loss levels, and disciplined position sizing aligned with your trading plan.

#USDJPY , Would you give us a QuickScalp ?📊 Morning Market Brief | London Session Prep
🔎 Instrument Focus: #USDJPY
⚠️ Risk Environment: High
📈 Technical Overview:
We could have a trade on xJPYs by these kinda structure . on EJ nor UJ . both are in watchlist .
🚀 Trading Plan:
• Wait for Momentum around key levels
• LTF ENTRY NEEDED
• Manage risk aggressively, protect capital first
🧠 Stay updated with real time news and macro events, visit 👉 @News_Ash_TheTrader_Bot
#Ash_TheTrader #Forex #EURUSD #MarketInsight #PriceAction #TradingPlan #RiskManagement #LondonSession #Scalping #Futures #NQ #Gold

#EURJPY , Gonna be Nice with us ?📊 Morning Market Brief | London Session Prep
🔎 Instrument Focus: #EURJPY
⚠️ Risk Environment: High
📈 Technical Overview:
By having a Momentum Structure , it could be a nice QuickScalp Setup
🚀 Trading Plan:
• Wait for Momentum around key levels
• LTF ENTRY NEEDED
• Manage risk aggressively, protect capital first
🧠 Stay updated with real time news and macro events, visit 👉 @News_Ash_TheTrader_Bot
#Ash_TheTrader #Forex #EURUSD #MarketInsight #PriceAction #TradingPlan #RiskManagement #LondonSession #Scalping #Futures #NQ #Gold

(GOLD)I SEE ONLY RED AFTER THISGuys Hope You all Doing well
Today i believe this Resistance will help price
to reach to our Daily Goals this is one of the Resistance
must be Claimed Before reach Down to the target All levels
that i mark are technically very calculated or precise .

Why Modern Markets Demand Multi-Dimensional Data Visualization?Dashboard-Driven Analysis: Beyond Traditional Line-Based Indicators
Why Modern Markets Demand Multi-Dimensional Data Visualization
━━━━━━━━━━━━━━━━━━━━━━━━━━━━━━━━━━━━━━━━━━━
📌 THE PROBLEM WITH TRADITIONAL ANALYSIS
For decades, technical analysis has relied primarily on drawing lines on charts — trend lines, moving averages, support/resistance levels. While these tools remain valuable, modern markets present a fundamental challenge:
- Hundreds of interacting variables
- Multiple timeframe correlations
- Volume-price-momentum relationships
- Institutional vs. retail flow dynamics
- Real-time regime changes
Trying to capture this complexity with "two lines crossing" is like trying to understand weather patterns by looking at a single thermometer.
━━━━━━━━━━━━━━━━━━━━━━━━━━━━━━━━━━━━━━━━━━━
🎯 THE SHIFT: FROM LINES TO MATRICES
A new analytical approach is emerging: Dashboard-Driven Analysis — using structured data tables, matrices, and multi-panel information displays to synthesize complex market data into actionable context.
Instead of asking: "Did the line cross?"
We ask: "What does the entire system state tell us?"
Key Principles:
1️⃣ Multi-Factor Synthesis
Rather than isolated signals, dashboards combine:
- Price location (spatial context)
- Volume profile (participation quality)
- Flow dynamics (buyer vs. seller dominance)
- Momentum regime (acceleration/deceleration)
- Statistical deviation (Z-scores, percentiles)
2️⃣ State Classification
Markets exist in distinct "states" or "regimes":
- Trending vs. ranging
- Accumulation vs. distribution
- Climactic vs. exhausted
- High-conviction vs. low-liquidity
Dashboards classify these states explicitly rather than leaving interpretation to guesswork.
3️⃣ Real-Time Context Awareness
Traditional indicators tell you WHAT happened.
Smart dashboards tell you WHERE you are and WHAT it means.
━━━━━━━━━━━━━━━━━━━━━━━━━━━━━━━━━━━━━━━━━━━
📊 PRACTICAL DASHBOARD COMPONENTS
A well-designed analytical dashboard typically includes:
Section 1: Current State Vector
- Direction bias with confidence level
- Price position relative to key levels
- Volume quality assessment
Section 2: Structure Analysis
- Support/resistance matrix
- Level proximity detection
- Breakout/rejection probability
Section 3: Flow Dynamics
- Buy vs. sell volume decomposition
- Delta (net flow) measurement
- Pressure imbalance detection
Section 4: Signal Quality Scoring
- Multi-layer validation system
- Grade-based confidence rating
- Risk/reward context
━━━━━━━━━━━━━━━━━━━━━━━━━━━━━━━━━━━━━━━━━━━
💡 WHY THIS MATTERS
The evolution from line-based to dashboard-based analysis reflects a broader truth:
Markets are systems, not simple patterns.
A dashboard approach helps traders:
✓ Avoid false signals by requiring multi-factor confirmation
✓ Understand context before acting
✓ Recognize regime changes earlier
✓ Make decisions based on synthesis, not isolated triggers
This doesn't mean traditional tools are obsolete — it means they work better when integrated into a comprehensive information framework.
━━━━━━━━━━━━━━━━━━━━━━━━━━━━━━━━━━━━━━━━━━━
⚠️ IMPORTANT NOTES
- No indicator or dashboard can predict the future
- All analytical tools require proper risk management
- Dashboard complexity should serve clarity, not create confusion
- The goal is better decisions, not more information
This educational content presents a conceptual framework for thinking about market analysis in a more systematic way.
━━━━━━━━━━━━━━━━━━━━━━━━━━━━━━━━━━━━━━━━━━━
📚 CONCLUSION
As markets evolve, so must our analytical tools. The shift toward dashboard-driven, multi-dimensional analysis represents not a rejection of traditional methods, but an evolution — synthesizing multiple data streams into coherent, actionable market context.
The question is no longer just "What does the chart show?"
It's "What does the entire market structure tell us?"

HURRY Up I See Wonderful opportunity AwaitsYou Can see clearly the turtle Soup for Bearish in past
What we Show You The Upcoming opportunity
1st it will fill the empty Gray Box below as soon it offer into the
Green Box We Immediately looking for longs .

The Boredom Stage of Trading - Why Most Traders Quit HereGood morning, all, thank you all for coming today.
Today we will be looking into the “ Boredom ” Phase of trading, and why most new traders quit because of it. Lets begin.
What Is the Boredom stage during Trading?
Boredom in trading is the stage where the excitement goes away, but the results have not arrived yet.
You are no longer a beginner filled with hype, joy and excitement.
You are aware of, and understand the basics, you have a strategy, and you know what you should be doing.
Yet progress feels slow , repetitive , and unrewarding .
There are less trades, fewer emotional highs, and long stages of patiently waiting.
This is where trading begins to feel boring , and for many traders, boredom feels like failure, it feels like they are failing since they are not “ doing anything. ”
This phase is not a sign you are doing something wrong it is a sign you are doing something right .
How the Boredom stage Affects Traders
Boredom secretly ruins traders because it does not feel dangerous.
During this period, traders will often:
• Start forcing trades just to feel active or “ alive ” like they are doing something.
• Break rules out of impatience ( breaking their own system )
• Abandon strategies that are working ( same as above )
• Chase excitement instead of probability ( they seek the 100x return )
• Confuse “ no trades ” with “ no progress ” ( If you follow your system and wait, you are making progress )
The market rewards patience, but boredom pushes traders toward action.
This creates losses, frustration, and eventually self-doubt. ( Which no one wants )
Many traders do not fail because they lack knowledge or skill. They fail because they cannot tolerate stillness. ( They psychology weakens when they face boredom. )
Why the stage Phase Occurs
The boredom phase takes place when trading becomes process-driven instead of emotion-driven. ( It becomes mechanical )
Early trading is exciting because:
• Everything feels new
• Wins feel euphoric
• Losses feel catastrophic
• The market feels fast and you feel uncertain
• You are eager to learn more
As you improve, your trading becomes:
• More selective and tight
• More rule-based and systematic like
• Slower and quieter ( calm )
• Less emotionally stimulating
This shift removes chaos, but it also removes excitement.
The market hasn’t changed.
You have.
And most people mistake this emotional flatline as a sign that something is missing.
( This is where “ The market rewards patience ” comes in. The market rewards those who wait. )
How to Overcome the Boredom stage
The key to overcoming boredom is understanding that trading is not meant to entertain you. ( It is just like a 9-5, you must follow rules, a system. Just in your own routine. )
Practical ways to handle this phase:
• Reduce screen time once your plan is complete. ( Do not over trade )
• Focus on execution quality, not trade quantity. ( Quality over quantity )
• Track rule-following instead of PnL. ( Did you follow your system? )
• Journal boredom-triggered decisions. ( Losses from impatience? )
• Accept that waiting is part of the job. ( Strengthen your mind by waiting. )
Professionals do not trade more and when they are bored, they trade less.
The goal is not to feel engaged and hyped up.
The goal is to remain consistent and disciplined.
Why the Boredom stage Is a Filter, not a Problem
The boredom stage exists to separate traders who want excitement from traders who want results. ( Splits Gamblers from Real Traders )
Most people quit and give up here because:
• There is no longer any dopamine .
• Progress feels slow, painful or invisible.
• Social media makes others look “ active ” when it is actually not.
• Patience feels unproductive since the mind is sitting “ idle .”
But this stage is where real traders are built.
If you can:
• Follow rules without excitement. ( Follow your system )
• Sit through days with no trades. ( Accept the process of waiting )
• Trust your edge without constant validation. ( Ensure to backtest to prove this. )
• Stay disciplined when nothing happens. ( Do not give in to FOMO. )
You have already passed a major psychological barrier.
The boredom phase is not a dead end it is a gateway that sits at the end of a long run.
Those who quit here were never meant to last.
Those who stay quietly move closer to consistency and mental freedom.
Final Thoughts
Every profitable trader has survived the boredom phase.
Most failed traders quit during it because of weak psychology.
If trading feels boring, repetitive, and uneventful, that is good.
That means emotions are leaving and structure is taking its place.
The market does not reward excitement.
It rewards endurance, patience, discipline, consistency and proper risk management.

BTC 30m Partial FVG Tap, Lower Imbalance Fill Setup📝 Description
BTC on M30 just made a shallow tap into the upper FVG, followed by immediate hesitation. With only a partial fill completed, it’s reasonable to expect price to seek the lower FVG for a more complete imbalance fill before any meaningful continuation.
________________________________________
📈 Signal / Analysis
Primary Bias: Short-term pullback while below 89,000–89,100
Short Setup (Reactive):
• Entry (Sell): 88,800
• Stop Loss: Above 89,00
• TP1: 88,600
• TP2: 88,340
• TP3: 87,915 (30M FVG midline)
________________________________________
🎯 ICT & SMC Notes
• Price tapped 30M FVG in premium
• HTF FVG H4/H1 overhead caps upside
• No clean CHOCH + BOS for bullish continuation
• RSI flattening → momentum exhaustion
• Liquidity draw sitting below recent lows
________________________________________
🧩 Summary
This looks like impulse and pause then retrace. As long as BTC stays below 89k, odds favor a pullback to 88.4k and 87.9k. Acceptance above premium invalidates the short and opens room higher.
________________________________________
🌍 Fundamental Notes / Sentiment
With markets still headline-sensitive and liquidity tight, quick rotations around key levels are favored. Trade the reaction at FVGs and keep risk tight.
________________________________________
⚠️ Risk Disclosure
Trading involves substantial risk and may result in capital loss. This analysis is for educational purposes only and does not constitute financial advice. Always apply proper risk management, predefined stop-loss levels, and disciplined position sizing aligned with your trading plan.

EUR/USD: a good price level to buy on the 1-hour timeframe.EUR/USD:
Buy: 1.1771
Target: 1.1866
Stoploss: 1.1695
R/R Ratio = 1.24

BTC / USD Scalp Short Idea (Order Flow)Scalp Short Idea
Bias: Short (scalp)
Context:
Price is trading into a local premium / supply zone within a bearish intraday order flow. Buy-side liquidity has been taken, and price is now showing weak bullish follow-through, suggesting potential distribution.
internal liquidity (FVG)

267 handle move bullish - NQ
Lower 1D Shadow quadrant exactly respected, which is a strong bullish sign according to ICT
1D Breaker MT (midpoint or mean-threshold) exactly respected with the candle bodies, which is also a strong bullish sign according to ICT
The event horizon - which is the midpoint of 2 new-day- or new-week-opening-gaps align exactly with the 1D volume imbalance CE (consequent encroachment or midpoint)
Strong bullish market-structure and the movement aligns with seasonal tendencies as well

AUDCAD | Short ideaLooking for AUDCAD to continue it's downtrend for the week.
Next Pio where I am interested in for looking into short positions is the Asia high.
Looking for a test and a nice close under this level.
If I see this I am planning on placing stop well above the wick that candle would have and a target somewhere above the PDL.
I have placed a random stop loss for now just so you could see what I would be looking for RR wise.
If I don't see any rejection I don't enter and will look for setups on other pairs.
Stay safe out there and do your own due diligence, this is not investment advise!

Gold: Bulls taking a breather? Watch for a pullback.This looks like a bull trap. If price can't break through this red box, I'm expecting a pullback to 4,300 to grab some liquidity.
- Resistance: 4,330 - 4,340 (Red Box)
- Support Target: 4,303.74

Why Consistency Beats Talent in TradingWelcome all to another post! In today's post we will review the difference between Talented trading and consistent trading.
Why Consistency Beats Talent in Trading
Many new traders usually enter trading believing that success belongs to the most intelligent individuals, the most analytical, or the most “naturally gifted.” In any field.
When in reality, the market only rewards something that is far less glamorous, and that is.. consistency.
Talent can help you understand charts faster and/or grasp concepts a lot quicker, but it is consistency that determines and shows whether you survive long enough to become profitable and make a positive return.
Talent Creates Potential | Consistency Creates Results
Talent shows up early, like in the first week or two.
You might spot patterns instantly, win a few trades, or feel like trading “just makes sense” to you.
Consistency shows up later and it’s far rarer.
The market does not care how smart you are.
It only responds to:
- How often you follow your rules and system.
- How well you manage risk ( or gamble it. )
- How disciplined you are under pressure and stress
- A talented trader who trades emotionally will eventually lose, ( always lose. )
- A consistent trader with average skills can compound them steadily over time.
Why Talented Traders Often Struggle
Ironically, talent can be a disadvantage ( keep on reading )
Talented traders often:
- Rely on intuition instead of their own rules or the games rules ( or common sense. )
- Take trades outside their plan ( like above, not following their rules. )
- Increase risk after a few wins ( again, not following RM rules. )
- Ignore data because “ they feel confident ”
This leads to inconsistency big wins followed by bigger losses. ( Gambling )
The market eventually punishes anyone who treats probability like certainty.
Consistency Turns Probability into an Edge
Trading is not about being right it’s about commencing the same process over and over.
Consistency means:
- Taking only the setups you’ve defined. (Defined what A+ is)
- Risking the same amount per trade. (Risk Management)
- Accepting losses without deviation. (Moving on after a loss)
- Following your plan even after losing streaks. (Maintaining consistency)
One trade means nothing.
A hundred trades executed the same way reveal your edge.
Consistency allows probability to work for you, not against you.
The Market Rewards Discipline, Not Brilliance
The best traders in the world are not constantly trying to outsmart the market.
They:
- Trade fewer setups
- Keep their approach simple
- Protect capital first
- Let time and repetition do the work
- They understand that survival is the first goal.
- You can’t compound an account you’ve blown.
Consistency Is Boring and That’s the Point
Consistencty lacks excitement.
There are no adrenaline rushes, no heroic trades, no all-in moments.
Just repetition, patience, and restraint. This is why most people fail.
The market filters out those who chase excitement and rewards those who treat trading like a business, not entertainment.
Talent Without Consistency Is Temporary
Many traders experience early success.
Very few maintain it.
Short-term success often comes from:
- Favorable market conditions
- Random luck
- Overconfidence
Long-term success comes from:
- Process
- Risk control
- Emotional discipline
Consistency is what turns a good month into a sustainable career.
How to Build Consistency as a Trader
Consistency is a skill not a personality trait.
You build it by:
- Defining clear trading rules
- Using fixed risk per trade
- Journaling every trade honestly
- Reviewing performance regularly
- Trading less, not more
Your goal isn’t to be impressive.
Your goal is to be repeatable.
Final Thoughts
Talent may get you interested in trading.
Consistency keeps you in the game.
In a profession driven by uncertainty, the trader who shows up the same way every day will always outperform the one chasing brilliance.
In trading, consistency doesn’t just beat talent > it replaces it.
Thank you all so much for reading, I hope everyone enjoys it and that it benefits you all!
Let me know in the comments below if you have any questions or requests.
Range Base Day Trading Strategy🎯 Daily Target: $100–$200 with Proper Risk Management
Many traders lose money not because of bad indicators, but due to poor structure and emotional trading.
Below is a simple but powerful range-based strategy I personally recommend for disciplined day trading 👇
💰 Capital Requirement
Minimum recommended capital: $1,000 or more
🧮 Capital Distribution (Very Important)
Divide your capital into 3 parts:
33% → Active Trading
33% → DCA (Backup Entries)
34% → Emergency / Safety Fund
👉 This protects you from panic and over-trading.
---
⏱️ Timeframes
Use 5-minute (5M) or 15-minute (15M) charts
Trade only clear trending markets
Avoid sideways & choppy conditions
---
📐 Range Setup
Identify three key zones:
🔽 Lower Range (Support)
➖ Mid Range (Decision Zone)
🔼 Upper Range (Resistance)
---
🔁 Trade Rules by Zone
✅ Long Setup
Price comes from lower range
Shows reversal / support
Target → Mid range
❌ Avoid long at a higher range
---
✅ Short Setup
* Price comes from upper range
* Shows rejection
* Target → Mid range
❌ Avoid short at lower range
---
📦 Smart Entry (Scaling Method)
Example: Plan to trade 10 SOL
1️⃣ First entry → 3 SOL
2️⃣ Wait 5–10 minutes
3️⃣ If price moves in your favor → add remaining 7 SOL
✅ Lower risk
✅ Better average price
❌ No full entry at once
---
🔄 If Market Moves Against You (DCA Rule)
Stay calm
Wait for stronger support
Use DCA capital only
Example:
Lower range = $130
DCA zone = ~$120
👉 Improves average without panic.
---
🎯 Profit-Taking
When price reaches initial zone:
Book 50% profit
Hold remaining position toward:
Mid range or next resistance
---
🚫 Strict Rules
❌ No revenge trading
❌ No over-trading
❌ No chasing entries
✅ Max 3–4 trades per day
---
🧠 Final Reminder
This strategy is not for gambling.
It is designed for:
* Consistency
* Capital protection
* Mental peace
* Sustainable daily income
📌 *Discipline > Indicators*
— Earning with Dr. Hafiz

BTC/USD – Band Rejection + Gap Squeeze Play (Textbook Execution)Caught a clean 30m bullish band rejection on BTC/USD, aligned with a textbook gap-up squeeze setup. Price gapped above the lower Bollinger Band after a clear downtrend, forming a strong engulfing candle. Entry triggered on break of the rejection candle high at 89,276.
Trade Highlights:
- Entry: 89,276 (2 lots)
- Target 1: Midline (9 EMA) hit at 89,372 (+0.11%)
- Target 2: Upper Band hit at 89,672 (+0.44%)
- Stop: 89,044 (below rejection low)
- Result: Full 1:1 RR achieved on both lots
Setup Confluence:
- Lower band rejection with hammer
- Gap-up ≥ 1% with strong close
- X/Y band stretch> 1.6 confirms squeeze
- No opposite rejection before midline
Takeaway: A+ setup with high-probability structure and mechanical execution. Kill fast, ride smart.

BTCFDUSD:Support and Resistance Levels Indicate Potential Move
Title:
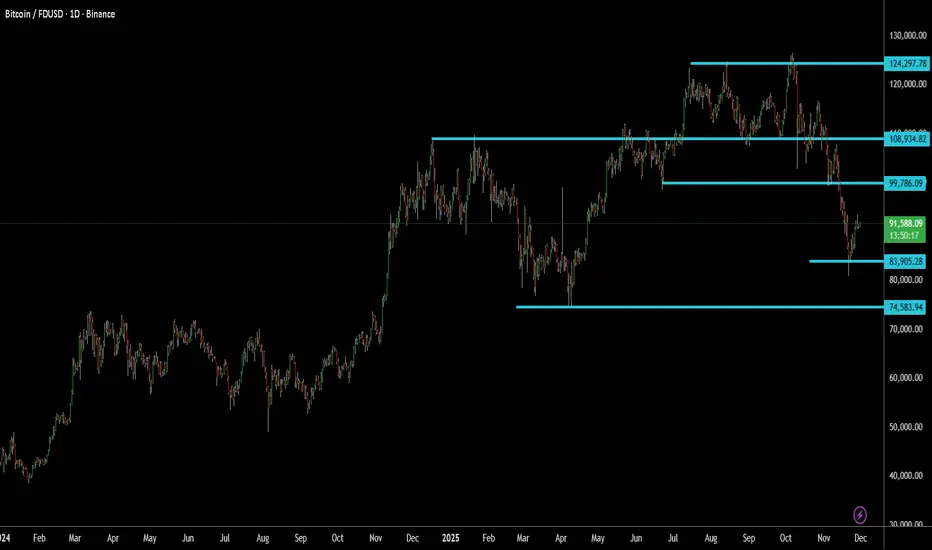
BTCFDUSD: Key Support and Resistance Levels Indicate Potential Moves
Greetings, Traders!
🌟 Hello everyone,
As we analyze BTCFDUSD, we observe critical support and resistance levels that could shape the upcoming price action. Understanding these levels can help traders navigate the market effectively.
BINANCE:BTCFDUSD
Key Observations:
- The strongest support level is identified at 74583 , with an immediate support level at 83905 . Currently, the price stands at 91635 , suggesting a potential pullback towards the immediate support before any upward movement.
- On the higher side, the initial resistance is at 99786 . If BTCFTRUSDT breaks through this level, the next target would be 108934, followed by a potential high of 124297 .
- Traders should monitor these key levels closely to identify optimal entry and exit points, as well as potential trend shifts.
Technical Analysis:
Technical indicators and price patterns indicate that BTCFTRUSDT may consolidate around the immediate support level of 83905 before attempting to move higher. The upward trajectory beyond 99786 could lead to significant gains, provided the price maintains bullish momentum.
Fundamental Factors:
While technical levels are crucial, it's also important to consider broader market sentiment, news, and events that could impact BTCFTRUSDT. Keeping an eye on major developments in the crypto space will help in making informed trading decisions.
Trading Strategies:
Given the current price levels, traders might consider short-term strategies such as buying near the immediate support at 83905 and holding for a potential breakout above 99786. Risk management, including setting appropriate stop-loss levels, is essential to mitigate potential downsides.
In Conclusion:
BTCFTRUSDT's price action is guided by key support and resistance levels. Traders should remain attentive to these levels and adapt their strategies as the market evolves. Patience and vigilance will be key in navigating the potential moves ahead.
Engage with Us:
🟢 If you find this analysis insightful, please give it a LIKE.
🟡 Don't forget to FOLLOW for more updates.
🔵 SHARE with fellow traders who might benefit from this information.
🔴 Feel free to COMMENT with your thoughts and insights!
Your active participation enriches our trading community, fostering knowledge exchange and collective growth. Share your feedback and ideas in the comments below or by boosting this post.
Looking forward to connecting with you in the next post.
Happy trading!
NVDA — WEEK 49 TREND REPORT | 12/03/2025NVDA — WEEK 49 TREND REPORT | 12/03/2025
Ticker: NASDAQ:NVDA
Timeframe: WEEKLY
This is a reactive structural classification of NVIDIA based on the weekly chart as of this timestamp. Price conditions are evaluated as they stand — nothing here is predictive or forward-assumptive.
⸻
1) Current Trend Condition [ Numbers to Watch ]
• Current Price @ 180.26$
• Trend Duration: +31 weeks (Bullish)
• Trend Reversal Level (Bullish): 190.87$
• Trend Reversal Level (Bearish Confirmation): 176.52$
• Pullback Support : 167.75$
• Correction Support : 132.86$
⸻
2) Structure Health
• Retracement Phase:
Pullback (approaching 78.6%)
• Position Status:
Caution (interacting with structural layers)
⸻
3) Temperature :
Cooling Phase
⸻
4) Momentum :
Coiling
⸻
5) Market Sentiment
Bullish
⸻
Author’s Note
This analysis is fully reactive, not predictive. Market conditions, trend structure, and behavior are classified as they appear in real time. The objective is to identify where directional shifts first occurred, where structural integrity remains intact, and where it would begin to weaken if key levels were breached.
Predictive analysis projects outcomes that do not exist yet. Without price confirmation, prediction is built on baseless assumptions. This framework avoids that entirely by responding only to verified structural changes and live conditions.
The levels shown simply identify where the current trend structure first shifted and where it would begin to lose integrity if breached. Recognizing these boundaries allows for clearer interpretation of market behavior without relying on forward guarantees, speculative projections, or unsupported assumptions.
⸻
Methodology Overview
This classification framework evaluates directional conditions using internal trend-interpretation logic that references price behavior relative to its structural layers. These relationships are used to identify when price movement aligns with the framework’s criteria for directional phases, transition points, or regime shifts. Visual elements or structural labels reflect these internal interpretations, rather than explicit trading signals or preset indicator crossovers. This framework is observational only and does not imply future outcomes.

SOFI — WEEK 49 TREND REPORT | 12/03/2025SOFI — WEEK 49 TREND REPORT | 12/03/2025
Ticker: NASDAQ:SOFI
Timeframe: WEEKLY
This is a reactive structural classification of SOFI based on the weekly chart as of this timestamp. Price conditions are evaluated as they stand — nothing here is predictive or forward-assumptive.
⸻
1) Current Trend Condition [ Numbers to Watch]
• Current Price @ 29.73$
• Trend Duration: +32 weeks (Bullish)
• Trend Reversal Level (Bearish): 28.13$
• Trend Reversal Level (Bearish Confirmation): 23.30$
• Pullback Support : 26.63$
• Correction Support : 21.85$
⸻
2) Structure Health
• Retracement Phase:
Uptrend (operating above 78.6%)
• Position Status:
Healthy (price above both structural layers)
⸻
3) Temperature :
Warming Phase
⸻
4) Momentum :
Bullish
⸻
5) Market Sentiment
Bullish
⸻
Author’s Note
This analysis is fully reactive, not predictive. Market conditions, trend structure, and behavior are classified as they appear in real time. The objective is to identify where directional shifts first occurred, where structural integrity remains intact, and where it would begin to weaken if key levels were breached.
Predictive analysis projects outcomes that do not exist yet. Without price confirmation, prediction is built on baseless assumptions. This framework avoids that entirely by responding only to verified structural changes and live conditions.
The levels shown simply identify where the current trend structure first shifted and where it would begin to lose integrity if breached. Recognizing these boundaries allows for clearer interpretation of market behavior without relying on forward guarantees, speculative projections, or unsupported assumptions.
⸻
Methodology Overview
This classification framework evaluates directional conditions using internal trend-interpretation logic that references price behavior relative to its structural layers. These relationships are used to identify when price movement aligns with the framework’s criteria for directional phases, transition points, or regime shifts. Visual elements or structural labels reflect these internal interpretations, rather than explicit trading signals or preset indicator crossovers. This framework is observational only and does not imply future outcomes.

EURJPY SCALP Eurjpy looking to give us a clear simple buy structure towards the up side and will use a ( BUY STOP )
