Gold (XAUUSD) 30Min – Short-Term Scalping SetupBearish Divergence & Resistance Rejection
Price is reaching the strong resistance zone (2936 - 2940), near the ATH (2942.710).
RSI shows bearish divergence, signaling potential weakness in momentum.
A rejection from this resistance zone could trigger a short-term pullback.
Possible Short Entry : Upon confirmation of rejection (e.g., bearish engulfing, wick rejections).
Short-Term Targets (TPs):
First TP: 2,928.762
Second TP: 2,921.587
Potential Next Moves:
Short-Term Correction – A rejection from 2936 - 2940 could lead to a brief pullback toward support levels (2928 - 2921).
Bullish Continuation – If price holds at support, we could see a new impulsive move toward the ATH (2942.710) and beyond.
📉 Scalping Play: Short from resistance with TPs at 2928 & 2921.
📈 Long Opportunity: If resistance breaks, look for confirmation of bullish continuation.
Scalping

Sharing a strategyFor my scalping or Intraday trade, I created this pine script combining various indicator (namely the famous Alphatrend by @KivancOzbilgic, Previous Day Close and 52WeeksHigh/Low) into one indicator.
If price goes above the PDC and Alphatrend is a buy then I will make quick long trade. If price goes below the PDC and Alphatrend is a sell then I will make quick short trade. I added a percentage based on PDC to give me where I need to put my stoploss. Not really important as I always have proper risk reward ratio but it comes handy most of the time.

Why you should choose your trading period carefullyFirst, let's look at the four most important trading sessions. The Forex and stock market is divided into different trading sessions, which are based on the opening hours of the main financial centers:
Session Opening Hours (UTC) Major Markets:
-> Sydney session 22:00 – 07:00 Australia, New Zealand
-> Tokyo session 00:00 – 09:00 Japan, China, Singapore
-> London session 08:00 – 17:00 UK, Europe
-> New York session 1:00 p.m. – 10:00 p.m. USA, Canada
Note: Times vary slightly depending on summer or winter time.
Why are trading sessions important?
-> Volatility & Liquidity
Depending on the session, there are different market movements.
High liquidity → tight spreads and better order execution.
Low liquidity → greater slippage and wider spreads.
-> Active currencies & markets
During the Tokyo session, JPY and AUD pairs are particularly active.
During the London session, EUR and GBP pairs are the most volatile.
During the New York session, USD pairs and stock markets moved the most.
Opportunities & risks during overlapping times:
The overlaps between sessions are the most volatile times because several major markets are active at the same time.
1. London-New York Overlap (13:00 – 17:00 UTC)
→ Highest volatility
Why?
The world's two largest financial centers operate at the same time.
Opportunities:
Big price moves → good for breakout traders and scalping.
High liquidity → tight spreads, fast order execution.
Risks:
Extreme volatility → rapid price changes can trigger stop losses.
News (e.g. US jobs data) can cause sudden movements.
Practical example:
A trader is watching EUR/USD and sees strong resistance at 1.1000.
US inflation data will be released at 13:30 UTC.
If the data is better than expected → USD strengthens, EUR/USD falls.
If the data is worse → USD weakens, EUR/USD rises.
Within a few minutes the price can fluctuate by 50-100 pips.
→ Strategy: News traders rely on quick movements, while conservative traders extend stop losses or pause during this time.
2. Tokyo-London Overlap (08:00 – 09:00 UTC)
→ Medium volatility
Why?
London opens while Tokyo is still active.
Opportunities:
JPY pairs (e.g. GBP/JPY) are moving strongly.
Breakouts through the European opening.
Risks:
Sudden changes in direction as European traders often have a different market opinion than Asian ones.
Practical example:
A scalper is trading GBP/JPY in a narrow range of 185.00 – 185.20 during the Tokyo session.
At 08:00 UTC London opens with GBP/JPY breaking above 185.50.
Within 30 minutes the price rises to 186.00 as European traders buy GBP.
If you recognize the breakout early, you can quickly take 50-100 pips.
→ Strategy: Scalpers rely on quick entries and take profits before volatility subsides.
3. Sydney-Tokyo Overlap (00:00 – 07:00 UTC)
→ Low volatility
Why?
Mainly the Asian market is active.
Opportunities:
Less volatility → good for range trading.
Cheaper spreads for AUD and NZD pairs.
Risks:
Little liquidity → Slippage may occur.
Strong moves are rare, except for major news from Japan or Australia.
Practical example:
A swing trader notes that AUD/USD has been fluctuating between 0.6500 and 0.6550 for days.
During the Sydney-Tokyo session the price mostly stays in this range.
The trader places a sell limit order at 0.6550 and a buy limit order at 0.6500.
Since there is little volatility, it can be profitable with multiple small trades.
→ Strategy: Range trading is ideal because no major breakouts are expected.
Conclusion:
Each trading session has its own characteristics, opportunities and risks.
The crossovers are the most volatile times - good for day traders, but risky for inexperienced traders. Anyone who understands the market mechanisms can take targeted action at the right time. The strategies mentioned above are simply derivations from the advantages and disadvantages of the respective sessions. Of course, a well-founded strategy concept requires much more.

1000BONKUSDT: Ready for a Breakout?
🔥 **1000BONKUSDT.P** has been consolidating under resistance for a long time, accumulating liquidity. The price has tested **0.017630 USDT** multiple times, and whales are clearly building positions. The question is: will we see a breakout, or will there be another dip before the pump?
---
🔑 **Key Levels:**
**Support:**
**0.017630 USDT** — Major demand zone. A breakdown below this level could trigger further declines.
**0.016800 USDT** — Last defense for bulls to maintain the uptrend.
**Resistance:**
**0.018481 USDT** — Initial liquidity zone, where a local rejection may occur.
**0.019000 USDT** — Key level that, if broken, opens the way to 0.020 USDT.
**0.024379 USDT** — Ultimate target where large players might start taking profits.
---
🚀 **Trading Strategy:**
**Entry Points:**
- Long upon breakout of **0.018481 USDT**, confirmed by volume increase.
- Alternative entry on a retest of **0.017630 USDT**, provided support volumes increase.
**Stop-Loss:**
- Below **0.016800 USDT** to avoid liquidity grabs before the potential move up.
**Take-Profit Targets:**
**0.019000 USDT** — Partial profit-taking, securing position.
**0.020000 USDT** — Major target if momentum follows through.
**0.024379 USDT** — Ideal scenario if a strong impulse move occurs.
---
📈 **Market Analysis:**
Price has been consolidating near resistance, suggesting an impending breakout.
Large orders in the order book indicate whale activity.
Volume is starting to pick up, signaling a potential phase transition.
---
💡 **Conclusion:**
1000BONKUSDT.P is at a decisive moment. A confirmed breakout above **0.018481 USDT** could lead to a strong bullish move. However, if another fakeout and dump happen, it's time to reassess. What’s your take—ready for the pump? 🚀💬

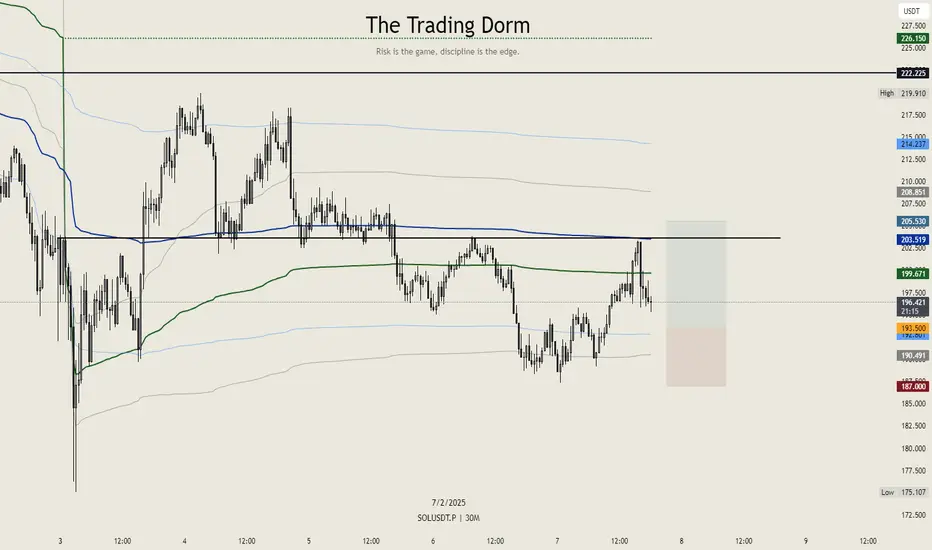
Solana $SOL Setup – Keeping it CleanSolana looks strong, so it’s time for a trade. The entry is placed at $193.50, with a stop-loss at $187 to keep risk in check. The target is set at $205.53, aligning perfectly with the monthly and weekly VWAP VALs.
This setup offers a 1:1.85 risk-to-reward ratio—nothing crazy, just a clean, structured trade. No moonboy fantasy for now, just following the price action and executing accordingly.
TOSHIUSD demand zone (0.00070) waiting for bullish confirmation 🚀 TOSH/USD Analysis: Fresh Demand Zone on M15 – Awaiting Bullish Confirmation
🔍 Why is this setup interesting?
✅ Fresh Demand Zone created on M15 at 0.00070 → Potential strong buy pressure 📊
✅ Trade not confirmed yet → Waiting for a bullish signal h1📈
✅ Confluence with Price Action and Market Structure 💹
📊 Key Levels & Scenarios:
🔵 Demand Zone (daily Support): 0.00070
🟢 Potential Confirmation: Wick rejection + Bullish close
🟢 Target Levels: 🎯 ATH
🛠 Supply & Demand Strategy Applied:
Fresh Demand Zone → Strong bounce potential ✅
Waiting for bullish confirmation (Engulfing candle, wick rejection, high volume) 📉
Optimized Risk/Reward Ratio: 1:3 🎯
🔥 Follow me for more live market analysis

short btcusd for an scalp with 1:2 R/Rdue to leg 1=leg 2 theory you can see that btc is 60% in favor of a short fast scalp in 15m timeframe

XAU/USD 4H Analysis: Bullish Momentum Towards $2,780?📊 XAU/USD 4H Chart Analysis – Bullish Momentum 🚀💰
📌 Key Observations:
🔹 Current Price: $2,754.16 (+0.19%)
🔹 Support Zone: $2,740 - $2,750 (Previous resistance turned support ✅)
🔹 Resistance Zone: $2,780 (Next potential target 🎯)
🔹 200 EMA: $2,687.43 (Price is above = Bullish signal 📈)
🔹 Breakout Confirmation: Price has broken past a key level and might retest before moving higher 🔄📊
📉 Potential Scenarios:
✅ Bullish Case: If price holds above $2,750, we could see a rally towards $2,780+ 🚀
❌ Bearish Case: If price drops below $2,740, we might see a correction back to $2,720 ⚠️
🔥 Conclusion:
Gold is showing strong bullish momentum and may continue its uptrend towards $2,780+ if it sustains above the breakout level! Keep an eye on support at $2,750 for confirmation. 👀💎
Would you like further indicators or a different timeframe analysis? ⏳📊

GBPJPY 30min TF Price action analysisHello Traders, as explained on the chart, this is a prime setup for me with a clean range to the left, 45-50 pip tradable range and a break and close below a key level with bearish volume accumulating. Great R:R opportunity!

Expected Long at EurusdMy chwrt analysis and Trend analysis say that Eurusd again push him upside and test the high level again to change direction from bearish to bullish.
Let us hope it finds his way.
I m bullish into it.

Scalp Like a Pro: 5-Minute Trades for Big Wins in Micro-TradingMorning Trading Fam
I'm sharing how I use just price action and candlesticks for my scalping strategy. We'll look at where to enter and exit trades super fast. Perfect for beginners or to refine your skills. Let's get into it with our TradingView setups. Like, Boost, Follow and Share is much appreciated.
Kris/Mindbloome Exchange
Trade What You See

Short Bitcoin Now! Perfect entry for a short on this BTC trade.
Not financial advice.
This is what I am trading per this bearish trendline pre-Trump week.
You won’t be disappointed

From Novice to Scalping Master: The Art of Reading CandlesticksMastering Scalping Trading Through Candlestick Patterns
In the realm of financial markets, scalping trading has emerged as a popular strategy for many investors seeking to capitalize on short-term price movements. Differing from long-term investment approaches, scalping entails making quick trades based on small price fluctuations, often holding positions for mere minutes or seconds. To succeed in this fast-paced environment, traders must hone their analytical skills and mastery of various tools—among which candlestick patterns are paramount. Understanding these patterns can provide traders with insights into market sentiment and potential price reversals, proving especially beneficial in the context of scalping. This essay delves into the intricate world of candlestick patterns, categorizing them into bearish and bullish formations, and examining some of the most significant patterns that traders should master.
The Foundation of Candlestick Patterns
Candlestick charts, originating from Japanese rice traders in the 18th century, have evolved into a universal tool for market analysis. Each candlestick provides a visual representation of price movement within a specific time frame, encapsulating opening, closing, high, and low prices. By analyzing these candlesticks, traders can infer market sentiment and potentially anticipate future movements. A comprehensive understanding of bullish and bearish candlestick patterns is critical for any trader seeking success in scalping.
Bearish Candlestick Patterns
Bearish candlestick patterns indicate a potential reversal of an upward trend, signaling that prices may decline in the near future. Among the most notable bearish patterns is the Three Black Crows, characterized by three consecutive long-bodied candlesticks, each opening within the previous body and closing lower. This pattern suggests a strong downward momentum and a high likelihood of further declines.
Another prominent pattern is the Bearish Engulfing pattern, wherein a small bullish candle is followed by a larger bearish candle that completely engulfs the previous one. This stark contrast denotes a shift in control from buyers to sellers and serves as a powerful bearish signal. The Three Inside Down pattern, consisting of a bullish candle followed by a smaller bearish candle within it, and concluding with a bearish candle that closes below the first candle’s low, further exemplifies a market reversal.
Bearish Meeting Lines represent another vital bearish pattern, occurring when a bullish candle is followed by a bearish candle that opens above the previous candle’s close but closes at or near a similar price level. This pattern indicates hesitation among buyers and can serve as a cue for sellers to enter the market.
Bullish Candlestick Patterns
Conversely, bullish candlestick patterns suggest potential upward reversals, signifying that prices may rise after a downtrend. The Three White Soldiers pattern consists of three consecutive long-bodied bullish candles, each opening within the previous body and closing higher. This pattern is indicative of strong bullish momentum and may signal a significant upward trend.
The Hammer is a fundamental bullish pattern characterized by a small body and a long lower shadow, occurring after a downtrend. This candlestick shape indicates that buyers have stepped in to support the price, often suggesting the potential for a reversal. Similarly, the Bullish Engulfing pattern features a small bearish candle followed by a larger bullish candle that engulfs it, signaling a shift in control from sellers to buyers.
The Three Inside Up pattern begins with a bearish candle, followed by a smaller bullish candle within, and concludes with a bullish candle closing above the first candle’s high. It can signal the start of an upward trend. Meanwhile, the Bullish Breakaway indicates a transitioning phase where significant bullish momentum begins after consolidation.
Complex Patterns for Intricate Analysis
Beyond the primary patterns are more nuanced formations that warrant attention. The Advance Block and the Deliberation are sophisticated patterns that suggest market indecision, signaling possible directional changes. The Stick Sandwich, which features a bearish candle flanked by two bullish candles, conveys market uncertainty that can lead to bullish reversals.
The Concealing Baby Swallow offers a blend of complex sentiments. This pattern arises when a small bullish candle appears in between two larger bearish candles, indicating that buyers are beginning to gain strength against the prevailing trend. Moreover, the Matching High and Matching Low patterns can signify potential reversal points in the market by indicating that prices are struggling to maintain upward or downward momentum.
The Importance of Risk Management
While mastery of candlestick patterns is indispensable, scalpers must also emphasize risk management. The inherent volatility and rapid nature of scalping necessitate a disciplined approach to trading. Utilizing stop-loss orders, position sizing, and adhering to a trading plan are essential practices that can safeguard traders from significant losses.
Conclusion
In conclusion, mastering scalping trading requires a comprehensive understanding of various candlestick patterns. From bullish formations such as the Three White Soldiers and Bullish Engulfing to bearish patterns like the Three Black Crows and the Bearish Engulfing, the ability to read these signals can significantly enhance a trader's effectiveness in the highly competitive realm of scalping. Additionally, by integrating sound risk management strategies, traders can navigate the complexities of market fluctuations with greater confidence and proficiency. The combination of analytical skill, experience, and strategy within the framework of candlestick analysis positions traders to thrive in the dynamic world of financial markets.

#xauusd CPI week price range Gold tapping 2698 on NFP day was the perfection of KRI +Fib technique.
Bull is still in control with the intraday support of 2680 targeting 2.618 extension which is 2755/66 zone.
A break below intraday support 2680, short scalp targeting 2640/45, which is pre-jolts level. Bear will take over if it breaks below 2640/45 targeting 2588/92

XRP easy target of $3.73/80 will be real soon#XRPUSD H4 timeframe:
KRI made new high in Nov 24
By Dec 24, it hit extension 2.618 and broke this extension on the next day
I believe Jan 24 2025 or Feb 1 2025, XRP will reach 4.618 extension and that is $3.78

#XRP easy target is coming soonBITSTAMP:XRPUSD H4 chart using KRI technique, we can see it broke 2.618 easily. When it does that, the next stop will be 4.618extension which is $3.78
Gotta have this coin in your bad guys

#HBAR easy target coming soon.I had talked about #HBAR couple years ago when price was couple of pennies.
Looking at H4 chart for COINBASE:HBARUSD with same KRI technique, 1.272 extension will be .46 cents and 1.618 extension will be .55 cents with the support at .23 cents
There are lot of positive news for HBAR lately so jump on the wagon before it moons.
Easy TP: .46 and .55 cents with support .23 cents

#gold target before NFPShort term bullish for #xauusd since December 30. Using KRI strategy, fib extension has reached 1.272 which is 2677. This week has also been bullish so I do expect gold to tap 1.618 extension which is gonna be 2698 before or during NFP tomorrow.
NPF strategy is very simple; fade the initial move after NFP data releases.
Friday range would be: resistance 2698 and support 2640 "buy at support and sell at resistance with tight SL"

KOMA/USDT Quick Scalp Long On DumpOn this Small Market Correction. We utilising the opportunity to open a small long scalp on meme coin. Let's Try to Print This.

MORPHO/USDT Ascending Trendline Support and Long Retest Setup This 4-hour chart for MORPHO/USDT highlights a potential long setup at a critical zone. The price action shows a consistent upward trajectory, supported by an ascending trendline. The recent pullback respects a key horizontal support zone around $3.25-$3.05, aligned with previous resistance turned support.
The setup suggests entering a long position at the current retest level. The risk is managed with a stop loss below the trendline and the support zone at $2.95, ensuring protection against invalidation. The target is bigger, offering an attractive risk-reward ratio.
While the structure remains bullish, caution is advised due to market volatility and potential downside pressure if the support zone breaks. Monitoring price action near the trendline is essential.
Also always make sure to book profit on every 10% of the movement and move SL to Entry for a safe ride and keep reaping more profits without any lose

Quick Scalp with BTCBTC bounces off of a major resistance, where whenever it had dipped into previously, had resulted in a bounce to 98600.

Bullish XRP: Adaptive RSI & Block Support Fuel Upswing PotentialCOINBASE:XRPUSD is showing promising signs of a potential upswing, driven by a bullish flip in the Adaptive RSI on the 15-minute chart, reinforced by strong order block support above $2 and confluence from other technical indicators.
Technical Analysis:
Adaptive RSI (15-Minute): The Adaptive RSI has recently transitioned from bearish to bullish on the 15-minute chart, indicating increasing buying pressure and a potential shift in momentum. This adaptive version of the traditional RSI is designed to adjust to changing market conditions, making it a potentially more reliable indicator of momentum shifts.
ICT Killzones (Worldwide Markets): The ICT Killzones, analyzed on the worldwide market timeframe, suggest that XRPUSD may be approaching an area where volume could increase, potentially leading to a rapid move. This aligns with the bullish signal from the Adaptive RSI and adds to the potential for a quick surge in price. However, it's important to be aware that this also increases the risk of a sudden overbought condition.
Supertrend Signals (AI Aggregator): The Supertrend indicator, functioning as an AI aggregator, is currently bullish.
Smart Money Concepts (Order Blocks Above $2): A key factor supporting this bullish outlook is the presence of strong order block support above the $2 psychological level. This suggests that institutional buyers or "smart money" have been accumulating XRP in this area, creating a solid foundation for a potential upward move.
Trade Setup:
Entry: Enter a long position now that the Adaptive RSI has flipped bullish on the 10-minute chart.
Stop-Loss: Place a stop-loss order below the recent swing low or a key support level identified by your indicators on the 15-minute chart, and consider placing it below the identified order block support for added security.
Take-Profit: Identify potential take-profit targets based on previous resistance levels or areas of potential selling pressure indicated on the 15-minute timeframe. Be mindful of the potential for a quick overbought condition, and consider taking profits strategically as the price rises.
Disclaimer: This is for educational purposes only and is not financial advice. Trading involves risk, and you could lose money. Always do your own research and consult with a qualified financial advisor before making any investment decisions.

Price Oscilattor with Entry and ExitPrice Oscillator Trend Reversal Strategy
Source: commodity.com -oscillator/
Indicators:
Price Oscillator (PO): Calculated as the difference between two Exponential Moving Averages (EMAs):
Short EMA (Fast Period): 9 days
Long EMA (Slow Period): 18 days
Thresholds:
• Overbought Level: PO >+2
•Oversold Level: PO <-2
Entry Conditions
Buy Entry (Long Position):
•PO crosses above the zero line from below (bullish crossover).
• OR PO moves into the oversold region (<-2) and starts to increase, indicating a potential reversal.
Sell Entry (Short Position):
• PO crosses below the zero line from above (bearish crossover).
• OR PO moves into the overbought region (>+2) starts to decrease, indicating a potential reversal.
Exit Conditions
Exit Long:
•PO crosses back below zero line.
Exit Short:
•PO crosses above 0 line.
