Bullish - LSK🐂 LONG – LSK
LSK has decisively broken out of its prior downtrend and successfully completed a retest on the 1H timeframe, confirming a valid trend shift. Volume has been steadily accumulating across previous candles, indicating institutional participation and strong absorption at support. This structure favors a continuation move to the upside as bullish momentum builds.
The setup aligns with a breakout–retest + volume accumulation model, offering a clean long with controlled risk.
🎯 TP: 0.2434
🛡️ SL: 0.19
📊 RR: 1 : 3
A disciplined trend-reversal long: structure confirmation + volume support → favorable continuation odds.
Scalptrading

BIG PUMP - POWER🐂 LONG – POWER
Price is accelerating strongly on the 15m timeframe, supported by a clear expansion in trading volume—confirming aggressive buyer participation. This combination of momentum + volume often precedes an impulsive continuation move. The structure suggests accumulation has completed and POWER is entering a markup phase, with a high probability of a sharp upside expansion.
🎯 TP: 0.41229
🛡️ SL: 0.21291
📊 RR: 1 : 5.3
A momentum-driven long setup: rising price + volume confirmation → strong upside potential with attractive risk–reward.

Bearish Divergence - ZBT🐻 SHORT – ZBT
A strong bearish divergence is confirmed on the 15m timeframe, while price remains overbought on both the 1H and 4H charts—most notably the 4H RSI reaching 95. This overextended rally signals momentum exhaustion. Such an unhealthy structure typically precedes distribution and a sharp sell-off. I am confident in a downside move.
🎯 TP: 0.0743
🛡️ SL: 0.1646
📊 RR: 1 : 5.35
A high-quality short setup: multi-timeframe overbought conditions + bearish divergence → elevated probability of a strong correction.

New Scalp Strategy 4 out of 4 won
testing a new strategy mainly traded during new York session time and purely based of the 4H candle and going deeper into the smaller TF for more info

Scalp SHORT – CC🐻 Scalp SHORT – CC
One of my favorite setups. Strong bearish divergence is confirmed on both the 15m and 1h timeframes after an excessive price expansion into overbought territory. Price is now trading below a major resistance, with repeated upper wicks signaling rejection and failed breakout attempts. This unhealthy structure suggests distribution is underway, increasing the probability of a sharp sell-off.
🎯 TP: 0.08461
🛡️ SL: 0.11983
📊 RR: 1 : 5
A high-quality short setup: multi-timeframe bearish divergence + strong resistance rejection → asymmetric downside potential.

Scalp SHORT – NIGHT🐻 Scalp SHORT – NIGHT
This is one of my preferred setups. Hidden bearish divergence is confirmed on the 15m timeframe, while the 1h RSI has reached extreme conditions, signaling exhaustion. After a sharp and extended drop in LIGHT, NIGHT is likely to follow a similar path. The recent aggressive price expansion has pushed the market into an unhealthy overbought state, increasing the probability of distribution and a sharp sell-off.
🎯 TP: 0.07392
🛡️ SL: 0.1215
📊 RR: 1 : 3.82
A clean short setup: divergence + overextension + momentum exhaustion → high probability of downside continuation.

Scalp SHORT – LIGHT🐻 Scalp SHORT – LIGHT
A textbook setup: a strong bearish divergence on the 15-minute timeframe while price has accelerated excessively into overbought territory. This parabolic advance reflects unhealthy price action and weakening momentum, a classic precursor to a sharp distribution phase. Probability favors a downside correction.
🎯 TP: 1.409
🛡️ SL: 3.28
📊 RR: 1 : 3.7
A clean short thesis: 15m bearish divergence + extreme overbought conditions → elevated risk of a sell-off with favorable risk-to-reward.

Scalp SHORT – FHE🐻 Scalp SHORT – FHE
The bullish structure has been decisively broken. Price is now trading within a clear descending channel, confirming a shift in market structure. RSI is rolling over into bearish territory, indicating increasing downside momentum and seller control. The technical context favors continuation to the downside rather than a recovery.
🎯 TP: 0.01596
🛡️ SL: 0.05016
📊 RR: 1 : 2.58
A clean short setup: structure breakdown + bearish channel + RSI weakness → downside continuation favored.

Scalp LONG – SUN🐂 Scalp LONG – SUN
SUN is deeply oversold on the 1h timeframe, signaling exhaustion on the sell side. Price action is compressing and approaching a classic breakout structure, suggesting momentum is building for a sharp upside expansion. A strong bullish breakout is anticipated.
🎯 TP: 0.02088
🛡️ SL: 0.01993
📊 RR: 1 : 3.75
A high-quality long setup: 1h oversold conditions + breakout structure → strong rebound potential with attractive risk-to-reward.

Scalp SHORT – FOLK🐻 Scalp SHORT – FOLK
Price is extremely overbought across all lower timeframes, with the 4h RSI reaching as high as 95 — a clear sign of excessive euphoria. A strong bearish divergence has formed on the 15m chart, indicating weakening momentum and a high probability of a pullback.
🎯 TP: 15.66
🛡️ SL: 40
📊 RR: 1 : 3.07
A clean short setup: multi-timeframe overbought conditions combined with bearish divergence → elevated correction risk and favorable risk-to-reward.

GBPUSD long Idea (Short term trading)I am looking forward to go long on GBPUSD Scalping (Short term trading)
ENTRY @ 1.33110
SL @ 1.32958
TP 01 @ 1.33379
TP 02 @ 1.33576

Scalp SHORT – FHE🐻 Scalp SHORT – FHE
“The market climbs the stairs but takes the elevator down” perfectly reflects FHE’s current structure.
The price is heavily overbought across all timeframes, with extremely strong bearish divergences appearing simultaneously on the 15m, 1h, and 4h charts — signaling exhausted buying pressure and a high risk of reversal. Price action also shows fading bullish momentum, suggesting that a deep correction is likely.
🎯 TP: 0.016
🛡️ SL: 0.05129
📊 RR: 1 : 5.06
A textbook short setup: multi-timeframe overbought conditions + confluence of strong bearish divergences → high probability of reversal with an attractive profit margin.

Gold (GC1!) Forecast: The Squeeze & Release Path via DSRTL MatriCategory: Trend Analysis / Chart Patterns
Symbol: GC1! (Gold Futures)
In this analysis, we use the DSRTL-ML (Dynamic Support & Resistance) engine to map the current structural context for Gold. The indicator is tagging the state as “TESTING RES – Bias: Neutral”, highlighting a consolidation phase right underneath a major resistance band. Structurally, this is a spot where static friction meets dynamic momentum.
1. The Current Structure: Compression Phase
The Matrix currently sits at S2 | D3 (Testing Resistance).
- The Ceiling (Static R): Price is capped by a high-volume resistance node (orange zone: ~4.24K–4.31K), acting as a lid on price action.
- The Floor (Dynamic S): At the same time, the rising DSRTL trend line (dynamic support) is pushing the lows higher inside the channel.
Taken together, this can be viewed as an early ascending-triangle–style squeeze: price is consolidating between a flat static lid and a rising dynamic floor, while DSRTL keeps the official bias neutral and labels the state as a resistance test.
2. Path of Least Resistance
The dashboard shows a positive Net Delta of +8.36K, suggesting that buyers have been active right below the resistance band.
- Projected Path: In the absence of a clear break, price can continue to oscillate within this narrowing pocket between static resistance and the rising channel.
- Breakout Vector: The combination of constructive volume flow and an upward-sloping dynamic channel creates a supportive backdrop if an upside break occurs, even though DSRTL itself still prints a Neutral bias here.
3. Scenario & Structural Objectives
- Trigger: A confirmed close above the top of the Static R band (~4.31K) would move the Matrix out of its S2 “testing” state toward an S1-type breakout environment.
- Next Structural Area: Above that level, the next area of interest becomes the upper rail of the DSRTL dynamic channel (pink line), where the system could start migrating toward its higher “extension” states.
Invalidation:
If price breaks and closes below the rising pink dynamic support, the bullish squeeze thesis is invalidated. In that case, the Matrix would likely rotate toward Neutral/Bearish or Bearish-Pullback configurations, depending on how price interacts with the underlying static support band.
Disclaimer: This forecast is based on structural scenarios derived from the DSRTL-ML engine and is provided strictly for educational and illustrative purposes.

Scalp SHORT – PIPPIN🐻 Scalp SHORT – PIPPIN
“Price climbs the stairs but takes the elevator down” — and Pippin looks ready for that elevator.
RSI is extremely overbought across all timeframes, with the daily RSI hitting 95. On the 4H and 1H, multiple strong bearish divergences have formed, signaling exhaustion of buying pressure and a likely top. A sharp downside move can be triggered at any moment.
🎯 TP: 0.01614
🛡️ SL: 0.25765
📊 RR: 1 : 4.72
A textbook short setup: extreme overbought conditions + multi-timeframe bearish divergence → high probability of a strong correction.

Scalp SHORT – PIEVERSE🐻 Scalp SHORT – PIEVERSE
Pieverse is printing a massive bearish divergence on the 1H timeframe, while RSI has entered extreme overbought conditions across most higher timeframes. Buying pressure is clearly fading, and price action is signaling the formation of a local top. A strong correction is highly likely.
🎯 TP: 0.3806
🛡️ SL: 0.7875
📊 RR: 1 : 5.2
A clean short setup: multi-TF overbought conditions + a strong bearish divergence → high probability of reversal.

Scalp SHORT – TAC🐻 Scalp SHORT – TAC
TAC is showing clear signs of artificial price inflation, with candles ignoring major resistance levels — a typical signature of aggressive pump behavior. RSI is extremely overbought across all key timeframes, signaling an imminent momentum collapse. Such overstretched conditions often unwind rapidly into deep oversold territory as liquidity thins out.
Key Signals
Extreme overbought RSI on multiple timeframes
Price action violating resistance → unsustainable pump
High probability of sharp corrective breakdown
🎯 TP: 0.004443
🛡️ SL: 0.015613
📊 RR: 1 : 5.44
A clean, high-efficiency short setup driven by exhaustion and structural instability.

SHORT – TRADOOR🐻 Scalp SHORT – TRADOOR
TRADOOR is showing strong overbought conditions, accompanied by a clear bearish divergence on the 15m timeframe, indicating that bullish momentum is weakening sharply. Price is currently reacting to a major resistance zone, where selling pressure typically increases — setting the stage for a significant reversal.
Key Technical Points
Overbought RSI + strong 15m bearish divergence
Price rejecting a major resistance level
Momentum fading → high probability of reversal
🎯 TP: 1.344
🛡️ SL: 2.728
📊 RR: 1 : 3.14
A clean short setup: concise, focused on reversal signals and momentum exhaustion.

Scalp SHORT – LSK🐻 Scalp SHORT – LSK
LSK has surged aggressively, pushing RSI into extreme overbought territory (reaching up to 90) and forming strong bearish divergences on both the 15m and 1h timeframes. Buying momentum is clearly weakening, while price action shows exhaustion near the local top. This strongly signals a potential sharp correction.
🎯 TP: 0.1756
🛡️ SL: 0.2917
📊 RR: 1 : 5.33
A clean short setup: extreme overbought conditions + multi-timeframe bearish divergence → high probability of downside pressure.

Scalp LONG – BOB🐂 Scalp LONG – BOB
BOB has broken the downtrend and completed a successful retest, confirming a short-term market structure shift. Price is currently trading above a strong multi-timeframe support zone, where buyers are consistently absorbing sell pressure. As long as this support holds, the probability of a bullish rebound toward the recent high is very strong.
Key Technical Points:
Downtrend break + successful retest
Trading above strong support
Short-term structure turning bullish
🎯 TP: 0.015776
🛡️ SL: 0.0123862
📊 RR: 1 : 4.61
A clean, professional long setup focused on confirmed reversal signals and solid support strength.
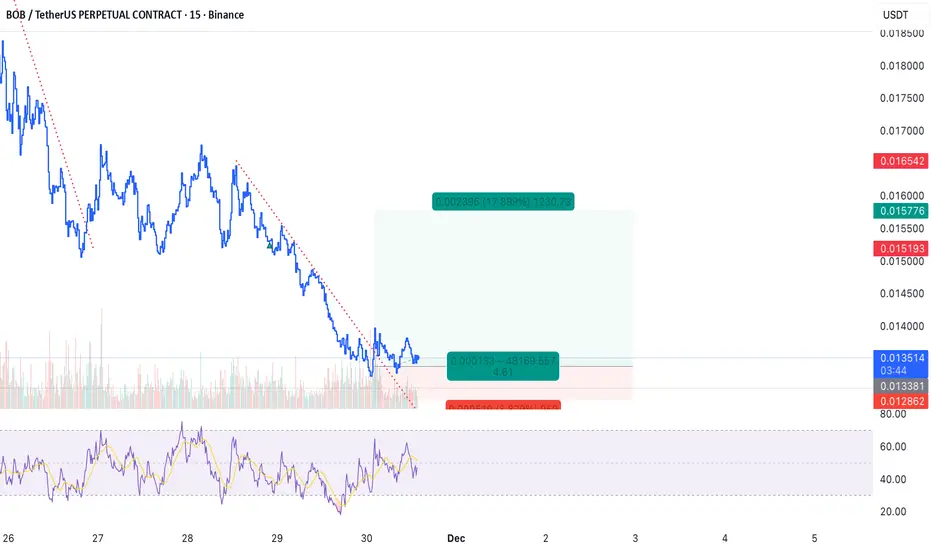
Scalp LONG – BOB🐂 Scalp LONG – BOB
BOB has broken its downtrend and successfully retested the breakout zone, confirming a structural shift in momentum. Price is now sitting firmly on a major multi-frame support, indicating strong buy-side defense. With sellers exhausted and structure reclaimed, a short-term recovery leg is highly probable.
Key Signals
Downtrend break + confirmed retest
Strong multi-timeframe support holding
Momentum recovery forming from the base
🎯 TP: 0.017783
🛡️ SL: 0.014713
📊 RR: 1 : 4.92
Một setup long rõ ràng, dựa trên cấu trúc đảo chiều và hỗ trợ vững chắc.

Scalp SHORT – TRADOOR🐻 Scalp SHORT – TRADOOR
TRADOOR is showing extreme overbought conditions on the 15m and 1h timeframes. On the lower 5m timeframe, clear reversal signals have formed, including a strong bearish divergence, indicating a loss of bullish momentum.
Given this confluence, an early downside reversal is highly probable and difficult to avoid.
Key Points
15m & 1h: Overbought levels signaling exhaustion
5m: Strong reversal structure + bearish divergence
Momentum weakening → high probability of corrective drop
🎯 TP: 1.328
🛡️ SL: 2.589
📊 RR: 1 : 3.27
This setup favors a short position with a strong technical basis for an early correction.

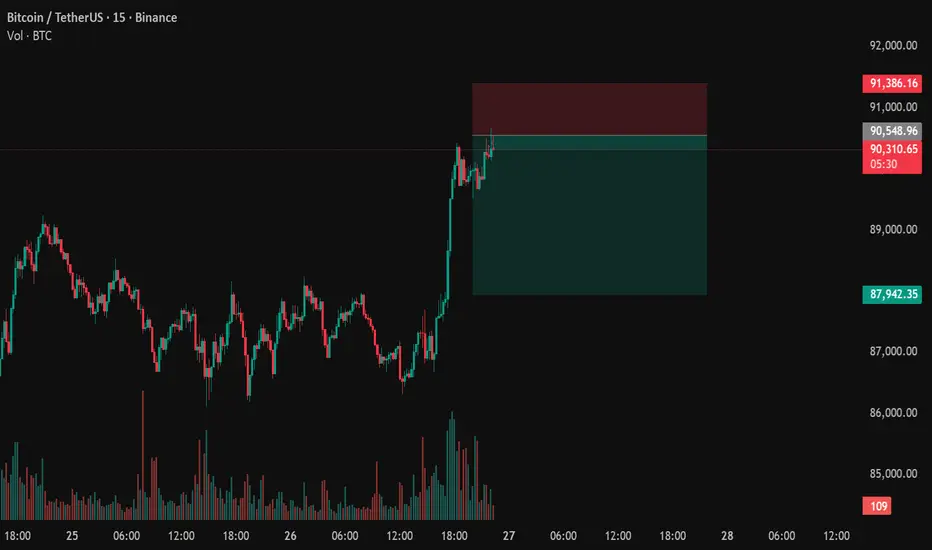
BTC Short - Structured ScalpingJoin me on the short side.
My trades are based on a personal setup focused on liquidity and supply–demand dynamics
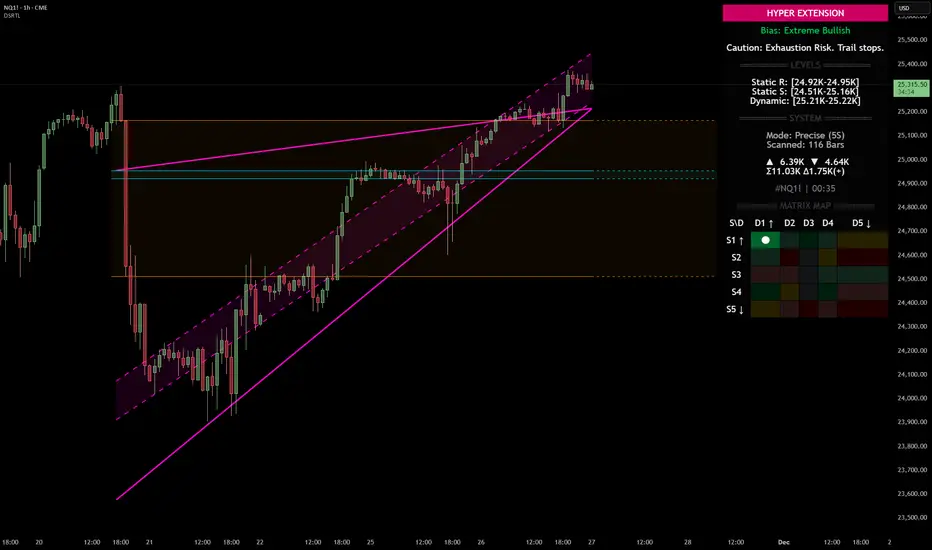
Nasdaq 100 (NQ): Hyper-Extended Momentum – Breakout or Exhaust
Category: Trend Analysis / Support & Resistance
Ticker: NQ1! (CME)
Analysis:
We are looking at the Nasdaq 100 Futures (NQ1!) on the 1H timeframe using the Dynamic Support & Resistance (DSRTL) system. The market is currently displaying a textbook example of a high-momentum breakout that has pushed into statistical extremes.
Here is the breakdown of the current technical landscape based on the indicator's Matrix Logic:
1. The "Hyper Extension" State (S1 / D1)
The indicator’s dashboard has triggered a "HYPER EXTENSION" alert. This specific state occurs when two conditions are met simultaneously:
• Static Breakout (S1): Price has cleared the horizontal resistance structures (indicated by the volume clusters).
• Dynamic Overextension (D1): Price has pierced above the upper limit of the dynamic trend channel (the purple trendlines).
2. Bias: Extreme Bullish
The current bias is rated as "Extreme Bullish". The trend is undeniably strong, confirmed by the positive Volume Delta (+965) shown on the dashboard. The price action is aggressive, creating a steep angle of ascent that has moved away from the mean.
3. The Warning Signal: Exhaustion Risk
While the trend is up, the system issues a cautionary note: "Exhaustion Risk. Trail stops."
In technical terms, when price action moves into "D1" (Dynamic Overextension), it indicates that the asset is trading significantly above its standard deviation or channel geometry. Historically, markets often seek mean reversion or consolidation after such rapid expansions to sustain the trend.
Key Levels to Watch:
• Dynamic Support (Immediate): The top of the purple channel (approx. 25,220) acts as the first layer of defense. A retest of this level is common after a breakout.
• Static Support (Structural): The breakdown level of the previous resistance, now turning into support around the 24.95K region.
Scenario Conclusion:
This is a pure momentum play. Traders should be aware that while the path of least resistance is up, the probability of a "snap-back" or consolidation increases the further price stretches above the dynamic channel. This is not a signal to short the trend immediately, but rather a signal to manage risk tightly on existing long positions.
Disclaimer: This analysis is for educational purposes only and explains the logic of the DSRTL technical indicator. It does not constitute financial advice.