Scalp Long – DOT💎 Scalp Long – DOT
Price has broken out of the downtrend, confirming a shift in short-term momentum. RSI is in the buying zone, and buying volume is increasing, signaling renewed strength. On the 1H timeframe, RSI has also broken out, reinforcing bullish sentiment.
🎯 Trade Setup:
→ TP: 2.976 | SL: 2.491 | RR: 1 : 2.77
Market structure and momentum align for a clean scalp long setup, favoring a continuation move following the breakout.
Scalptrading

Scalp Long – ASTER💎 Scalp Long – ASTER
The price has broken out of the short-term downtrend and successfully completed a retest, indicating that buying momentum is returning. RSI confirms a similar breakout, showing strong confluence between price action and momentum.
🎯 Trade Setup:
→ TP: 1.0612 | SL: 0.8348 | RR: 1 : 2.39
Both market structure and technical signals support a short-term recovery phase, making this a well-controlled scalp long setup

Scalp Long – AIN💎 Scalp Long – AIN
RSI shows a strong bullish divergence, with the 1H timeframe deeply oversold — signaling potential reversal momentum.
Buying volume is returning, and price is holding above key support, reinforcing the long setup.
🎯 Plan:
→ Enter after confirmation of bullish reaction at support.
→ TP: 0.1276 | SL: 0.12264 | RR: 1 : 2.14
Momentum aligns with a rebound move.
Keep entries clean, trail SL as price climbs.
Stay patient — execute only on confirmed signals.

Scalp Short – TON💎 Scalp Short – TON
RSI is weakening and entering the overbought zone, while price has broken below key support, signaling potential downside continuation.
🎯 Plan:
→ Enter after confirmation of breakdown retest.
→ TP: 2.148 | SL: 2.36 | RR: 1 : 2.85
Momentum favors the short side.
Keep entries precise, trail SL as price moves lower.
Stay disciplined — execute only after clear confirmation.

Scalp Long – BTC💎 Scalp Long – BTC
RSI is deeply oversold, especially on the 1H timeframe, signaling exhaustion of selling pressure.
Buying volume has reappeared, suggesting a potential retest of the 110,000 zone previously broken.
🎯 Plan:
→ Enter after confirmation of bullish reaction from support.
→ TP: 110,486 | SL: 106677 | RR: 1 : 3.8
Momentum favors a short-term rebound.
Keep entries precise, trail SL as price rises.
Patience and clarity — only execute once the setup confirms.

Scalp Long – WLFI💎 Scalp Long – WLFI
Strong bullish divergence forming on RSI, with the 1H timeframe deep in oversold territory.
Buying volume returning, price holding firmly above key support and breaking out of the downtrend — a textbook reversal setup.
🎯 Plan:
→ Enter after confirmation of support hold.
→ TP: 0.1308 | SL: 0.1186 | RR: 1 : 2.14
This familiar pattern continues to deliver high reversal accuracy — a calculated long with favorable reward-to-risk.

Scalp Long – F💎 Scalp Long – F
Price is consolidating just below the downtrend resistance, preparing for a potential breakout. RSI is deeply oversold, suggesting strong reversal potential. A temporary recovery is anticipated once the breakout is confirmed.
🎯 Trade Setup:
→ TP: 0.15788 | SL: 0.10125 | RR: 1 : 3.84
Momentum and market structure together point to a high-reward scalp long opportunity, ideal for short-term traders awaiting a breakout confirmation.

Scalp Short – JELLY JELLY💎 Scalp Short – JELLY JELLY
RSI is heavily overbought, confirmed across the 1H timeframe, signaling exhaustion of bullish momentum.
Price is facing a strong resistance zone, where prior rejection occurred — suggesting a high-probability pullback.
🎯 Plan:
→ Enter on confirmation of rejection at resistance.
→ TP: 0.06294 | SL: 0.12658 | RR: 1 : 3.93
Momentum favors sellers.
Ride the retracement with discipline — secure profits as price approaches target.

Scalp Long – JELLYJELLY💎 Scalp Long – JELLYJELLY
RSI is extremely oversold, with two consecutive bullish divergences signaling strong reversal potential.
A powerful recovery is likely — high risk, high reward setup for disciplined traders.
🎯 Plan:
→ Enter after confirmation of bullish momentum shift.
→ TP: 0.10196 | SL: 0.0451 | RR: 1 : 7.74
Momentum suggests a sharp rebound.
Keep positions lean, trail SL as price accelerates.
Patience is key — wait for clear confirmation before entry.

Scalp Short – IDOL💎 Scalp Short – IDOL
RSI is overbought and showing a bearish divergence on the 5m timeframe.
The 15m chart is also overbought, suggesting an imminent correction as buying momentum weakens.
🎯 Plan:
→ Enter after confirmation of rejection from the top zone.
→ TP: 0.3324 | SL: 0.3803 | RR: 1 : 4.7
Momentum favors the short side.
Keep entries precise, trail SL as price moves lower.
Stay patient — only act once the setup confirms clearly.

#EURUSD Sell Side / QuickScalp
⚠️ Risk Assessment: {High}
🚀 Approach:
We can have an add on position on EU . need valid momentum Structure first ... HighRisk QuickScalp OANDA:EURUSD

Scalp Long – 42💎 Scalp Long – 42
Price has broken out of the downtrend, retested resistance, and is now moving higher.
RSI confirms the shift by breaking its prior bearish structure, while buying volume is returning, supporting a potential rebound.
🎯 Plan:
→ Enter after confirmation of bullish continuation.
→ TP: 0.1227 | SL: 0.10803 | RR: 1 : 2.5
Momentum supports the long side.
Keep entries clean, trail SL as price advances.
Patience and discipline — execute only on confirmed signals.

Scalp Long – F💎 Scalp Long – F
Price has broken out of the downtrend and is now retesting major support.
Price action shows strong reaction signals, with buying volume starting to build, indicating a potential rebound.
🎯 Plan:
→ Enter after confirmation of support hold.
→ TP: 0.14629 | SL: 0.13175 | RR: 1 : 3.3
Momentum favors a recovery setup.
Keep entries precise, trail SL as price rises.
Stay patient — only engage after clear confirmation.

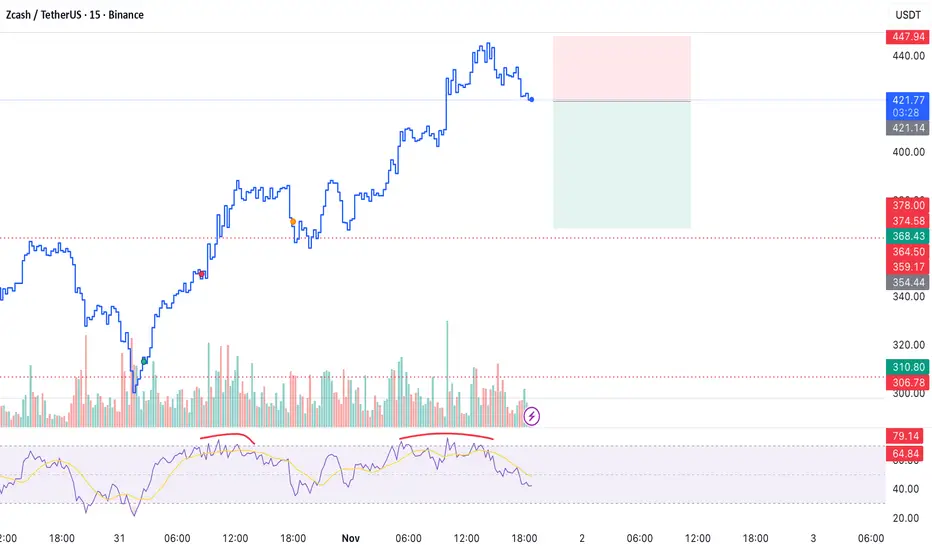
Scalp Short – ZEC💎 Scalp Short – ZEC
RSI has formed a double top and is now entering the selling zone on lower timeframes.
Selling volume is emerging, signaling growing bearish momentum.
🎯 Plan:
→ Enter after confirmation of rejection from resistance.
→ TP: 368.43 | SL: 447.94 | RR: 1 : 1.97
Momentum favors the short side.
Keep entries sharp, trail SL as price declines.
Stay disciplined — only execute once confirmation is clear.
Scalp Long – ASTER💎 Scalp Long – ASTER
RSI on the 5m timeframe is deeply oversold, forming a double-bottom pattern.
Price is holding above strong support on the 15m chart, suggesting a potential recovery setup from this zone.
🎯 Plan:
→ Enter after confirmation of bullish reversal.
→ TP: 0.9768 | SL: 0.9062 | RR: 1 : 3.47
Momentum signals a possible rebound.
Keep entries clean, trail SL as price strengthens.
Patience and precision — wait for clear confirmation before entry.

Scalp Long – SXP💎 Scalp Long – SXP
RSI is in the buying zone, and price has broken out of the short-term downtrend, confirming a shift in momentum.
Buying volume is increasing across lower timeframes, reinforcing bullish sentiment.
🎯 Plan:
→ Enter after confirmation of breakout strength.
→ TP: 0.1168 | SL: 0.1057 | RR: 1 : 3.89
Momentum aligns with the long side.
Keep entries clean, trail SL as price rises.
Patience and precision — only enter when setup confirms clearly

Scalp Long – ZIL💎 Scalp Long – ZIL
RSI has broken out of its downtrend, and price has broken above the triangle pattern, signaling a clear bullish shift.
Buying volume is surging, confirming strong momentum behind the move.
🎯 Plan:
→ Enter after confirmation of breakout retest.
→ TP: 0.00774 | SL: 0.00733 | RR: 1 : 2.42
Momentum supports the long setup.
Keep entries clean, trail SL as price advances.
Stay patient — act only on confirmed breakout strength.

Scalp Long – SQD💎 Scalp Long – SQD
RSI is deeply oversold, with a bullish divergence forming, hinting at a potential recovery setup.
Wait for a confirmed breakout to validate the move — high risk, high reward opportunity.
🎯 Plan:
→ Enter after clear breakout confirmation.
→ TP: 0.09756 | SL: 0.07855 | RR: 1 : 5.26
Momentum is shifting in favor of buyers.
Keep positions light, trail SL as price strengthens.
Patience and precision — only act when the setup confirms.

Scalp Long – JELLYJELLY💎 Scalp Long – JELLYJELLY
RSI is deeply oversold, showing a clear bullish divergence, signaling potential reversal momentum.
This setup carries high risk but high reward, ideal for precise, disciplined entries.
🎯 Plan:
→ Enter after confirmation of bullish divergence hold.
→ TP: 0.11429 | SL: 0.06568 | RR: 1 : 5.49
A potential rebound setup is forming.
Keep positions light, trail SL as price reacts.
Patience and timing are key — only execute on confirmation

Scalp Long – WIF💎 Scalp Long – WIF
RSI is in the buying zone, and price has broken out of the short-term downtrend, confirming bullish momentum.
Buying volume is rising sharply, with capital flowing back into meme coins, strengthening the long bias.
🎯 Plan:
→ Enter after confirmation of breakout continuation.
→ TP: 0.568 | SL: 0.494 | RR: 1 : 2.52
Momentum supports the long side.
Keep entries tight, trail SL as price climbs.
Stay disciplined — only engage when the setup confirms.

Scalp Short – JELLYJELLY💎 Scalp Short – JELLYJELLY
RSI is extremely overbought across all major timeframes — 1H and 4H readings are near 100, signaling exhaustion.
A reversal pinbar has formed, confirming selling pressure as buyers hesitate to chase the top.
🎯 Plan:
→ Enter after confirmation of rejection from resistance.
→ TP: 0.1152 | SL: 1.16679 | RR: 1 : 3.35
Momentum favors the short side.
Keep positions light, trail SL as price declines.
Stay disciplined — wait for confirmation before execution.

Scalp Long – COOKIE💎 Scalp Long – COOKIE
Price is recovering and preparing to break out of the short-term downtrend, signaling a potential shift in momentum.
🎯 Plan:
→ Enter after confirmation of breakout and retest.
→ TP: 0.1216 | SL: 0.086 | RR: 1 : 5.25
Momentum favors the long side.
Keep entries precise, trail SL as price advances.
Patience is key — only engage once the setup fully confirms.

Scalp Long – EVVA💎 Scalp Long – EVVA
RSI is oversold on both 15m and 1h timeframes, showing seller exhaustion.
Price is holding above strong support, while buying volume is surging again — signaling a potential rebound.
🎯 Plan:
→ Enter after confirmation of bullish reversal.
→ TP: 12.317 | SL: 8.685 | RR: 1 : 2.24
Market structure supports a recovery move.
Keep entries precise, trail SL as momentum builds.
Stay disciplined — act only on a confirmed setup.
