BTCUSD H1 | Bearish Reversal at Pullback ResistanceBTC/USD is rising towards the sell entry, which is a pullback resistance that lines up with the 50% Fibonacci retracement and could reverse from this level to the downside.
Sell entry is at 111,22.96, which is a pullback resistance that lines up with the 50% Fibonacci retracement
Stop loss is at 113,549.46, whic is a pullback resistance that is slightly below the 78.6% Fibonacci retracement.
Take profit is at 106,29.13, which is a multi swing low support.
Stratos Markets Limited (tradu.com ):
CFDs are complex instruments and come with a high risk of losing money rapidly due to leverage. 68% of retail investor accounts lose money when trading CFDs with this provider. You should consider whether you understand how CFDs work and whether you can afford to take the high risk of losing your money.
Stratos Europe Ltd (tradu.com ):
CFDs are complex instruments and come with a high risk of losing money rapidly due to leverage. 70% of retail investor accounts lose money when trading CFDs with this provider. You should consider whether you understand how CFDs work and whether you can afford to take the high risk of losing your money.
SD

XAUUSD Long- Fri, Sep 5, 2025I did open a long position on Gold yesterday hoping to get close to the ATH. Luckily it did and gave me a 1:4 rr. I guess this is it for gold so far and it is going to drop a bit for the foreseeable future.
what do you think??
-Moz
#XAUUSD #long #ATH

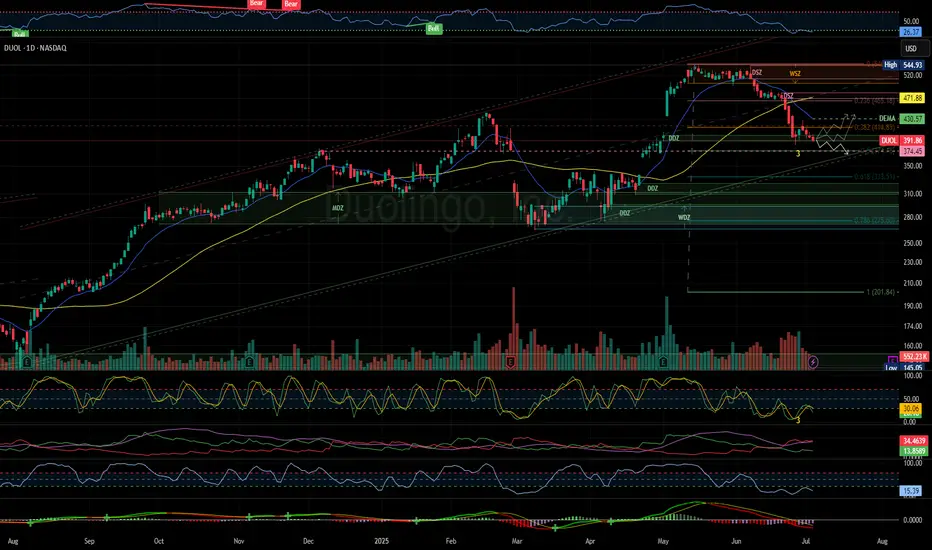
DUOL probable continues bearish for CCSDUOL 1D: at mid DDZ which coincides with FibR- 0.382. Just below price gap.
There is no sign of a reversal yet. Early next week , expect to confirm this to determine potential CCS.
Just covered a price gap with Fib-R 0.382 and likely bo would test 0.5 FibR, just before lower price-gap. BO here likely cover gap to test 0.618 typically high probability of demand side increasing.
Bo would test 0.786 for a deep correction which c
Potential target is DDZ above WDZ or DDZ in WDZ.

SSV Cup And Handle Breakout IncomingThe target of the Cup and Handle Pattern is 52$.
This coin has been rallying from the levels of 8$ and there is still some steam left for the bulls to go to higher levels.
Proof of Stake has helped this project to grow big. We're still early but for the traders a level of 52$ is to be expected for the short-midterm.
Long term hodlers expect at least 3 figures.

Forecast for Stader after Channel BreakStader is a staking solution, currently live on Hedera, Polygon, Fantom, Near, Binance, Terra 2.0, and Terra Classic networks.
I expect the price to replicate the amplitude of the long channel.

EURUSD: Bear flag pattern along with EURO weaknessHey traders, in today's trading session we are monitoring EURUSD for a selling opportunity around 1.02 zone, once we will receive any bearish confirmation the trade will be executed.
Trade safe, Joe.

bitcoin movements btc once rejected from 16-18 area and thats a daily demand area
now we can see that 21-22500 daily supply area and bitcoin can reject from that area too the down side very easily
if price wants too grow too the upside ( idont think) can move like the green paths
comment your idea about that
have nice weekend

SD SandRidge Energy low P/E ratioThe Price per Earnings ratio of SandRidge Energy is extremely low, 5.62.
With the upcoming earning on February 23 i expect a rise to the $13.8 resistance.

SPONSOR CANDLE SETUP AT AXYvery strong setup
I'm glad share this with you guys...
helped by priceaction and RTM & ICT METHODS & ORDERFLOW & SMARTMONEY CONCEPT and S&D METHODS
sincerely BEARBOURSE


SUPPLY DEMAND H1 TestSupply demand test on gbpcad with entry n1. High test candle, n2 Engulfing/inside Targeting 1:4,1:3RR

💡Don't miss the great buy opportunity in USDCADTrading suggestion:
. There is a possibility of temporary retracement to suggested support line (1.3105). if so, traders can set orders based on Price Action and expect to reach short-term targets.
Technical analysis:
. USDCAD is in a range bound and the beginning of uptrend is expected.
. The price is below the 21-Day WEMA which acts as a dynamic resistance.
. The RSI is at 60.
Take Profits:
TP1= @ 1.3175
TP2= @ 1.3200
TP3= @ 1.3250
SL= Break below S2
❤️ If you find this helpful and want more FREE forecasts in TradingView
. . . . . Please show your support back,
. . . . . . . . Hit the 👍 LIKE button,
. . . . . . . . . . . Drop some feedback below in the comment!
❤️ Your Support is very much 🙏 appreciated! ❤️
💎 Want us to help you become a better Forex trader ?
Now, It's your turn !
Be sure to leave a comment let us know how do you see this opportunity and forecast.
Trade well, ❤️
ForecastCity English Support Team ❤️


DXY US Dollar Index Initial Target Hit $94.40. Retrace & Resume?DXY
I published a chart for DXY at beginning of September(linked below). This video furthers the idea that DXY is in correction mode.
I propose that DXY will make a retracement back to its local trendline, using the 14% retrace of March-September Swing as support now.
Looking for potential bounce from there($93.32 area), then a resumption of the correction to the 38.2% March-September Swing($96.04)
In 2016, after President Trump was elected the DXY proceed to top out soon after in Jan. 2017, until it put in a bottom in Jan. 2018, in correlation to Bitcoin & Crypto Market Bubble.
I expect similar results for the coming election and DXY price correlation. I expect The Donald to win, thus in turn ending the correction for DXY, and resume its drawdown into 2021...If
a one year downtrend ensues for DXY at that point, perhaps we see another bubble for Bitcoin late 2021, early 2022?
What's is your thought? I'd love to know...
Thanks for checking out my analysis!


cadjpy short set upcadjpy has gapped down at the beginning of the month and has respected daily supply for some time now. Waiting for price to reach daily supply or 15 min supply to look for entries.


SD [NYSE] SandRidge Energy long.All description on the chart.
Please, don't forget to like and follow.
Thank you.


BTCUSD approaching resistance, potential drop!BTCUSD is approaching our first resistance at 5991.7 (horizontal pullback resistance, 23.6% Fibonacci retracement) where a strong drop might occur below this level pushing price down to our major support at 5151.5 (100% Fibonacci extension).
Stochastic (21,5,3) is also approaching resistance and we might see a corresponding drop in price.
Trading CFDs on margin carries high risk.
Losses can exceed the initial investment so please ensure you fully understand the risks.
