Bitcoin will die! Silver pumped +200% - GOLD (2026 prediction)Bitcoin will die in 2026, and a lot of traders will get liquidated! Silver pumped by 200% this year, gold by 75%, and the US stock index Nasdaq by 61%, while Bitcoin dropped from 126k to 80k in 2025. I will tell you exactly why in this analysis!
First, let's take a look at Bitcoin and the main reason behind this drop. If you started investing in Bitcoin, I have to warn you because the total market capitalization is already extremely big. In other words, Bitcoin will never go up exponentially as it did in previous years! You are late to the Ponzi, so forget about 10x or 50x profit. The price of Bitcoin, the code of Bitcoin, and the future of Bitcoin are completely controlled by the banks and huge institutions. Crypto technology is not new in the galaxy, it has been brought to planet Earth by aliens. So why is Bitcoin going down? As an investor, you should probably know that Bitcoin experiences halving events +- every 4 years. From a technical point of view, we have 3 years of growth and 1 year of sharp decline. We already had the 3-year growth cycle (2022-2025), so we can expect a massive drop in 2026. How low can Bitcoin go? My prediction is 40k to 60k.
What about silver and gold? Why are these precious metals going up like crazy? Mostly because the price has been kept very low for a very long time. The banks did their best to keep the price low. Over 99% of gold and silver is in a virtual form or in the form of contracts. So they artificially decreased the price of these metals for their own benefits. There are still people who think that gold, silver, and Bitcoin are enemies to the traditional banking system and banks in general. That is 100% false; in fact, it's the opposite - they love them. Banks make money mostly on providing services, such as keeping your money safe, or loans or payments... It really doesn't matter if they give you a loan in gold or bitcoin fiat dollars as long as they make money. Bitcoin is not a threat to the financial system. I think banks would love to loan you 1 Bitcoin so you can pay them 2 BTC back. Sounds like a great deal, doesn't it? In fact, with Bitcoin, every transaction is monitored, and anonymous payments are not possible anymore.
If you can't make money on Bitcoin, you can still make money on some altcoins (hidden gems). Write a comment with your altcoin + hit the like button, and I will make an analysis for you in response. Trading is not hard if you have a good coach! This is not a trade setup, as there is no stop-loss or profit target. I share my trades privately. Thank you, and I wish you successful trades!
Community ideas

EURUSD: Bullish Structure Holds - Market Eyes 1.1810 ResistanceHello everyone, here is my breakdown of the current EURUSD setup.
Market Analysis
EURUSD is trading within a well-defined bullish structure after breaking out of a descending triangle formation, signaling a clear shift in control from sellers to buyers. The initial breakout was followed by a brief consolidation phase, where price formed a tight range, suggesting accumulation rather than distribution. After this pause, the pair continued higher and successfully broke above the triangle resistance line, confirming bullish continuation.
Currently, EURUSD is trading above a rising trend line, which continues to act as dynamic support. The market recently tested the Resistance Zone around 1.1810, where selling pressure appeared, leading to a short-term pullback. This retracement is now developing toward the Support Zone near 1.1760, which aligns with the previous breakout area and the ascending structure. As long as price holds above this support, the broader bullish trend remains intact and the pullback appears corrective.
My Scenario & Strategy
My primary scenario remains bullish while EURUSD holds above the 1.1760 Support Zone. I expect buyers to defend this area and push price higher for another attempt toward the 1.1810 Resistance Zone.
Therefore, a clean breakout and acceptance above resistance would confirm bullish continuation and open the way for further upside expansion. However, a decisive breakdown below support would weaken the structure and signal a deeper correction. For now, price action continues to favor buyers as long as the ascending structure holds.
That's the setup I'm tracking. Thank you for your attention, and always manage your risk.

What I Expect from 2026Scenarios • Markets • Levels • Positioning
First of all, I want to thank everyone for the activity under my previous post .
More than 300 likes are not just numbers to me — they show that you read, think, and ask the right questions. These are exactly the people who motivate me to keep sharing my perspective.
I don’t write for algorithms.
I write for those who want real results and understand that results come through process, discipline, and the right environment.
This text is not about fast growth or guessing the bottom.
It is about patience, structure, and working during moments of maximum pain.
In 2026, the market will be selective: opportunities will become fewer, and the cost of mistakes will be higher.
This is exactly when an advantage is built — by those who can wait and work systematically, not alone.
___________________________________________
Context and Philosophy of 2026
2026 is a year of reassessment and awareness.
A year when the market stops rewarding haste and illusions.
We are in a bearish phase, and according to my calculations, it will likely last almost until the end of the year. This is not a time for emotions or hope — it is a time for learning and preparing for the next cycle.
It’s important to accept a simple truth:
the market does not owe you opportunities every day.
No trade is also a position.
I’ve been in financial markets since 2009 and in crypto since 2016.
I’ve seen how every cycle looks different but ends the same way — disappointment and denial. That is exactly where the market pushes the majority in 2026.
___________________________________________
What Really Happened in 2025
2025 became the year of maximum institutional involvement.
ETFs, derivatives, structured products, and complex instruments fully integrated crypto into the global financial system.
And the global financial market is:
- highly competitive
- professional
- cold and calculated
This is not a place for belief — this is where capital positions, hedges, and extracts liquidity.
Crypto remains a young industry, but it is already playing by adult rules.
Many failed to understand this — and paid for it.
___________________________________________
The Main Mistake Most Will Make in 2026
Two things:
1. Believing in a quick reversal
2. Increasing risk in an attempt to “win it back”
Hope is the most expensive emotion in the market.
The market does not pay for hope — it pays for timing, structure, and execution.
Most people will leave not because the market is “bad,” but because they will break psychologically. I’ve seen it many times: different cycles, different faces — the same mistakes.
If you stay in the market, you must relearn it every cycle.
___________________________________________
Macro Environment and Market Conditions
Key factors I’m watching:
- interest rates
- regulation
- capital flow direction
- narratives that attract new liquidity
Regulation is neither an enemy nor a savior — it is reality.
Licenses, requirements, and rules are shaping a market that is becoming part of the global financial system.
2026 is a year of redistribution and accumulation, not growth.
Liquidity is fragmented. There are too many projects, too many tokens, and not enough capital for everyone. Stablecoins are growing, but still not enough to “feed” the entire market.
___________________________________________
Altcoins in 2026: My View
My position is strict and honest:
Most altcoins face collapse, cleansing, and increased regulatory pressure.
The reasons are clear:
- an excessive number of tokens
- fragmented attention
- constant unlock pressure
- funds sitting in long-term profit
- lack of sustainable economics
There will be exceptions — but they will be rare.
Paradoxically, memecoins (despite my skepticism) did one useful thing:
they forced people to learn on-chain analysis, search for inefficiencies, and track capital flows.
What remains structurally alive
RWA (tokenized real-world assets)
infrastructure
DeFi v2 as an alternative to the traditional system
At the same time, we must be honest: potential returns in altcoins are structurally declining compared to previous cycles.
___________________________________________
Bitcoin — Base Scenario for 2026 and Key Levels
My base scenario is continued pressure and bottom formation.
Capitulation will affect:
- traders
- investors
- miners
- funds
- large corporations
The market will be cleansed of large holders.
This process is always painful — and always necessary.
Key ranges
- base: 48,000 – 74,000
- extreme zones: 38,000 – 46,000
My operating logic
- the first meaningful accumulation zone is around 64k
- limit orders are placed lower
- buying only during moments of panic
- no rush, no emotions
There is an old saying:
“ We enter the market when there is blood in the streets .”
This is not drama — this is how asymmetric advantage is built.
Short squeezes are possible, but they will be short-lived.
Markets do not trend higher on disappointment.
In my view, the final deep phase of this cycle and the shift toward early bullish conditions align closer to September 2026.
___________________________________________
Other Markets and Diversification
One of the biggest mistakes crypto traders make is thinking the world ends with crypto.
Blockchain is infrastructure — not the entire market.
That’s why in 2026 I diversify across:
- gold
- oil
- indices
- stocks
- and only very selectively crypto assets
Other markets are:
- more liquid
- more structured
- often cleaner in execution
S&P 500
So far there are no clear reversal signals, but after new highs I expect correction or stagnation. The reasons are obvious: the AI bubble, debt pressure, and liquidity concentration.
Gold
A historical safe haven. The trend remains intact.
My long-term target is $6,000 ± $1,000.
DXY
Weakening is possible, but the dollar is likely to maintain dominance due to digitization and global settlement demand.
Oil
One of my key instruments. Expensive oil is not beneficial for the US, and I see no strong reasons for sustainably high prices in the short term.
___________________________________________
Narratives Beyond Crypto
The world is reaching the limits of energy supply.
Energy is becoming a strategic advantage.
Those who produce electricity efficiently will be in a strong position.
Alternative energy sources and the entire energy chain will play a key role.
AI is not just hype.
AI will drive breakthroughs in medicine, energy, data analysis, and financial markets.
Global instability is no longer a forecast — it is a condition.
We are moving toward a reset of global processes and agreements.
___________________________________________
My Trading Approach in 2026
- more cash
- short-biased trading when structure allows
- only selective entries
- waiting for panic
- minimized risk
If there is no setup - there is no trade.
That is discipline.
And one more thing: if you are tired - rest.
The market will not disappear.
Your capital and your mindset are your main assets.
___________________________________________
Personal Commitment and Community
In 2026, I will relaunch the Academy and deeply integrate AI tools.
For members of my community, the Academy will be free under specific conditions.
Discipline is not motivation.
Discipline is the ability to follow a plan regardless of emotions.
Growth is slow alone. It is faster in the right environment.
I am building a strong trading community where:
- thinking evolves
- on-chain capital flows are analyzed
- portfolios with limit orders are structured
- experience is shared, not illusions
Some of these portfolios have already started activating, and one position is around +15%. This is not luck — this is systematic work.
___________________________________________
One Honest Question
Ask yourself honestly:
Are you here to prove something to the market — or to achieve a sustainable result?
Because results only come through self-study, discipline, and a repeatable process.
___________________________________________
Final Thoughts
Markets reward preparation, not urgency.
Give the market time. Give the system time.
If you are still here in 2026 — you are already ahead of most.
The main task is simple: stay in the game.
Build positions when it hurts.
Grow when it is quiet.
Best regards EXCAVO

XAUUSDHello Traders! 👋
What are your thoughts on Gold?
Gold entered a corrective phase after reaching the upper boundary of the ascending channel. This correction extended toward the lower boundary of the channel and the marked support zone, where price showed a strong bullish reaction. The subsequent rebound confirms that the overall bullish market structure remains intact.
At the moment, the highlighted resistance zone is acting as the main barrier to further upside.
If this resistance is broken decisively, continuation toward higher price levels can be expected.
Trading Plan:
For long positions, the preferred scenario is to wait for a clear breakout above the resistance and then enter on a pullback after price successfully holds above the broken level. This approach provides a more favorable risk-to-reward setup.
Invalidation:
If price breaks the lower boundary of the ascending channel and decisively moves below the support zone, the current bullish outlook will be invalidated.
Please Don’t forget to like and share your thoughts in the comments! ❤️

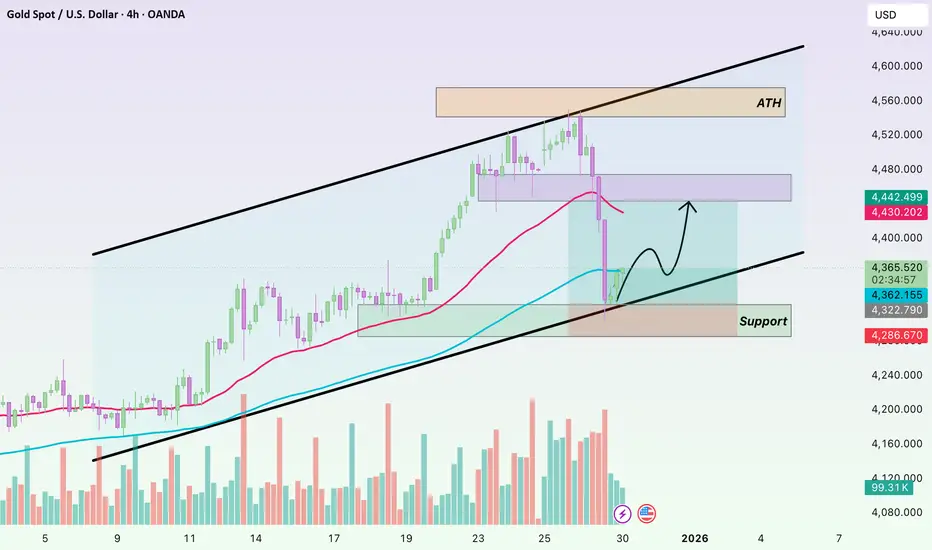
XAUUSD Fake Breakout at 4,520 - Price Tests Buyer Zone at 4,260Hello traders! Here’s my technical outlook on XAUUSD (4H) based on the current chart structure. Gold is trading within a broader ascending channel, confirming a dominant bullish structure despite the recent sharp pullback. After a strong impulsive rally, price respected the channel support and continued forming higher highs and higher lows, highlighting sustained buyer control throughout the trend. Currently, XAUUSD is trading below the broken channel support and has entered the Buyer Zone around 4,260, which aligns with a key Support Level and a prior breakout area. This zone represents an important reaction area where buyers may attempt to regain control. The projected path suggests a possible corrective bounce from this level, but overall price action remains vulnerable as long as it stays below the former resistance and channel structure. My scenario: as long as XAUUSD remains below the 4,520 Seller Zone and fails to reclaim the broken channel support, the bias favors further downside or consolidation. A clean hold above the Buyer Zone could trigger a short-term rebound toward the mid-channel area, while a decisive breakdown below 4,260 would open the door for a deeper corrective move. Please share this idea with your friends and click Boost 🚀

Lingrid | GOLD Swap Zone Bounce Signals Trend ContinuationOANDA:XAUUSD reacted strongly after pulling back from the 2025 high, finding demand inside the 4,270–4,280 swap zone, where prior structure and the rising trendline converge. The rebound from this area suggests selling pressure may be losing control rather than accelerating into a trend reversal.
If price continues to respect this support, a recovery move toward 4,460 could develop, followed by a possible re-test of the upper resistance. The broader bullish framework remains intact as long as price stabilizes above the channel base.
➡️ Primary scenario: defense of 4,270 → push toward 4,460
⚠️ Risk scenario: acceptance below 4,250 shifts focus to deeper corrective levels
If this idea resonates with you or you have your own opinion, traders, hit the comments. I’m excited to read your thoughts!

BTCUSDT Long: Buyers Defend Channel Support, Upside in FocusHello traders! Here’s a clear technical breakdown of BTCUSDT (4H) based on the current chart structure. After a prolonged consolidation phase defined by a broad range, BTC established multiple internal breakouts, highlighting volatility but no clear directional dominance. This range acted as an accumulation zone, with price repeatedly reacting around key horizontal levels. From the lower boundary of the range, BTC formed a clear pivot low, which marked the start of a bullish recovery and shift in short-term market structure.
Currently, BTC is holding above the Demand Zone around 86,800, which aligns with prior range support and the lower boundary of the ascending channel. This area has already shown buyer reaction, reinforcing it as a key level for continuation. Price is now attempting to push higher toward the upper boundary of the channel.
My scenario: as long as BTCUSDT holds above the Demand Zone and respects the ascending channel support, the bias remains bullish. I expect buyers to defend this area and attempt a move back toward the 89,000 Supply/Resistance Zone as the first target. A clean breakout and acceptance above this level would confirm bullish continuation and open the path toward higher targets within the channel. A breakdown below demand would invalidate the long scenario. Manage your risk!

BTCUSDT Above Support - $88,900 Resistance in PlayHello traders! Here’s my technical outlook on BTCUSDT (1H) based on the current chart structure. BTCUSDT is trading within a broader ascending channel, confirming an overall bullish structure despite recent volatility. After a sharp drop earlier on the chart, price formed a clear base and started to grow, establishing higher lows along the channel’s support line. This recovery phase shows that buyers remain active and are defending key levels. Price then moved into a consolidation area between a clearly defined Buyer Zone (support) and Seller Zone (resistance), creating a range-like environment inside the channel. Multiple breakouts and false moves around the Seller Zone highlight strong supply pressure in this area, while repeated defenses of the Buyer Zone confirm solid demand. The dashed midline reflects interim structure guiding price action within the channel. Currently, BTC is holding above the Support Level around the Buyer Zone (~87,300), while facing overhead Resistance near the Seller Zone (~88,900). The projected move suggests a potential bounce from support toward resistance, with TP1 aligned near the upper resistance area inside the channel. My scenario: as long as BTCUSDT holds above the Buyer Zone and the ascending support line, the bias remains bullish, with a move toward the resistance and TP1 as the primary objective. A strong rejection from resistance could lead to further consolidation. However, a clean breakdown below support would invalidate the bullish setup and signal a deeper pullback. Please share this idea with your friends and click Boost 🚀

BTC - Where the 2026 Bottom Might Actually FormLet me be clear from the start.
This is not about calling a bottom today.
It’s about comparing this cycle to the previous ones.
📉 From a structural point of view:
Price is trading below the key moving average, and as long as that MA is not reclaimed to the upside, the trend remains bearish.
At the same time, momentum confirms this view.
The MACD has flipped bearish, which historically marks the transition from expansion into a corrective cycle.
In previous BTC cycles, the real bottom never formed until both conditions were met:
- MACD flips back bullish
- Price reclaims the moving average
Until that happens, we stay in a bearish or corrective regime, even if price bounces short term.
🧠 Now zooming out.
When you compare this structure to prior cycles, Bitcoin tends to:
• Correct deeply
• Find support at prior major resistance
• Reset momentum near long term demand
• Then flip trend again
On this chart, that area is very clear.
The green zone around 55k to 65k aligns with:
• Previous cycle highs
• Strong historical demand
• The lower boundary of the long-term rising structure
If history rhymes again, this is where we would expect:
• Momentum to stabilize
• MACD to start curling bullish
• Price to eventually reclaim the moving average
⏳ Timing wise , based on previous cycles, this process usually takes time.
That points toward late 2026, roughly October and beyond, not before.
⚠️ Disclaimer: This is not financial advice. Always do your own research and manage risk properly.
📚 Stick to your trading plan regarding entries, risk, and management.
Good luck! 🍀
All Strategies Are Good; If Managed Properly!
~Richard Nasr

2025 Ends With a Breakout?Year Ends With a Breakout, yes!🚀📈
Bitcoin just delivered what the market was waiting for — a clean breakout back into the channel 🎯
This is how we close the year… with intent.
Key Technicals:
• Major support holding at 88,273 – 88,535
• ATA 200 support confirmed
• Price reclaimed the channel → momentum shifts bullish
• 91,265 is the real breakout trigger
• Above that, 94k–95k comes into play
On the higher timeframe, Bitcoin still looks undervalued around 88k , with fair value closer to the ~101k zone . The market just needs to prove itself above 91k first — step by step, no rush.
Worst-case scenarios sit much lower, but that’s not the base case. Structure > fear.
Macro & Flow:
Banks, gold, and silver are heating up behind the scenes. Liquidity moves in cycles — and historically, some of that money always finds its way back to the best-performing asset . 🟠
Remember: be out under support (88k roughly-88200 exactly). Levels don’t negotiate.
Trading Wisdom 📜
Markets reward patience, not prediction.
AI reacts — humans interpret, adapt, and manage risk .
Trade levels, not emotions.
Disclaimer: Nothing I post is financial advice. It's perspective. I’ve mastered the art of prognosis, but you are the one behind the trigger. Always know your levels, and respect your risk.
One Love,
The FXPROFESSOR 💙

BTCUSDT: Range Compression Signals Potential Break Above $90,100Hello everyone, here is my breakdown of the current BTCUSDT setup.
Market Analysis
BTCUSDT is trading within a broader consolidation after a strong bearish impulse earlier in the chart. Following the sell-off, price found a key support base around the 87,300 Support Zone, from which buyers stepped in and stabilized the market. Since then, Bitcoin has been moving inside a series of well-defined ranges, indicating compression and balance between buyers and sellers. Structurally, price is capped by a descending triangle resistance line, while at the same time respecting a rising trend line from below. This creates a tightening structure, suggesting a potential directional move ahead.
Currently, BTC is consolidating above the support zone and just below the 90,100 Resistance Zone, which has repeatedly rejected price in recent attempts. The latest pullbacks remain shallow and corrective, showing that sellers are struggling to push price back below support.
My Scenario & Strategy
My primary scenario as long as BTCUSDT holds above the 87,300 Support Zone, the structure remains constructive and biased toward a bullish resolution. A sustained hold above support could allow price to build momentum for another push toward the 90,100 Resistance Zone. A clean breakout and acceptance above this resistance would confirm bullish continuation and open the door for further upside.
However, a decisive breakdown below the support zone would invalidate the bullish scenario and shift focus toward lower levels. For now, BTC remains compressed between support and resistance, with buyers defending structure and pressure building for a potential breakout.
That's the setup I'm tracking. Thank you for your attention, and always manage your risk.

Why Did XAUUSD Drop Sharply in the Latest Session?I don’t see this decline as abnormal. It is more the result of several factors aligning at the same time.
First, large-scale profit taking. Since the beginning of 2025, gold has gained more than 70%. As price approached the 4.55x area — a very strong psychological level — institutional money began locking in profits. Funds often distribute positions in a concentrated manner to optimize liquidity, which is why price dropped quickly instead of correcting gradually.
Second, the short-term macro backdrop has turned less supportive. The USD has seen a technical rebound, while US Treasury yields remain elevated around 4.1%, increasing the opportunity cost of holding gold. That alone is enough to create pressure when price is already in an overbought state.
Third, thin year-end liquidity. During the December 30–31 period, many funds have already closed their books. In such conditions, a single large sell order can push price much further than usual, making the move appear more aggressive than it actually is.
Finally, technical factors played a role. Price closed below the fast EMA, broke the short-term balance zone, and triggered stop-losses from trend-following long positions. This created a cascading sell effect that quickly dragged price down toward the 4.33x area.
The key takeaway: the larger structure remains intact. Price is still holding above the slower EMA and has not broken the H4 swing low around 4.28x–4.30x. Therefore, this move should be seen as a sharp correction within an uptrend, not a trend reversal signal.
Gold Starts 2026 with a Setup — Correction or New Rally Ahead?Wishing you all a Happy New Year 2026 in advance.
First and foremost, I wish you good health — because everything starts from there.
I hope your hearts feel lighter, your minds stay calm, and the new year brings many positive and meaningful moments into your lives.
May most of your trades end in wins, and may the money you earn through trading be used for joy, happiness, and beautiful memories.
I truly wish you a year filled with growth, peace, and reasons to smile.
------------------------------
As I previously expected, Gold( OANDA:XAUUSD ) has reached its targets (full target) and has now approached the resistance zone($4,382-$4,341).
From an Elliott Wave perspective, it seems that gold has completed a wave 5 with the help of an expanding ending diagonal pattern.
Additionally, we can observe a positive Regular Divergence (RD+) between two consecutive valleys.
I expect that after a correction, gold will once again test theresistance zone($4,382-$4,341) and could potentially climb at least up to $4,371. If it breaks through that resistance zone($4,382-$4,341), we could see gold rising further to around $4,421.
What do you think? Will gold repeat its bullish trend in 2026, or should we expect a correction? I’d love to hear your thoughts!
First Target: $4,371
Second Target: $4,421
Stop Loss(SL): $4,237(Worst)
Points may shift as the market evolves
💡 Please respect each other's opinions and express agreement or disagreement politely.
📌 Gold Analyze (XAUUSD), 1-hour time frame.
🛑 Always set a Stop Loss(SL) for every position you open.
✅ This is just my idea; I’d love to see your thoughts too!
🔥 If you find it helpful, please BOOST this post and share it with your friends.

Gold 30M – Support Hold After Strong Sell-Off Price broke the ascending trendline, showing **short-term bearish pressure** within a larger structure Strong support at 4,365–4,380**; holding this zone can trigger a corrective bounce.
* **Resistance at 4,430–4,445**; breakout above opens move toward 4,480–4,500 while a break below **4,360 invalidates the setup.

Gold Price Update – Clean & Clear ExplanationGold was in a strong bullish trend earlier, moving higher inside an ascending channel and making higher highs and higher lows. This shows that buyers were fully in control during that phase.
However, price recently faced strong resistance near the 4,395–4,430 area, from where heavy selling entered the market. This selling caused a sharp bearish drop, breaking below the rising trendline. This break indicates that short-term bullish momentum weakened.
After the strong fall, gold found support around the 4,350–4,330 zone, where buyers stepped in again. From this support, price started to recover and form a small bullish channel, suggesting a corrective move rather than a full trend reversal.
A strong breakout above this zone would signal trend continuation upward Neutral to slightly bullish as long as 4,360 holds Wait for confirmation — breakout or breakdown will define the next move.
If you find it please like and comments for this post and share thanks.

The Most Common Entry Mistake Traders Never NoticeMost traders do not lose because their strategy is flawed. They lose because they enter trades before the market has actually shown its intent. This mistake is subtle, easy to justify in the moment, and repeated so often that it becomes invisible. Over time, it slowly erodes consistency and confidence.
The problem usually starts with anticipation. Price approaches a key level, a wick forms, or a candle closes in the expected direction. The setup looks familiar, so the trader assumes the market is ready to move. But at that stage, nothing has been decided. The market is still neutral. What feels like early positioning is often just guessing inside uncertainty.
Markets do not move to reward speed. They move to collect liquidity. Before any meaningful expansion, price typically sweeps highs or lows, triggers stops, and tests obvious areas of interest. Traders who enter too early place themselves directly in this process. When price reverses and stops them out, it feels like bad timing, but structurally the market was doing exactly what it needed to do.
A key misunderstanding is believing that a level being touched equals intent. It does not. A reaction alone is not direction. Real intent only appears after the market responds with structure. This means a clear break in micro structure, decisive movement away from the level, and follow through that shows one side has taken control.
Another common trap is confusing speed with strength. Fast candles into a level can feel convincing, but aggressive moves without confirmation often lead to exhaustion rather than continuation. Strength is not defined by how quickly price reaches a level, but by what it does after that level is tested.
Confirmed entries are patient. Liquidity is taken first. Structure shifts second. Momentum expands third. Often, price returns to retest the area and prove acceptance. This sequence lowers risk and removes emotional pressure from execution.
Early entries are built on hope. Confirmed entries are built on evidence. Waiting does not make you late. It keeps you out of trades that were never ready to work.

BTC vs Silver: Is This a New Major Bottom?1️⃣ BTC/Silver at Channel Support = Where Big Bottoms Formed Before 📉➡️📈**
- Every time BTC/SILVER touched the bottom of this rising channel, a major bottom followed:
- 🦠 Covid crash → huge recovery after
- 🐻 Bear‑market low of the current cycle → next bull phase started
- 🔁 Today the ratio is again sitting on that same lower trendline, which suggests we might be near another major bottom zone, not the middle of a fresh long‑term collapse.
2️⃣ RSI at All‑Time Lows = Extreme Exhaustion
- The weekly RSI for BTC/SILVER is at record low levels on this chart.
- When momentum is this oversold:
- It usually means sellers are exhausted and positioning is very one‑sided.
- Historically, extremes in the BTC–silver ratio have often been followed by mean‑reversion moves back up as risk appetite slowly returns.
This doesn’t guarantee an immediate bounce, but it strongly hints that most of the pain vs silver might already be priced in.
3️⃣ A “Different” Bull Market → A “Different” Bear Market 🤔
- Past BTC cycles often had:
- A parabolic blow‑off top, then
- A brutal −70% to −80% drawdown from the all‑time high.
- This cycle was not the same:
- ETF flows, more institutions, and more macro‑driven behavior
- Less crazy vertical move than earlier cycles
- Heavy rotation into metals while BTC cooled off instead of pure mania
Because of this, the expectation here is:
- ❌ Not a face‑melting pump straight to 300k.
- ❌ Not necessarily a textbook −70% crash like in past winters.
- ✅ More likely a “different” bear market:
- BTC consolidates, underperforms metals and some stocks
- The BTC/SILVER ratio resets at the channel bottom
- Drawdown is milder and more sideways‑grindy than previous full‑on nukes
4️⃣ Final thought for positioning 🧠
- Be prepared in case BTC does a smaller bear market.
- And at the same time, don’t be over‑exposed in case BTC still delivers a standard deep bear market like past −70% drawdowns.
Balancing those two possibilities is the key: respect the historical risk, but also recognize that this cycle’s structure and the BTC vs silver chart hint at something *less brutal* than many fear.

Happy New Year XRP: These Events Set Up Major Moves for 2026.Hello There,
welcome to my new analysis about XRP. In recent times a very important dynamic with XRP caught my attention. Throughout 2025, major events happened that are setting up an important foundation for XRP and the upcoming year. These events are building major cornerstones that will have an enormous effect on the price action. From a fundamental and technical perspective, XRP is about to write an epic future.
When looking at my chart, you can watch this gigantic uptrend channel in which XRP has already several times bounced within the bullish accumulation zone marked in green. This zone was also the origin of XRP shooting to the moon in October 2024, marking the all-time high of $3.66. This major breakout was already part of the completion of this gigantic bullish triangle formation. Such a formation already completed once for XRP, being the origin of the historical upthrust.
While the MA structure is holding this whole trend to the upside, there are also key fundamental signs that reveal an underlying bullishness for XRP. One of them is that XRP just ended its year-long battle against the SEC. This makes way for a financial framework that does not ignore the positive prospects cryptocurrencies like XRP bring to the monetary market. The winning of this case makes XRP much more attractive for further investments and volume into the market.
Also, the launch of the XRP ETF on the 18th of September 2025 at CME has pumped massive volume into the market. In some minutes, millions and millions of dollars were pumped into the XRP network. The key element of an ETF, which makes XRP a much better investment for institutions, is a major milestone. Such an ETF event could be the beginning of historical price moves never seen before, similarly to what has been seen with other cryptocurrencies.
Technically speaking, XRP is now just about to confirm this gigantic triangle formation. An important factor here is the bounce from the upper boundary of the triangle. As seen in my chart, such a price move is supported by the moving averages, the lower boundary of the gigantic uptrend channel, and also the lower boundary of the triangle formation. This level is extremely important to hold; however, currently there are no signs of invalidation.
It will be an interesting journey ahead. And it will be particularly important to consider how XRP reacts to the main zones of support. In any case, it will be compelling to watch how these major levels will be approached.
Thank you very much for watching.

EURUSD Failed Break Above 1.1800 Opens Path to 1.1740Hello traders! Here’s my technical outlook on EURUSD (4H) based on the current chart structure. EURUSD is trading within a broader bullish structure after breaking above a descending resistance formation earlier on the chart, signaling a clear shift in market control from sellers to buyers. Following this breakout, price entered a consolidation phase, forming a well-defined range, which reflected temporary balance before trend continuation. The subsequent upside breakout from this range, supported by a rising trend line, confirmed renewed bullish momentum and continuation of the upward structure. Currently, price is testing a key Resistance Level near 1.1800, where a fake breakout has already occurred, suggesting potential exhaustion of buyers at the highs. This resistance aligns with a descending resistance line, increasing the probability of seller reaction. Below current price, the former resistance has flipped into a Support Level around 1.1740, overlapping with the Buyer Zone and the previous breakout area, making it a critical demand region. My scenario: as long as price is rejected from the 1.1800 resistance, a corrective move toward 1.1740 is likely (TP1). A clean breakdown below support would open the door for a deeper pullback. A confirmed breakout above 1.1800 would invalidate the short bias and signal further upside. Please share this idea with your friends and click Boost 🚀

Precious Metals Outlook for 2026Without any doubt, 2025 has largely been the year of precious metals (besides A.I).
Gold, silver, and later platinum dominated market narratives, with December standing out as a particularly explosive month — especially for silver and platinum.
And while making predictions for 2026 is inherently difficult — given how quickly fundamentals and geopolitics can shift — we can still extract a lot of insight from the charts and the broader technical context.
So let’s break down the current situation and outline the key scenarios going forward.
XAUUSD — Gold: A Sharp Correction Inside a Larger Bull Market
After printing a new All-Time High around 4550 on the second day of Christmas, the yellow metal faced a violent reversal.
On Monday, December 29th, the week opened with a major sell-off, and gold dropped nearly 2,500 pips from top to bottom.
Yesterday, the bulls attempted to regain control, but their efforts failed and the session closed as a continuation Pin Bar, signaling potential downside continuation.
At the time of writing, price is trading around 4320, testing and “flirting” with the rising trendline that started back in August.
If we see a genuine breakdown below this structure, the next technical downside targets could be:
- first zone: 4200
- extended correction target: 4050
These levels align with prior support clusters and psychological price areas.
However — and this is the key point — even if gold corrects toward the 4,000 zone, I do not expect a long-term trend reversal heading into 2026.
From my perspective, this move currently looks like:
👉 a healthy corrective phase inside a larger bullish cycle
Once gold finds a meaningful bottom and the correction runs its course, the most probable long-term scenario remains:
- trend continuation to the upside
- renewed bullish momentum during 2026
- and a potential move toward new All-Time Highs, possibly even above 5,000 zone, if market conditions align.
XAGUSD — Silver: Stronger Momentum & A More Explosive Upside Profile
November and December brought an extraordinary rally in silver, with price almost doubling in a very short period of time.
On Monday, December 29th, the market printed what looks very much like a blow-off top, followed by a sharp decline after reaching the 84 USD zone, a fresh ATH.
After such a dramatic rise — from 45 to nearly 85 in just two months — a correction is not only normal…
…it is healthy, necessary, and even welcome from a market structure perspective.
And as I have repeatedly stated over the past six months:
👉 My medium-to-long-term outlook remains more bullish on silver than on gold
Silver historically tends to outperform gold during later stages of a precious-metal bull cycle, and price behavior in 2025 fits that pattern quite well.
Once this corrective phase ends, I expect:
- the bullish trend to resume
- volatility to remain ETREMELY high
- momentum to shift back in favor of buyers
With a realistic upside projection toward:
➡️ 100 USD — or even higher — during 2026
For long-term investors and position traders, one key area I am watching closely (if the correction deepens) is the:
🔹 60–63 USD zone
This region may provide an attractive accumulation area for strategic long-term buying — assuming price stabilizes and confirms support there.
XPTUSD — Platinum: The Late-Year Explosion & A Deeper Pullback Zone
Platinum also delivered spectacular price action in December.
From around mid-month, price literally exploded upward, culminating in a new ATH near 2600.
At the moment, platinum is also inside a corrective phase — which is again perfectly normal after such an aggressive impulsive rally.
From my point of view, if the pullback extends further, a particularly interesting technical area to watch is:
🔹 around the 1600+ zone
This region may become a highly attractive level for long-term accumulation and potential buy-position setups — provided price confirms support and market conditions stabilize.
Final Thoughts — Corrections Don’t Cancel Bull Markets
Yes — corrections across precious metals currently look sharp and emotional.
But sharp corrections are a defining characteristic of major bull markets.
At this stage, nothing in the broader structure suggests a true long-term reversal. Instead:
- gold remains structurally bullish despite the pullback
- silver still shows stronger potential upside than gold
- platinum is entering what may become an attractive accumulation zone
2026 may still belong to precious metals — even if the path forward includes volatility, deep retracements, and periods of uncertainty.
As always, the market will have the final word — but technically, the broader narrative remains intact.
🚀
Happy New Year!
Mihai Iacob

Silver bulls are going to hate me for this...The chart is self explanatory...Blow of the top......wave 5 has been done expecting it to settle around 40 usd...where the actual demand is not FOMO....

XAUUSD: Bullish Trend Remains Intact in Rising ChannelHello everyone, here is my breakdown of the current XAUUSD (Gold) setup.
Market Analysis
Gold has confirmed a bullish shift after breaking out of a prior triangle structure, where price was previously compressed between descending resistance and ascending support. This breakout marked a clear change in market structure and initiated a strong impulsive move higher. After the breakout, price transitioned into a consolidation range, indicating temporary balance before continuation.
Currently, XAUUSD established a clear upward channel, respecting both the lower channel support and the ascending trend line. This structure confirms sustained bullish momentum with higher highs and higher lows. Price has continued to trend higher and recently pushed into a key Resistance Zone, where the market is currently showing signs of reaction and testing supply. Below current price, the former resistance has flipped into a well-defined Support Zone, which aligns with the prior breakout level and the lower boundary of the upward channel. This area has already shown buyer response, reinforcing its importance as a demand zone within the bullish structure.
My Scenario & Strategy
My primary scenario remains bullish as long as XAUUSD holds above the Support Zone and respects the upward channel structure. I expect buyers to defend this area and attempt another push toward the Resistance Zone. A successful breakout and acceptance above resistance would confirm continuation of the bullish trend and open the path toward higher targets.
However, a strong rejection at resistance followed by a breakdown below the support zone would weaken the bullish structure and suggest a deeper correction or consolidation. For now, price action continues to favor buyers while the ascending structure remains intact.
That’s the setup I’m tracking. Thank you for your attention, and always manage your risk.

XAUUSD Short: Trend Line Break Signals Downside ContinuationHello traders! Here’s a clear technical breakdown of XAUUSD (3H) based on the current chart structure. Gold previously traded inside a well-defined range, indicating a phase of accumulation before buyers gained control. From this range, price broke out to the upside and followed a rising trend line, confirming a strong bullish impulse and a clear shift in market structure. The trend remained intact as price continued to form higher highs and higher lows.
Currently, gold is trading below the broken trend line and moving toward the Demand Zone near 4,320, which aligns with a previous breakout area and an important horizontal reaction level. Below this area lies the next Demand Zone around 4,270, which represents the next key downside target if selling pressure continues. The move lower appears impulsive, suggesting that the market is entering a corrective or reversal phase rather than a simple pullback.
My scenario: as long as XAUUSD remains below the Supply Zone and stays under the broken trend line, the bias favors sellers. I expect continuation to the downside toward the 4,320 Demand Zone, with a possible extension to 4,270 if bearish momentum remains strong. A strong bullish reaction from demand could lead to short-term consolidation, but without reclaiming the trend line, any upside remains corrective. Manage your risk!
