Strategic Trading Tips Before the Bitcoin HalvingAs the market faces economic challenges, Bitcoin ( BYBIT:BTCUSDT.P ) and the S&P 500 ( TVC:SPX ) are showing signs of a potential correction after significant recent gains over the last 12 months. This shift is prompting investors to reassess and strategically reallocate their assets.
In this environment, PAX Gold ( BYBIT:PAXGUSDT.P ), a digital asset backed by gold, is emerging as an increasingly attractive investment option due to its stability during uncertain times. Additionally, the strengthening of the US dollar ( TVC:DXY ) is indicating a shift towards more stable assets, reflecting a broader risk-averse sentiment in the market.
Strategic Recommendations for Bybit Traders
Add PAXGUSDT to Your Portfolio: Leveraging the stability of gold-backed assets such as PAXG can provide a hedge against the volatility observed in both cryptocurrency and traditional financial markets.
Reduce Altcoin Exposure: Reducing your altcoin holdings can help mitigate risk, especially considering their tendency to experience amplified downward movements during Bitcoin corrections. However, for those comfortable with risk, there may be an opportunity to buy in at lower prices, potentially yielding significant gains if the market rebounds.
Buy BTC at Support Levels: Considering the upcoming Bitcoin halving, which may mitigate some of the potential downtrends by reducing the supply of new coins, buying BTC at current lower levels could be advantageous if the price increases post-halving.
Leverage USD Strength: With the US dollar growing stronger, it’s strategic to maintain or increase your cash positions. This could involve making new deposits, taking profits, or utilizing Bybit Earn products to take advantage of market changes.
Consider Options: Instead of just holding spot or trading perpetual contracts, also consider trading options to manage risk while benefiting from market exposure.
Reassess Risk of Existing Positions: If you're holding underwater leveraged positions, it may be a good time to reassess your overall risk and adjust your position size or margin accordingly to better withstand any potential further downward movements until a reversal occurs.
These strategies are designed to balance risk management with the potential for returns, adapting to a market that is increasingly shifting towards more conservative investment approaches.
Remember, trading cryptocurrencies, especially with leverage, carries significant risks. Employ solid risk management practices to protect your investments.
Search in ideas for "BYBIT"

ETH | ByBit HACK causes MASSIVE SELL-OFFBybit got hit with a serious security breach.
$1.4 billion was hacked in Ethereum, which is a huge amount of ETH. 2 Apparently the trouble started with their cold wallet, where they keep a lot of their crypto offline. The investigation points to the North Korean Lazarus Group as the likely culprits, and it seems the attack originated from some malicious code within their wallet provider, Safe Wallet.
Currently there's a big push to track down the stolen funds, and Bybit's even offering a bounty, but it's unlikely the funds will be recovered. It's important to understand that this wasn't necessarily a fault of Bybit's own security, but rather a problem with the wallet provider they were using.
Bybit has reassured users that withdrawals remain unaffected and other cold wallets are secure. While investigations into the incident continue, early speculation about Bybit buying back ETH to cover losses, which briefly boosted ETH's price, was dispelled by CEO Ben Zhou. He clarified that a bridge loan covered 80% of the stolen ETH, and there are no plans for spot market purchases. The hackers now holds a substantial amount of ETH across multiple wallets, raising concerns about potential drops should they decide to sell, but this may occur gradually over many months or even years (since they didn't buy it / it will not matter at what price it is sold).
This hack coincides with ETHDenver, a major Ethereum event typically associated with bullish market conditions and optimism. But overall, the outlook for Ethereum isn't looking as bright as it usually would be and this may lead to a further sell-off once more people catch on.
_________________
BINANCE:ETHUSDT

December22 Bitcoin Bybit chart analysis
Hello.
“Make it simple, make profit”
It’s BitcoinGuide.
Don’t forget to
“Follow” me and press “Likes”.
If you "follow" press,
Only 30 Min chart ,
In real time, you can check major sections and move,
Real-time "update I dea" can be checked.
I will begin BTCUSD Bybit Bitcoin Chart Analysis for December 22.
Bitcoin 4 hour chart.
Today's approximate top price and bottom price are displayed.
centered around the purple support line
Red upward / sky blue downward movement path check
I created today's trading strategy.
This is a one-way long position strategy on the 30-minute chart.
In the case of Bitcoin
I haven't touched the support line for 30 minutes today.
Touch completed up to the 1-hour resistance line.
The 30-minute chart progressed to the MACD dead cross.
12 Hour / Daily Chart MACD Golden Cross is waiting
It becomes a condition for strong rise.
Please pay attention to the movement up to the top section according to the Nasdaq purple support line.
In terms of the Ichimoku equilibrium, when the purple support line breaks
Since the support line is open, it can fall strongly,
A short position is an advantage.
Within the convergence zone of the red resistance line / light blue support line
If there is no movement, it is sideways.
(when the main price is represented near the support resistance line)
*At the red arrow path
long position strategy
1. $16823.5 long position entry section / stop loss when breaking the light blue support line / $17221 long position target
Variables may come out in the indicator announcement at 10:30 today
In the case of Nasdaq, because the situation is similar to Bitcoin.
It's not good to be pushed from your current position.
Please note that my analysis is only for reference and use.
I hope you operate safely with principle trading / stop loss essential
thank you.

I just opened a long on bybit!I opened a long position on bybit to trade this one with a 10x position. TK is 51k. Hope you can follow me.
bye.

BTCUSD Bybit Chart Analysis December 18
Hello,
“Make it simple, make profit”
It’s BitcoinGuide.
Don’t forget to
“Follow” me and press “Likes”.
If you "follow" press,
Only 30 Min chart ,
In real time, you can check major sections and move,
Real-time "update I dea" can be checked.
I will begin BTCUSD Bybit Bitcoin Chart Analysis for December 18th .
This is a 30-minute chart created yesterday.
For those who have not yet entered,
I made an entry spot,
But, breathtakingly,
couldn't touch the entry spot.
Did you successfully enter?
Adjustment occurs at the green resistance line ->
After The green support line was broken.
Yesterday , All altcoin also showed a good move.
Congratulations to all the profitable people.
4 hours chart.
About this much today? Will there be any movement
I think
Simple isn't it?
Yesterday, because there was some movement,
Fortunately, chart analysis will be easy.
Focusing on this part,
I have a trading strategy.
This is a 30-minute chart.
It's a long position strategy.
Around the red support line ,
It seems that the direction of the day will be decided.
Up to the green support line.
At the current location,
*Arrow section long position strategy
*Blue finger short -> long -> short ->long switching strategy.
When the Highest section is broken,
Strong adjustments can be made.
Blue fingers
The whip saw can come out strong, but be careful.
If only the maximum and green support lines are not deviated
It looks okay today.
It is a spot exchange.
Overall, the atmosphere is so good.
Although it doesn't seem to mean much to recommend altcoins,
If you dare recommend it.
According to the Bitcoin movement
In the long position entry section,
Safely today,
Ethereum, Bitcoin Cash
Aggressively
Ripple, Ada, Bitcoin SV
It looks good.
The analysis is only written so far,
See you in the Nasdaq analysis in the afternoon.
Thank you for reading again today.

#BTCUSDT #1h (ByBit) Descending trendline breakoutBitcoin seems to have found bottom and is forming a local uptrend, looks good for bullish continuation after regaining 100EMA support.
⚡️⚡️ #BTC/USDT ⚡️⚡️
Exchanges: ByBit USDT
Signal Type: Regular (Long)
Leverage: Isolated (13.0X)
Amount: 4.9%
Current Price:
57720.9
Entry Targets:
1) 57411.4
Take-Profit Targets:
1) 60987.5
Stop Targets:
1) 55618.9
Published By: @Zblaba
CRYPTOCAP:BTC BYBIT:BTCUSDT #1h #Bitcoin #PoW bitcoin.org
Risk/Reward= 1:2.0
Expected Profit= +81.0%
Possible Loss= -40.6%
Estimated Gaintime= 2-3 days

#BTC/USDT 2D (ByBit) Rising wedge breakdown and retestBitcoin is facing historical supply zone and seems likely to get rejected on it, especially with that overbought RSI.
Probably wise to hedge short towards 100EMA support for the months to come.
⚡️⚡️ #BTC/USDT ⚡️⚡️
Exchanges: ByBit USDT, Binance Futures
Signal Type: Regular (Short)
Leverage: Isolated (4.0X)
Amount: 4.9%
Current Price:
33884.4
Entry Zone:
34464.6 - 36135.0
Take-Profit Targets:
1) 30982.8
1) 27731.6
1) 24480.3
Stop Targets:
1) 38912.3
Published By: @Zblaba
CRYPTOCAP:BTC BYBIT:BTCUSDT.P #Bitcoin #PoW bitcoin.org
Risk/Reward= 1:1.2 | 1:2.1 | 1:3.0
Expected Profit= +48.9% | +85.8% | +122.6%
Possible Loss= -40.9%
Estimated Gaintime= 2-5 months

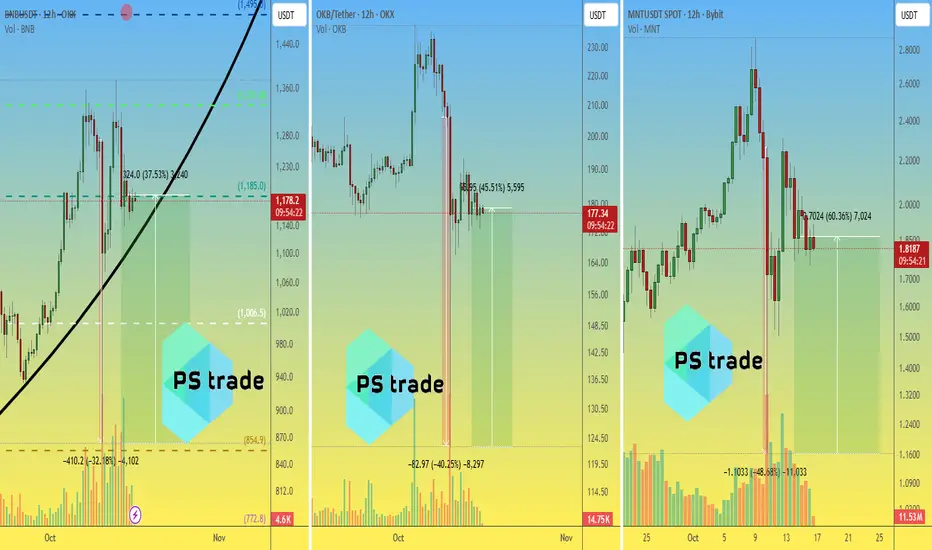
BNB (Binance) vs OKB (OKX) vs MNT (Bybit)🔥 While the whole market is trembling again ahead of Trump’s highly anticipated evening speech (19:00 UTC)…
Let’s take a look at how the tokens of the TOP-3 CEX exchanges by trading volume behaved during the “night of 10.10” — and how much they’ve bounced back 5 days later 👇
📉 Drop → 📈 Rebound (as of now):
OKX:BNBUSDT –32.2% (–$410) → +37.5% (+$324)
OKX:OKBUSDT –40.2% (–$83) → +45.5% (+$56)
BYBIT:MNTUSDT –48.7% (–$1.1) → +60.4% (+$0.7)
Seems like the market still hasn’t decided which exchange token deserves more love 💥
🤔 Who’s your favorite right now — #BNB, #OKB or #MNT ?
______________
◆ Follow us ❤️ for daily crypto insights & updates!
🚀 Don’t miss out on important market moves
🧠 DYOR | This is not financial advice, just thinking out loud
#LOOM/USDT 4h (ByBit) Ascending channel on supportLoom Network is sitting on 100EMA, seems likely to bounce back towards mid-line.
⚡️⚡️ #LOOM/USDT ⚡️⚡️
Exchanges: ByBit USDT
Signal Type: Regular (Long)
Leverage: Isolated (2.2X)
Amount: 5.0%
Current Price:
0.233592
Entry Targets:
1) 0.223110
Take-Profit Targets:
1) 0.304470
Stop Targets:
1) 0.182440
Published By: @Zblaba
$LOOM BYBIT:LOOMUSDT.P #LoomNetwork loomx.io
Risk/Reward= 1:2.0
Expected Profit= +80.2%
Possible Loss= -40.1%
Estimated Gaintime= 2-4 days

BTCUSD Bybit Bitcoin Chart Analysis for January 23th
Hello,
It’s BitcoinGuide.
Happy new year and wish you all good luck.
As it is national holiday in Korea this weekend, I thought of something nice to give for you all.
And I found out 5 items for minor altcoins that would come out well.
Please refer to this for this weekend. And I will update 5 items at 8PM tonight.
I recommend you to refer to it.
Please don’t forget to “Follow” me and press “Likes”.
I will begin BTCUSD Bybit Bitcoin Chart Analysis for January 23th
This is 30m candle chart for yesterday.
It was long position strategy.
It went up without any wave pattern.
And the price went for a correction right at the red finger pointer timing.
And it went slowly downward.
Daily candle chart’s dead cross is suppressing.
So it could not go up until the CME Gap.
After the price ended up drifting sideways.
As mentioned yesterday,
I recommended you to operate minor altcoins before Bitcoin goes for a new high.
Hope you had a nice result from this.
I expected rise in Bitcoin so I entered major altcoins, and I’m stuck in long position for Bitcoin.
If it turns out bad, I just have to cut the loss and start again.
If I do well, I believe I would have additional spare time.
This is daily candle chart.
We are at about $8,600.
MACD Dead Cross is ongoing.
Please remember the price point here.
I’ve also checked out $8,343 price point.
I brought a strategy based on this.
This is 30m candle chart.
As you can see, the chart simply looks like short position.
However I brought long position strategy.
I do not set wide range of entry points, nor do I make excuses for any movement.
I have just entered another long position.
The reason for entering long position is because,
The price touched supporting lines for 1H/2H/3H/4H candle charts.
And now we are at position where the dangerous signal is made for every timeframe except daily candle chart.
Soon we will see new 4H candle for Bybit.
I will set stop loss for the bottom line for the candle now.
If we happen to cut the loss, we will just have to enter at the right next moment.
Also, if it goes down slowly, please check out minor altcoin’s movement.
I do not like the rebound for now.
I’ve checked out route A & B.
And there are lots of things to happen for a rebound today.
The red finger pointers are entry timings for short position.
And we must see a movement following route A with a set pattern.
If not, the price might fall until $8,300.
If the price goes down below this with an additional candle, it would fall slowly down.
If it does, please call it a day with no position for today.
Please operate with minor altcoins.
It seems we do not have much chance for a rebound.
But I refrain from chasing. And we have an evidence for a rebound.
So I will close the position after a rebound and concentrate on short position.
It is long -> short switching strategy.
Instead, if we see the price going above smile face line, the market will be very exciting.
If the price goes down, please cut the loss and cope with another chance at next position.
(Today we have long position strategy, and do not chase for short position)
Hope you have a nice weekend and wish you all good luck.
Thank you.
(Translation
Jae Ho Shin)

January 23th BTCUSD Bybit Bitcoin Chart Analysis
Hello,
It’s BitcoinGuide.
Happy new year and wish you all good luck.
As it is national holiday in Korea this weekend, I thought of something nice to give for you all.
And I found out 5 items for minor altcoins that would come out well.
Please refer to this for this weekend. And I will update 5 items at 8PM tonight.
I recommend you to refer to it.
Please don’t forget to “Follow” me and press “Likes”.
I will begin BTCUSD Bybit Bitcoin Chart Analysis for January 23th
This is 30m candle chart for yesterday.
It was long position strategy.
It went up without any wave pattern.
And the price went for a correction right at the red finger pointer timing.
And it went slowly downward.
Daily candle chart’s dead cross is suppressing.
So it could not go up until the CME Gap.
After the price ended up drifting sideways.
As mentioned yesterday,
I recommended you to operate minor altcoins before Bitcoin goes for a new high.
Hope you had a nice result from this.
I expected rise in Bitcoin so I entered major altcoins, and I’m stuck in long position for Bitcoin.
If it turns out bad, I just have to cut the loss and start again.
If I do well, I believe I would have additional spare time.
This is daily candle chart.
We are at about $8,600.
MACD Dead Cross is ongoing.
Please remember the price point here.
I’ve also checked out $8,343 price point.
I brought a strategy based on this.
This is 30m candle chart.
As you can see, the chart simply looks like short position.
However I brought long position strategy.
I do not set wide range of entry points, nor do I make excuses for any movement.
I have just entered another long position.
The reason for entering long position is because,
The price touched supporting lines for 1H/2H/3H/4H candle charts.
And now we are at position where the dangerous signal is made for every timeframe except daily candle chart.
Soon we will see new 4H candle for Bybit.
I will set stop loss for the bottom line for the candle now.
If we happen to cut the loss, we will just have to enter at the right next moment.
Also, if it goes down slowly, please check out minor altcoin’s movement.
I do not like the rebound for now.
I’ve checked out route A & B.
And there are lots of things to happen for a rebound today.
The red finger pointers are entry timings for short position.
And we must see a movement following route A with a set pattern.
If not, the price might fall until $8,300.
If the price goes down below this with an additional candle, it would fall slowly down.
If it does, please call it a day with no position for today.
Please operate with minor altcoins.
It seems we do not have much chance for a rebound.
But I refrain from chasing. And we have an evidence for a rebound.
So I will close the position after a rebound and concentrate on short position.
It is long -> short switching strategy.
Instead, if we see the price going above smile face line, the market will be very exciting.
If the price goes down, please cut the loss and cope with another chance at next position.
(Today we have long position strategy, and do not chase for short position)
Hope you have a nice weekend and wish you all good luck.
Thank you.
(Translation
Jae Ho Shin)

only for bybit btc / usd small and fast tradeonly for bybit btc / usd
small and fast trade sells on the red line buy on the green put profit 1% and stop loss 0.33% if the price crosses the blue line stops trade this chart you can register in the trading view to quickly see the signals

ETHUSD Long Bybit 3Hr, 1200% Net Profit Automated hello traders,
still on a long on ETHUSD with XProfit and Automated system on Bybit.
Already in low profit. around 3-4%
Let's wait and see how this trade develops. This resistance box would be a perfect take profit level.
happy trading

December 27 BTCUSD Bybit Chart Analysis
Hello,
it’s BitCoinGuide.
Hope you are doing well.
Please don’t forget to “Follow” me and press “Likes”.
I will begin BTCUSD Bybit Chart Analysis for December 27th
This is 30m candle chart for yesterday.
I’ve deleted unnecessary parts.
After the price went up along with route A, I’ve pointed out the orange trend line below and $7,261 price point. And you can also check out the converging section between them.
The price had a rebound at the location where red finger pointer is at. It broke out $7,261 strongly and then touched the smile face line once with a correction.
The price correction was stronger than expected. I also emphasized several times how to cope with the situation in real time. So I believe you must have dealt with it well.
It was about $260 movement.
Congratulations.
Yesterday my trading strategy for BTCUSD & USDCAD was turned out to be perfect, however, the actual trading ended up with stop-loss.
It was very hard to do the live streaming and simultaneously do my trading.
I had to show you and explain about everything. So lack of time enabled me to freely switch and change my positions for the trading.
If I were not able to analyze, I won’t be regretful.
But not being able to just follow the perfect strategy I’ve made was a bit irritating.
However, It’s my decision so I have to deal with it.
This is BTCUSD daily candle chart.
The new candle is made right at the middle line of Bollinger band.
And today is the last day for CME futures.
We often see two kinds of movement on the last day.
A strong movement comes out when the balance is broken.
Or the price ends up with drifting sideways.
Currently we have a candle precisely at the middle line.
So I brought a strategy based on this.
This is 30m candle chart for today.
I will briefly explain.
1. Please check route A & B with entry timing / A’s long position entry timing / B’s short position entry timing with the price point ($7,273)
2. Route A : Please check whether the price goes down below the entry point.
If it does please follow route B / Carefully check whether the price touches the final smile face line
3. Route B : Please check whether the price goes down below $7,161 with an additional candle
If it does, please enter short position / When the price falls at this point, it could go down to $6,800
4. Finally check out the bonus entry points, blue finger for route A and red finger for route B
This is it.
I’ve indicated converging section between two orange trend lines. So I hope you cope well with it.
Hope you have a good day.
I will come back to you with FX margin trading, overseas futures analysis.
Thank you.
(Translation
Jae Ho Shin)

BTCUSD Bybit Chart Analysis December 27
Hello,
it’s BitCoinGuide.
Hope you are doing well.
Please don’t forget to “Follow” me and press “Likes”.
I will begin BTCUSD Bybit Chart Analysis for December 27th
This is 30m candle chart for yesterday.
I’ve deleted unnecessary parts.
After the price went up along with route A, I’ve pointed out the orange trend line below and $7,261 price point. And you can also check out the converging section between them.
The price had a rebound at the location where red finger pointer is at. It broke out $7,261 strongly and then touched the smile face line once with a correction.
The price correction was stronger than expected. I also emphasized several times how to cope with the situation in real time. So I believe you must have dealt with it well.
It was about $260 movement.
Congratulations.
Yesterday my trading strategy for BTCUSD & USDCAD was turned out to be perfect, however, the actual trading ended up with stop-loss.
It was very hard to do the live streaming and simultaneously do my trading.
I had to show you and explain about everything. So lack of time enabled me to freely switch and change my positions for the trading.
If I were not able to analyze, I won’t be regretful.
But not being able to just follow the perfect strategy I’ve made was a bit irritating.
However, It’s my decision so I have to deal with it.
This is BTCUSD daily candle chart.
The new candle is made right at the middle line of Bollinger band.
And today is the last day for CME futures.
We often see two kinds of movement on the last day.
A strong movement comes out when the balance is broken.
Or the price ends up with drifting sideways.
Currently we have a candle precisely at the middle line.
So I brought a strategy based on this.
This is 30m candle chart for today.
I will briefly explain.
1. Please check route A & B with entry timing / A’s long position entry timing / B’s short position entry timing with the price point ($7,273)
2. Route A : Please check whether the price goes down below the entry point.
If it does please follow route B / Carefully check whether the price touches the final smile face line
3. Route B : Please check whether the price goes down below $7,161 with an additional candle
If it does, please enter short position / When the price falls at this point, it could go down to $6,800
4. Finally check out the bonus entry points, blue finger for route A and red finger for route B
This is it.
I’ve indicated converging section between two orange trend lines. So I hope you cope well with it.
Hope you have a good day.
I will come back to you with FX margin trading, overseas futures analysis.
Thank you.
(Translation
Jae Ho Shin)

December 31 BTCUSD Bybit Chart analysis
Hello,
it’s BitcoinGuide.
There were lots of things in 2019.
I wish I could have done better, as I sincerely appreciate all your supports always.
I will continue all my efforts next year too.
Wish you all good luck and happy new year.
Today, don’t forget to “Follow” me and press “Likes”.
I will begin BTCUSD Bybit Chart analysis for December 31th
This is analysis for yesterday.
It was route B movement.
I’ve also mentioned about orange trend line.
As the price went down below the converging section, it dropped until the target point.
The price precisely touched the weekend gap difference and had a rebound.
It was about $170 movement. Congratulations.
This is 4H candle chart.
There was a weak rebound in the morning.
And I brought a strategy based on this.
This is 30m candle chart.
I will briefly explain.
1. Please refer to route A & B with A’s long position entry timing / B’s short position entry timing / with each price point of $7,242
2. In case of route A, please check it does not go down below the long position point
(If it does, follow route B) Finally, check whether the price touches final smile face line. We are at safe zone at this point
3. In case of route B, please check the price goes above short position point. (Typical short position entry point). If it does not go down, please check out route A. When the price goes down below green parallel line with an additional candle, please enter short position
This is it.
I’ve indicated 2 blue finger pointers, red finger pointer as bonus points.
Hope you cope well with it.
Hope you have a good day.
I will come back to you with FX margin trading, overseas futures analysis in the afternoon.
Thank you.
(Translation
Jae Ho Shin)

BTCUSD Bybit Bitcoin Chart Analysis August 11th
Hello,
“Make it simple, make profit”
It’s BitcoinGuide.
Don’t forget to
“Follow” me and press “Likes”.
I will begin BTCUSD Bybit Bitcoin Chart Analysis for August 11th .
This is a 30-minute chart organized yesterday.
Orange Up to the gap difference on weekends,
There was a strong fall.
After that, it breaks the green resistance line,
It is finished.
It is a daily chart.
At the bottom, waiting for MACD dead cross,
Orange line, before and after touch
I created a trading strategy.
This is today's trading strategy.
It's a 30-minute chart, a neutral strategy.
Centering on the orange line,
each ,
Blue path
Check the red route.
In blue, it is operated as a bitcoin related coin.
If it is red, please operate it as a major altcoin.
Thank you.

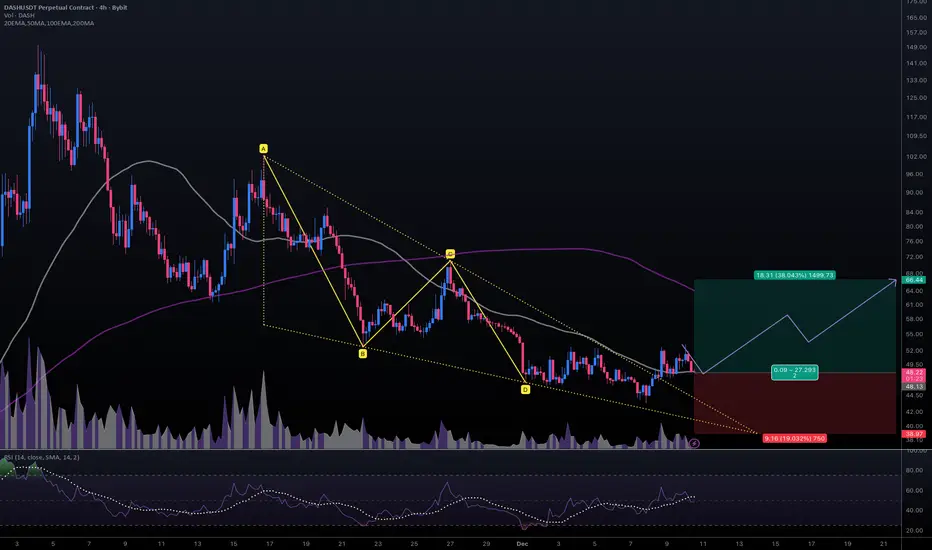
#DASHUSDT #4h (ByBit) Falling wedge breakout and retest [LONG]Digital Cash is pulling back to 50MA regained support where it seem likely to bounce towards 200MA resistance.
⚡️⚡️ #DASH/USDT ⚡️⚡️
Exchanges: ByBit USDT
Signal Type: Regular (Long)
Leverage: Isolated (2.0X)
Amount: 5.3%
Current Price:
48.22
Entry Targets:
1) 48.13
Take-Profit Targets:
1) 66.44
Stop Targets:
1) 38.97
Published By: @Zblaba
CRYPTOCAP:DASH BYBIT:DASHUSDT.P #4h #DigitalCash #Privacy dash.org
Risk/Reward= 1:2.0
Expected Profit= +76.1%
Possible Loss= -38.1%
Estimated Duration= 1-2 weeks
#EDUUSDT #1D (ByBit) Descending trendline breakout and retestOpen Campus is pulling back to 100EMA regained support where it seems likely to bounce and recover midterm.
⚡️⚡️ #EDU/USDT ⚡️⚡️
Exchanges: ByBit USDT
Signal Type: Regular (Long)
Leverage: Isolated (1.0X)
Amount: 5.1%
Current Price:
0.1598
Entry Targets:
1) 0.1587
Take-Profit Targets:
1) 0.3456
Stop Targets:
1) 0.0963
Published By: @Zblaba
NYSE:EDU BYBIT:EDUUSDT.P #1D #OpenCampus #Education opencampus.xyz
Risk/Reward= 1:3.0
Expected Profit= +117.8%
Possible Loss= -39.3%
Estimated Gaintime= 2-3 months

#TAOUSDT #4h (ByBit) Ascending trendline near breakdownBittensor printed an evening doji star deviation, a retracement down to 200 MA support seems next.
⚡️⚡️ #TAO/USDT ⚡️⚡️
Exchanges: ByBit USDT
Signal Type: Regular (Short)
Leverage: Isolated (5.0X)
Amount: 5.0%
Entry Targets:
1) 430.38
Take-Profit Targets:
1) 362.01
Stop Targets:
1) 464.64
Published By: @Zblaba
GETTEX:TAO BYBIT:TAOUSDT.P #4h #Bittensor #AI #DePIN bittensor.com
Risk/Reward= 1:2.0
Expected Profit= +79.4%
Possible Loss= -39.8%
Estimated Gaintime= 1 week

#BSVUSDT #1D (ByBit) Falling wedge breakoutBitcoin Satoshi Vision is pulling back to 100EMA daily support where it seems likely to bounce and resume bullish, mid-term.
⚡️⚡️ #BSV/USDT ⚡️⚡️
Exchanges: ByBit USDT
Signal Type: Regular (Long)
Leverage: Isolated (2.0X)
Amount: 4.5%
Entry Targets:
1) 38.05
Take-Profit Targets:
1) 63.54
Stop Targets:
1) 29.54
Published By: @Zblaba
AMEX:BSV BYBIT:BSVUSDT.P #BitcoinSatoshiVision #PoW
Risk/Reward= 1:3.0
Expected Profit= +134.0%
Possible Loss= -44.7%
Estimated Gain-time= 2 months

OSC issues sanctions against Bybit and KuCoinCanadian regulatory body, Ontario Securities Commission (OSC), has announced financial sanctions against two crypto exchanges. According to the details of the statement, the regulator leveled these sanctions against Bybit and KuCoin. In its statement, the regulatory body mentioned that both entities were guilty of running an unregistered crypto entity while providing services to residents of the country and violating some of the securities laws.
The exchanges were slammed with financial charges
In the announcement made available some hours ago, OSC mentioned that it had explicitly prayed a court to grant an order to remove KuCoin from the capital market. In addition to that sanction, the regulator also said it had fined the crypto exchange over $1.5 million for misdeeds. In the same vein, the regulator also mentioned that it was able to come to a gentleman’s agreement with Bybit, but the exchange also released more than $2 million in disgorgement.
In addition, the exchange was also levied with a payment of more than $7000 for all the efforts and financial resources that OSC used during the investigations. Although both firms were said to have gone against the rule of the securities commission, the body mentioned that Bybit was the only one out of the two that wanted to correct its error. During the investigation, it opened a direct line to talk to the body and discussed how it could go about the registration process.

#AIXBTUSDT #4h (ByBit) Descending trendline breakout$AIXBT just regained 100EMA support and looks ready for short-term recovery.
BYBIT:AIXBTUSDT.P aixbt.tech
