Bitcoin: Analysis
31D: Candlestick analysis suggests that the bull market is over if this candle closes <= 1/2 way into the previous large white real body. There is significant demand between 8450-7450. Panic selling will likely drag price into this range, providing the ideal buying opportunity. Assuming a bullish candlestick reversal pattern in this range seems warranted. If this plays out we would find ourselves in a box range between 14K & ~8450. Swing Trading paradise would start there. Assuming anything less than 7450 appears unwarranted at this point.
1W: EMA 17/34 have been significant Phi support and it appears that the former is failing. This suggests EMA 34, 8125 as the next buy target. The previous bullish attempt was extremely weak. MACD's stairway-down descend suggests to me that bear supply has not yet entered the market. I expect a high-volume panic as we lose EMA 17. We are likely witnessing the loss of the Fisher Transform 0.0 line with an expanding Bollinger Band. Expecting a -3 deviation seems reasonable, also seeing as iFish has not yet reached the OS region.
1D: The nearest (knife-catching) area based on strong Phi support is likely at 9050. I would suggest that this would be a bounce to test TDST 9555 (broken) support / Change of Polarity. This knife-catching level is supported by a previous Morning Star ~45 days ago, at 9050. We have broken below the significant Phi EMA 72. Assuming range/swing conditions between Phi 72 and (higher significance) 144 seems warranted. Descending Phi 17 EMA suggest a pass-or-fail breakout test within the next week.
m15: The continuous anemic bullish attempts have clearly failed. The only reasonable outcome here appears to be panic selling into the 9K psychological area.
Search in ideas for "CANDLESTICK"

Apple Dark Cloud Cover CandlesAAPL Today completed formation of a Dark Cloud Cover candlestick pattern. See attached diagrams for explanations. According to some research, this pattern results in a down day the next day 60% of the time, while up the next day only 40% of the time. Obviously there is no sure bet in this game, but I'll take 60/40 odds over 50/50 every day of my life. In any event, happy hunting and GLTA! www.feedroll.com tutorials.topstockresearch.com

Interday Short- Great ReversalShorting ANGO 3/4/2019
Entry: 23.24$ at 15:53 NY Time.
Stop Size: 0.19$
Result: R/R 1:2
Trade Idea:
Interday Reversal strategy (Powerful stock in the interday, "Healthy"
Fibonacci Retracement, Price Retracing to a resistance level, Candlestick pattern Trigger).
Tools: VWAP, EMA20, Pivot Points.
Trigger: Dark Cloud Cover Candlestick pattern on the VWAP.
Planning:
R/R Calculation: Almost 1$ Range to the low of the day, 0.19$ Stop
Potential R/R is 1:5
First Target at 1:2
Second Target: Progress Stop loss on top of every 5 minutes candle
Result: Reached 1:2 First Target, Stopped out on the first 5 minutes candle (22.99$)

S&P ShortIn my previous post on S&P, I mentioned to prepare shorting S&P and gave 2 potential price reversal targets. Now I am calling for the actual short as price has reversed yesterday the 2nd price target.
I will give you additional confidence with 2 candlestick formation on 2 different timeframe:
1. On the weekly time frame, we have a shooting star:
2. On the daily time frame, we have a bearish engulfing candle:
Note that in my previous post, I mentioned that this wave 5 will NOT reach S&P previous high due to wave 3 being overly-extended. With Elliott Wave Analysis, Fibonacci extension analysis (found in my previous post), weekly and daily candlestick patterns, I am certain that S&P will fall and it is still early time to short it now. Place your stop just above the high of the last 2 candles (2866) and you should do well. The price target is conservative since I am expecting a reversal on the super cycle scale.
P/S: Note that I deleted one post made a few mins earlier because I didn't update my wave counts and also didn't give the evidence on the weekly. But it is still calling for S&P short. Just wanted to be more comprehensive here :)

Week 9 Trade 1 GA LongReasons for entry:
- Price is currently on a uptrend
- Price has rejected and retested the 61.8 fib
- Possible hammer candlestick forming on the 4hr, weak hammer candlestick already formed on the 2hr
- Strong bullish engulfing on the 30min timeframe
Entry Timeframe:
- 30 min bullish engulfing
- @1.8240
Stop Loss:
@1.8200 (-40pips)
Take Profit:
- Target 1 @1.8400 (+160pips) = Risk/Reward : 1:4.1
- Target 2 @1.8550 (+310pips) = Risk/Reward : 1:7.9
Notes:
-

Long USD/JPY On This Nice UptrendUSD/JPY has formed a nice uptrend last week and it seems like it is continuing with the same idea in mind this week. The 50 SMA (yellow) has defined the trend. The 50 SMA was providing resistance before the uptrend started early last week. Now, it has turned into solid support.
The 50 SMA has been pushing this pair higher and this morning USD/JPY and the 50 SMA met again. The moving average did its job again providing support, but we wanted another confirmation before going long.
The confirmation came from stochastic and the candlestick pattern. The stochastic just became oversold, which implies that the pullback is complete. Besides that, the previous H1 candlestick closed as a hammer which is a reversing signal. The price was pulling back lower earlier his morning, so the reverse was supposed to be bullish, which is already underway.

Ripple (XRP) - Above The Stomach Bullish Scalp -Analysis & Educ.This is a simple XRPUSD & XRPBTC scalp based on the "above the stomach" two-candlestick pattern visible on the 4-hour time-frame...
Above The Stomach:
# of periods (candles) = 2
price trend (going into the pattern) = downward
first candle = black
second candle = white candle opening and closing at or above the midpoint of the prior black candle's body
Theoretical performance: Bullish reversal
Tested performance: Bullish reversal 66% of the time
Frequency rank: 32
Overall performance rank: 31
Best percentage meeting price target: 61% (bull market, up breakout)
Best average move in 10 days: -4.86% (bear market, down breakout)
Best 10-day performance rank: 33 (bear market, down breakout)
All ranks are out of 103 candlestick patterns with the top performer ranking 1. "Best" means the highest rated of the four combinations of bull/bear market, up/down breakouts.
Other Confirmations based this chart & indicators:
KnowSureThing - (RoC Based) showing potential for a double cross (That is both a cross of the signal and zero lines)
-The zero-line cross is extra significant as it is the second cross (locally)... as in price has recently cross the zero-line only to fall back below, ready for a second cross..
Net Volume is positive = more buying than selling (a weak bullish confirmation)
Price Target:
Use the blue colored dash trend-lines to approximate your target

Candlestick Power (AUDCAD analysis)Hey guys,
today i want to show you the power of candlestick combined with structure. Here is the 4H chart on AUDCAD, and the price is coming back to retest the 618 level of the bigger daily impulse; this level also lines up with a structure (that you can see if you scroll the chart).
With this two level i was able to draw a box where i can search for shorting opportunities down on lower timeframes, and that is what happened.
As soon as price reached this zone it stopped its upward move and gave us a strong selling pressure signal (pinbar) followed by an engulfing candle.
In order to get the real power of candlestick you can sometimes combine 3-4 candles together and see what's come out. In this case on the right i've drawn the result and it shows us very strong sellers. At this point, knowing the level it's so much important i want to short at the first retracment.
Stops above highs, first target at 1,5:1 RR and second target to be determined.
If you have questions or you want to share your view, feel free to comment below.
Otherwise, see you in the next chart!

How To Profit From The Bitcoin Crash In 3 StepsI have to journal this trade
because its a non negotiable thing
to do..also it will help you as well.
Bitcoin has experienced a bad crash...
and if you are fan of this bitcoin
then you have also felt the pain.
The monthly moving average
is a strong buy..
Because
1- The price is above the 50 ema
2- The price is above the 200 ema
3-The price has gapped up - Via the tweezer bottom
You can see this is called the Rocket Booster Strategy
you can also see the
bullish candlestick pattern
on the screen.
It also appears like its coming
from a bullish harami
This crash compared to gold has
made gold the better asset of 2025,
But i feel bitcoin will beat gold next year
so congratulations
to the gold bugs.
But am warning you Bitcoin KUCOIN:BTCUSDT
is coming.
This is your chance to profit from the
bitcoin market crash.
Rocket boost this content to learn more.
Disclaimer: trading is risky please
learn risk management and profit taking strategies.
Also use a simulation trading account
before you trade with real money.
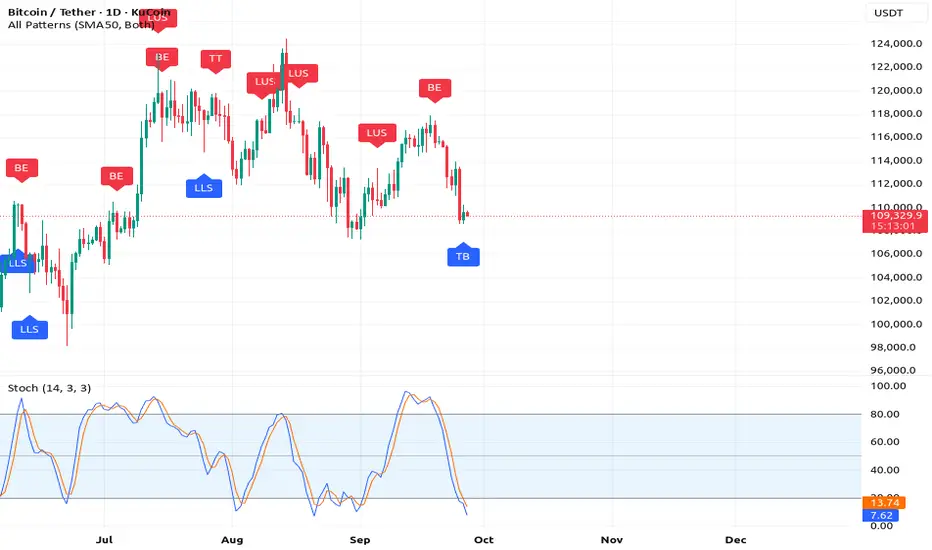
The #1 Bearish Chart PatternThere is something so powerful;
about technical analysis
that's very hard to put together
but once you do piece them together
you will begin to see the power of it
Tracking the price for
these alt coins
has been the best hing
i have ever witnessed.
Seeing the pennant bearish
price pattern
Has been something
i didn't think i would
see
This stuff is starting to get
more and more clear the more
i study about it.
Studying about the reversal pattern
is like reverse psychology
It gives you
the advantage in the market
Because?
Because everyone wants
a bullish signal when
the market is bullish
every one wants a bearish signal
when the market is bearish.
No one wants a correction.
No one wants the reversal.
Think about it how many
times have you seen a sucker
and you know deep down in your heart
that sucker
wont make it
Now imagine a sucker
that makes it in life.
That what this reversal pattern
is all about my man
this is what separates you
from the crowd
because you have hope that one
day that loser guy
you see will make it
think of the buy signal as
the potential you see in that loser
guy friend of yours
You have seen the potential but
no one around
you has..you have seen
it using the buy signal
now you see a big potential
he finally tells you he has made it
because you saw the potential in him
a long time ago and now
he is thanking you for seeing
this potential in him
and vows to help you
with hand outs if you will
ever need one.
That's what this correction is all about
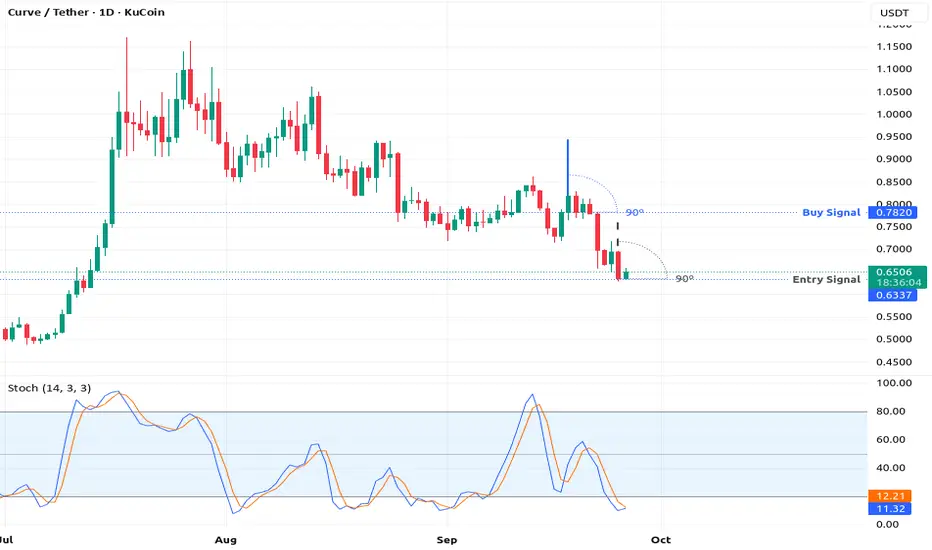
Notice the angles
there all 90 degrees
this chart pattern is
called the pennant bearish pattern
i got it form Steve Nison's book
on Japanese candlestick patterns.
Thats where i first saw
this pattern.
Patterns are important .
If you want to learn more check
out the resources below.
Rocket boost this content to learn more.
Disclaimer:Trading is risky please learn risk
management and profit
taking strategies.Also
feel free to use a simulation trading account
before you trade with real money.
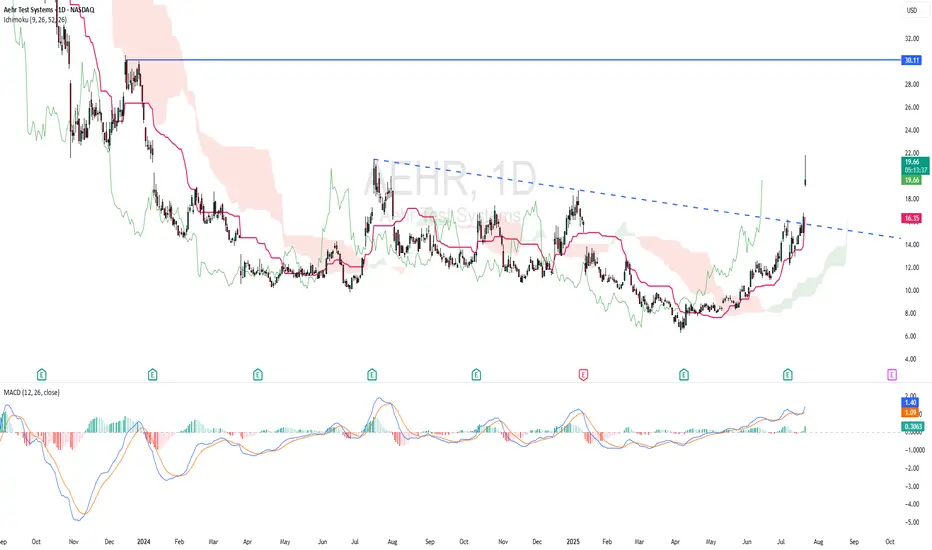
AEHR - RISING WINDOWTechnically AEHR is bullish as the stock made a strong rising window. Based on ICHIMOKU CLOUD, price is above cloud and chikou span is above candlestick - indicating bullish scenario. Kijun Sen is rising. MACD indicator showing bullish momentum.
ENTRY PRICE : 19.30 - 19.70
TARGET : 30.00 (potential almost 50% roi)
SUPPORT : 14.72
The 13 EMA System Rocket Booster StrategyHave you ever been labelled as a loser?
Thats what happened to me last night.
I was talking to an old buddy of mine.
He told me off.
He said:
"Lubosi you are old, grow up
and leave your parents home."
"Lubosi find a job and get married"
I replied telling him
that i have options.
In this case am talking
about crypto options trading.
Now am not in this trade.But i want to
share it with you because i appreciate
you following me.I think
i saw one of my followers
with a tag from
"the real world" i am humbled
to know that my reach goes
even to you.
You see am not the "cool" guy
but one thing about me man is that
i bust my behind to get isshh done.
Am like the video director
for the real world - That guy is cool
sadly he gets bullied. Once in a while
but they love him, because
he produces good results.
The market doesn't care about
your race, past, or present
All it cares about is what you are
going to give it today.
If you give the market high value.
You will get
high value in return
Thats why am so humbled
to be part of
this community.
My goal is to take you with me on
my journey.
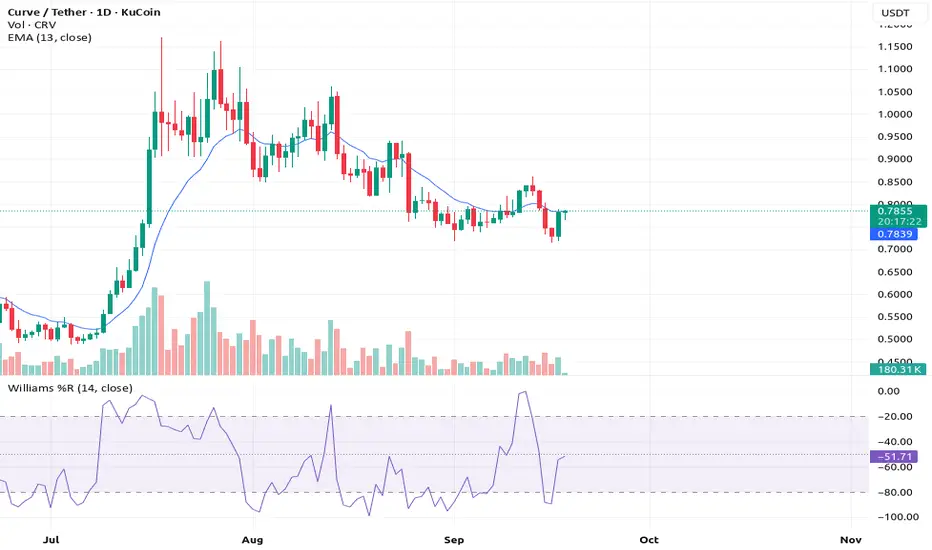
Now look at this crypto KUCOIN:CRVUSDT
its below the William %R -50
that's your entry No negotiation.
You should exit at above the -20
that's your profit taking target and risk
management no negotiation
man do it.
This is called the 13 EMA System
Rocket Booster Strategy
Rocket boost this content to learn more.
Thank you for reading.
P.S.
The entry pattern you are seeing is called the
Dragon Fly Doji
Its got a long wick at
the bottom.
I learnt this from candlestick patterns
book by Steve Nison
Thanks for reading again
remember to rocket boost the content.
So that you learn more
Disclaimer: Trading is risky please learn risk management
and profit taking strategies.Also
feel free to use a simulation trading account
before you trade with real money .
ETH season or Altseason ?In this article, we’ll review what the market has done so far and where the money flow has been leaning—toward altcoins or toward Ethereum.
As you can see, Ethereum has turned into a kind of black hole: whenever Bitcoin takes a breather, ETH pulls in most of the capital, and only a small trickle reaches altcoins.
What we see across most other altcoins isn’t much—at best, they snap back to prior levels. Think of SOL or those alts tied to “centralization/compliance” narratives. Otherwise, for now, the market is largely defined by Bitcoin and Ethereum’s moves.
Disclaimer
This is market commentary and reflects my personal opinion. It is not investment advice, a recommendation, or a solicitation to buy or sell any asset. Crypto markets are highly volatile and you can lose part or all of your capital. Always conduct your own research, make independent decisions, and use strict risk management (position sizing, stop-losses, scenario planning). Past performance is not indicative of future results. For guidance tailored to your situation, consult a licensed financial advisor.
#ETH #BTC.D #ETHBTC #BTCUSDT #Crypto #Candlestick #MarketStructure #Momentum #RiskManagement #PsychologicalLevel

A significant drop in price about to occur in XAUUSD (Gold)!!!Price of gold is about to drop significantly as we just spotted a bearish engulfing candlestick pattern in the H4 timeframe around the $3400 level. Also we can spot a double top pattern in 45M timeframe. All of these signals shows a potential sell opportunity from the current market price.
This is likely to be the first significant sell correction after the bullish impulse the market has made since the major breakout occurred around the $2000 level. A sell opportunity is envisaged from the current market price.

NZDCAD SHORT Market structure bearish on HTFs DH
Entry at both Weekly and Daily AOi
Weekly Rejection at AOi
Daily Rejection at AOi
Previous Structure point Daily
Around Psychological Level 0.82000
H4 EMA retest
H4 Candlestick rejection
Rejection from Previous structure
Levels 2.66
Entry 100%
REMEMBER : Trading is a Game Of Probability
: Manage Your Risk
: Be Patient
: Every Moment Is Unique
: Rinse, Wash, Repeat!
: Christ is King.

USDCAD BUY OPPORTUNITY Price pulled back to a support level of 1.36712 a pretty nice level where we’re looking forward to seeing more bullish price action development. This pullback support shares a confluence with a trendline with a Doji candlestick pattern. We should be looking for a confirmation to go long.

GBPCHF SHORTMarket structure bearish on HTFs 3
Entry at both Weekly and Daily AOi
Weekly Rejection At AOi
Daily Rejection at AOi
Previous Structure point Daily
Around Psychological Level 1.10500
H4 EMA retest
H4 Candlestick rejection
Rejection from Previous structure
Levels 4.17
Entry 110%
REMEMBER : Trading is a Game Of Probability
: Manage Your Risk
: Be Patient
: Every Moment Is Unique
: Rinse, Wash, Repeat!
: Christ is King.

Bitcoin plummets!!Good day traders, I am back with yet another update on BTC/USD. My last update on bitcoin what I was expecting price to do unfortunately did not happen as price was very weak, I had a FVG(SIBI) that I really wanted price to revisit and the two price levels that make up the SIBI are 107752 and 107149.
Now that both our sellside liquidity were taken does that mean price is now gonna look for the buyside liquidity? My honest opinion is I don't think because I said 97k is insight and I believe it can still happen and it will according to my HTF perspective.
On the daily TF we have clear sight of relative highs that we wanna see price take and that might happen today but my short term objective is the high that was booked on Tuesday. That Tuesday's candlestick has a very large wick and from my time learning with ICT's content, wicks contain a lot of price data that can be used either for entries or exits.
4H- Here we had a shift in market structure lower on Thursday but price has been bullish ever since the shift happened. On this respective TF we have equal highs too, and ICT teaches us to always focus our attention on them mainly because price looks for liquidity and imbalances on the 4 hour TF...should we look closely on the left of our screens or chart, there is an order block from the wick I mentioned above. Again what are the rules of an order block?..
FROM TOMORROW PRICE WILL START TO PLUMMET!!

USDCHF SHORT Market structure bearish on HTFs 3
Entry at Daily AOi
Weekly Rejection at AOi
Daily Rejection at AOi
Previous Structure point Daily
Around Psychological Level 0.83000
H4 EMA retest
H4 Candlestick rejection
Rejection from Previous structure
Levels 3.99
Entry 100%
REMEMBER : Trading is a Game Of Probability
: Manage Your Risk
: Be Patient
: Every Moment Is Unique
: Rinse, Wash, Repeat!
: Christ is King.

EURUSD Forms Rising Wedge + Evening Star_ Bearish SetupAs I expected in the previous idea , the EURUSD ( FX:EURUSD ) started to rise after breaking the upper line of the descending channel and hit the Long Position target with Risk-To-Reward: 1.46 .
The EURUSD is trading near the Resistance zone($1.149-$1.142) .
From a Classic Technical perspective, EURUSD appears to be completing a Rising Wedge Reversal Pattern . Also, a good sign for a EURUSD reversal is the formation of an Evening Star Candlestick Pattern near the upper line of the rising wedge pattern.
Also, we can see the Regular Divergence(RD-) between Consecutive Peaks .
In terms of Elliott Wave theory , I think the EURUSD corrective waves are NOT over yet, and it seems that EURUSD has completed the main wave X inside the rising wedge pattern.
I expect EURUSD to decline to at least $1.126 AFTER breaking the lower line of the wedge pattern.
Note: If EURUSD touches $1.14903 , we can expect more pump.
Please respect each other's ideas and express them politely if you agree or disagree.
Euro/U.S. Dollar Analyze (EURUSD), 4-hour time frame.
Be sure to follow the updated ideas.
Do not forget to put a Stop loss for your positions (For every position you want to open).
Please follow your strategy and updates; this is just my Idea, and I will gladly see your ideas in this post.
Please do not forget the ✅' like '✅ button 🙏😊 & Share it with your friends; thanks, and Trade safe.

Bitcoin Breakout Loading: Resistance Zone Under Pressure!!!Bitcoin ( BINANCE:BTCUSDT ) made the correction I expected , as I predicted in my previous idea .
Bitcoin is trading in the Resistance zone($103,320-$102,600) and near the Resistance lines . Given the momentum of the previous hour's candle and the fact that the previous three candles together formed a Morning Star Candlestick Reversal pattern , it is expected that the Resistance lines will be broken soon.
In terms of Elliott Wave theory , it looks like Bitcoin has completed the main wave 4 as I expected with a Zigzag Correction(ABC/5-3-5) . A break of the Resistance lines by Bitcoin could confirm the end of the main wave 4 .
Also, given Bitcoin's higher correlation with the S&P500 Index ( SP:SPX ) and the fact that I expect the S&P500 Index to increase , the increase in the S&P500 Index could help Bitcoin increase further .
I expect Bitcoin to break the Resistance zone($103,320-$102,600) and Resistance lines soon and attack towards the Resistance zone($105,100-$104,520) .
Cumulative Long Liquidation Leverage: $101,360-$100,600
Note: If Bitcoin falls below $101,280, we should expect further declines.
Please respect each other's ideas and express them politely if you agree or disagree.
Bitcoin Analyze (BTCUSDT), 1-hour time frame.
Be sure to follow the updated ideas.
Do not forget to put a Stop loss for your positions (For every position you want to open).
Please follow your strategy and updates; this is just my Idea, and I will gladly see your ideas in this post.
Please do not forget the ✅' like '✅ button 🙏😊 & Share it with your friends; thanks, and Trade safe.

Going long on SolanaBINANCE:SOLUSDT
Solana has experienced climatic volume to the downside, bullish RSI divergence, and now it seems ready for a big bounce. Also, there is a Hammer candlestick at the bottom of the decline.
Good luck to you

Failed Breakout + Rising Wedge = Bearish Signal for Bitcoin!?Bitcoin ( BINANCE:BTCUSDT ) attacked the Resistance zone ($87,520-$85,840) and the important Resistance line as I expected in yesterday's idea , but it seems that it failed to break .
Bitcoin is moving between two Support and Resistance zones .
From a Classic Technical Analysis , Bitcoin appears to have formed a Rising Wedge Pattern .
From an Elliott Wave theory , Bitcoin appears to have completed a main wave 5 on the 1-hour time frame .
Also, we can see the Regular Divergence(RD-) between Consecutive Peaks .
If we look at the Bitcoin chart in the 4-hour timeframe , a Shooting Star Candlestick Pattern with high volume is clearly visible near the Resistance zone ($87,520-$85,840 ), which could signal a reversal and decline in Bitcoin .
I expect Bitcoin to start declining again after an upward correction and break the lower line of the rising wedge pattern , and reach the targets I have indicated on the chart.
Cumulative Short Liquidation Leverage: $87,708-$86,487
Cumulative Long Liquidation Leverage: $84,520-$83,687
Do you think Bitcoin can finally break the important resistance line? I would like to hear your thoughts.
Note: If Bitcoin breaks above the Resistance zone ($87,520-$85,840), we can expect a pump.
Note: If Bitcoin falls below $81,000, we can expect further declines.
Please respect each other's ideas and express them politely if you agree or disagree.
Bitcoin Analyze (BTCUSDT), 1-hour time frame.
Be sure to follow the updated ideas.
Do not forget to put a Stop loss for your positions (For every position you want to open).
Please follow your strategy and updates; this is just my Idea, and I will gladly see your ideas in this post.
Please do not forget the ✅' like '✅ button 🙏😊 & Share it with your friends; thanks, and Trade safe.
