Candlestick bible review-The Psychology of the Inside Bar Patt.In this example we are only going over The Psychology Behind the Inside Bar Pattern Formation bullish example and where to enter and where to put stop loss
Search in ideas for "CANDLESTICK"

candlestick bible review Evening Star PatternGoing over and identfying evening star pattern formation (bearish)


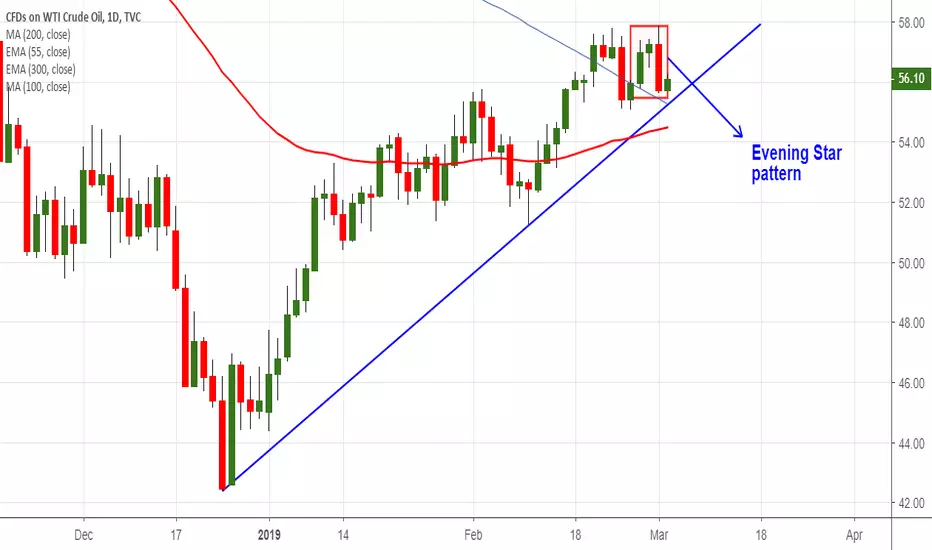
US oil : Evening Star PatternCandlestick Pattern- Evening star
Major resistance- $58
US oil has declined sharply after showing a good jump till $57.85. The previous high was around $57.79 made on Feb 22nd 2019 and on Friday oil jumped slightly above $57.79 started to show huge sell-off. It hits low of $55.60 and is currently trading around $56.04.
On the lower side, near term major support is around $55 and any violation below will drag the commodity till$54.41/$53.77 (61.8% fib)/$53.13.
The near term resistance is around $56.43 and any break above targets $57/$57.85. Any break above $58 confirms major trend reversal.
It is good to sell on rallies around $56.45-50 with SL around $57.05 for the TP of $55/$54.41.
Gold: Bearish EngulfingCandlestick pattern- Bearish Engulfing pattern
Gold has lost more than $15 after hitting 6-month high at $1258. The yellow metal retreated sharply after Fed hiked rates by 25 basis point and lowered its forecast to two rate hikes in 2019 from 3. Fed has trimmed its growth forecast to 2.5% from 2.3%. It hits low of $1241.85 and is currently trading around $1247.12
On the lower side near term major support is around $1237 (200- day MA) and any break below targets $1232/$1226 (89- day EMA).
The near term major intraday resistance is around $1251 and any break above targets $1258/$1264 (50% fib).
It is good to sell on rallies around $1250-$1251 with SL around $1258 for the TP of $1232.

USDCHF: Sello on rallies Candlestick pattern- Doji and Shooting star
Major resistance 0.9950
USDCHF was consolidating in narrow range after massive recovery from low of 0.95421. The pair hits high of 0.9955 and shown a minor decline of more than 50 pips today on account of geo political tensions in Italy and trade war worries between US and China has increased demand of safe haven currencies like Yen,Swiss franc. The pair hits low of 0.9855 and is currently trading around 0.98821.
On the lower side, near term support is around 0.9855 (23.6% fib) and any break below targets 0.9815 (89- day EMA)/0.9755 (20- day MA).
The near term major resistance is around 0.9955 and any violation above will take the pair till 1.000/1.00681. The pair should break above 1.00680 for further upside.
It is good to sell on rallies around 0.9905-0.9910 with SL 0.9960 for the TP of 0.9815/0.9755.

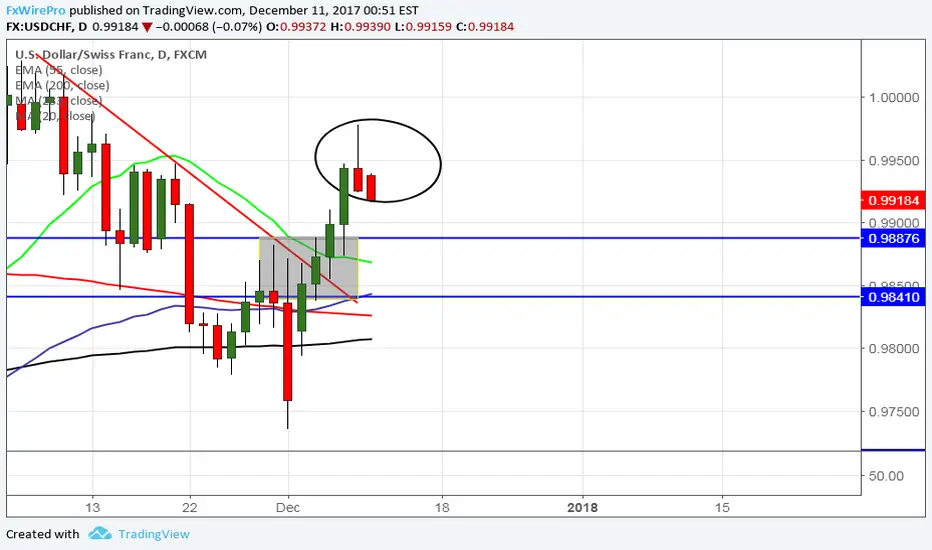
USD/CHF forms shooting star pattern, good to sell on rallies Candlestick pattern - Shooting star
USD/CHF has shown a profit booking after hitting high of 0.99770 on Dec 8th 2017. US dollar downside might be limited due to better than expected jobs data. U.S economy has added 228000 jobs in the month of Nov compared to forecast of 198K and unemployment rate was unchanged at 4.1%. The pair declined till 0.99159 at the time of writing. It is currently trading around 0.99179.
Market awaits US fed monetary policy which is to be held on Wed for direction. SNB policy assessment is on Thursday.
The pair’s near term support is around 0.9900 and any break below will drag the pair till 0.9880 (daily Kijun-Sen)/0.9840 (55- day EMA)/0.9805 (200- day EMA).
On the higher side, 1.000 will be acting as major resistance and any break above will take the pair to next level till 1.00380/1.010.
It is good to sell on rallies around 0.9935-40 with SL around 0.9980 for the TP of 0.9845/0.9810.
CHF/JPY forms shooting star in 4 hr chart,good to sell on rallieCandlestick pattern formed – Shooting star (4 hour chart)
The pair has shown a trend of bullishness for the past one month from the low of 112.58 made on Jun 14th 2017. It hits high of 118.60 yesterday and is currently trading around 118.30.
Technically the pair is facing major support around 117.80 (4H Kijun-Sen) and any break below confirms minor weakness. Any break below will drag the pair down till 117.30/116.22 (100- 4H MA).
In the 4H chart, the pair has formed bearish divergence in RSI and MACD. So a minor dip till 117.30 is possible.
On the higher side, 118.60 will be acting as major resistance and any break above will take the pair till 119.25/120 in the short term.
It is good to sell on rallies around 118.55-118.60 with SL around 119.25 for the TP of 117.80/117.30

No, No, The Monthly Is not a Shooting Star Candlestick.I have heard too many people incorrectly state that these two monthly candlesticks are shooting stars; when, in fact, they are not shooting stars.
In order to clarify this confusion, it is important to properly define what a shooting star candlestick is and its counterparts because the shooting star is actually a special case of the inverted hammer. The shooting star is a candle stick with a small real body and a large upper shadow (wick) and either no lower shadow or a small lower shadow. Since we now know what shooting stars look like, we must learn what makes them a shooting star, and here is the criteria: 1.) It has a higher high than the previous candles, 2.) It has higher volume than the average volume of surrounding candles (This may not always be the case), 3.) There was an uptrend.
When we look at the chart presented above, we can see that the two monthly candlesticks of July and August do occur after an uptrend, however, they do not hit higher price points nor do they have higher volume than preceding candlesticks. In addition, the month of July does not exhibit a small lower shadow and the body is of questionable size. However the month of August does exhibit the appearance of a shooting star, but it does not have a higher high than any of the preceding candles.
Finally, the shooting star does not always mean a bearish reversal, it needs to be combined with a multitude of other factors for this event to occur. It is highly possible that the shooting star is a signal for trendless-ness rather than a price retracement.
What I have does with this chart and what it means:
In magenta, I have denoted the center of the large bullish candlestick and the highest and lowest price. In light blue, I have denoted the center of the body and the lowest and highest price of the body. In candlestick analysis, the median (center) price of the candle stick is an important point to hold and it can be seen that it mostly acted as support. Since the bodies of July and August are all within the body of June and above its median price it highly probable that this is a consolidation, however, consolidations do fail, but currently there is no sign of this failing on the monthly time frame.
**Shooting Stars will be posted in the updates for reference.**

Tweezer Tops Candlestick (Learn Candle)The Tweezer Top pattern is a bearish reversal candlestick pattern that is formed at the end of an uptrend. It consists of two candlesticks, the first one being bullish and the second one being bearish candlestick. Both the tweezer candlestick make almost or the same high.
Example on this chart
APE/USDT

SPY - Daily Chart Candlestick AnalysisThe close on Friday left was appears to be a "Hanging Man" candlestick. With this occurring during an uptrend this could potentially be a bearish warning sign. We must wait for the confirmation of the CLOSE of trading on Tuesday to find out whether this candle is bearish or not. For confirmation to occur Tuesday's closing price must be below the LOW of Friday's real body. If the price does seem to be confirming a bearish signal then people who have long positions should look to take some profit off the table or close out their long positions entirely to better utilize their capital following a pullback or consolidation phase. If Tuesday's trading should close higher than Friday's real body then the bearish signal is canceled & expect more upside to continue.
I labeled a few candlesticks from A to E which stuck out to me:
A) The previous high made prior to the pullback. An important level
to watch for future bullish breakouts which eventually occurred
at the candlestick labeled D.
B) This candle is an inverted hammer candlestick which was
produced the day after a potential low was put in off high
volume. This is a signal that the market may be turning bullish.
C) A Doji candlestick was produced around the price level noted on
candle A showing there is a battle going on about whether this
area will continue to be resistance or if a true breakout will
occur.
D) A bullish engulfing candlestick formed after prices held both my
initial price target level & a rising window area created from
February 4th to February 5th.
E) The candle produced on Friday was a "Hanging Man" which is a
potentially bearish candlestick when formed during an uptrend.
We need confirmation from the following trading day(s) to see if
this is bearish or not. For bearish confirmation, the price must
close below Friday's real body price. A close higher than Friday's
real body negates its bearish connotations & shows that the
bullish move will continue.
I have also noted the numbers 1-7 on this chart. These label the current amount of new highs being created without a significant pullback occurring. The Japanese believe when trends run 8-10+ without a pullback you should be preparing for one. I note this because we have a potentially bearish candlestick from Friday & we are at a 7 on the current long count pattern.
Price has currently risen past my initial price target & has found support around my second price target. If bullish momentum continues I am looking at my third price target around $346.50. It is important to note that the dotted blue line is my current P&F price target which still sits above my Fibonacci level targets (which I view as showing plenty of bullish momentum under the hood of this market).
Overall, I am still bullish on SPY & the markets overall. Even if Friday's bearish signal is confirmed I would use that as a signal to take profits or closeout long positions you are not certain about. After the pullback/consolidation occurs it will provide us another opportunity at entering some strong names that may be a bit overextended at the moment.

Gala usdt idea and candlestick analysisAs you see in the chart, with the increase in the shadows of the candles in the bullish or bearish trend, along with one or two candles in the opposite direction of the movement of the chart,
it's a trend change signal and a good setup to enter in the trading.
P.S. I must say that; in the long-term time frame ( usually more than 1-H ), this method of Candlestick analysis is more effective.
----------------------------------------
Please write any advice or suggestions.
Dear friends, request any cryptocurrency pair, currencies pair for forex, and any index that you want to be analyzed and ask any questions.
Thanks for your attention

Bearish Engulfing Candlestick patternBearish Engulfing Candlestick pattern
Bearish Engulfing Candlestick pattern
Bearish Engulfing Candlestick pattern
Bearish Engulfing Candlestick pattern
Bearish Engulfing Candlestick pattern
Bearish Engulfing Candlestick pattern

BITCOIN - Bullish Candlesticks Party - Do They Start The Rally?Hi followers and other TradingView users! As usual, to unlock this text You have to hit the LIKE button ;)
On Friday I said: "If we don't find this power soon enough then we might stay below those resistances ( $6,445, $6,460) because at the weekend we have low volatility!"
The slow-motion mode is still on the market, we did not find that power soon enough to push the price above the current major levels and almost entire weekend we traded below the named levels - until Sunday...
On Sunday we got a pretty important move from strong support area, the bounce came from $6,360 and after it formed us several bullish price action patterns. Firstly, we had two weeks ago a very strong bullish "Dragonfly Doji" weekly candlestick pattern (remember that little bear trap and bounce upwards from $6,250), this candlestick didn't get that full momentum what it would have deserved BUT it still may come because of the massively low volatility and currently, everything happens in the postpone mode.
The Sunday's move - from the major counter trendline (pulled from 24. June) and from the perfect FIB level 62% - pushed the price above the first strong resistance area at $6,445 and the daily candle close gave a bullish candlestick pattern "Hammer".
Last time when we got a bullish candlestick pattern on the major counter trendline was 31. Oct. and we ended up with nice 'rally' upwards. Let's see what we can get from yesterday's Hammer.
To climb upwards we have several bullish price action criteria:
1. Strong rejection from the counter trendline
2. Strong rejection from the perfect FIB level 62%
3. Bullish Hammer candlestick pattern formed after the bounce
4. Candle close above the first strong resistance area - $6,445
5. We have several bullish candlestick patterns on the mediocre timeframes
* 12H - bullish "Engulfing"
* 8H - bullish "Railroad Tracks"
* 6H - "Hammer" / "Morning Star"
* 4H - A bit sloppy but still "Engulfing"
So, pretty good indications from the different timeframes. Definitely, I'm still bullish before we have not seen any short-term lower lows and we don't have any candle close below the major counter trendline.
Let's jump into the current price action:
As You see on the chart we got a perfect bounce from $6,360 and this guides us upwards to the triangle upper trendline which has act historically multiple times as a strong resistance. This upper trendline is very subjective because I tried to draw this from as many wicks as I can (ignoring some of the trendline drawing rules because of the Tether crash). The price bounced back from the upper trendline and on the 4H chart we got a bearish candlestick pattern called "Shooting Star" - yes, today is a candlestick pattern day ;) - and now we are on the tiny area between the $6,445 $6,460.
We might see a throwback to the $6,400-$6,410. There is a possible short-term down-trendline retest area which is also short-term counter trendline (If we count that trend upwards which started at 31 Oct. after bullish Engulfing). So, we have an important break above the trendline and now we could make a retest + there is a possibility to 'make' the "Inverted Head and Shoulders" pattern if we find a support from $6,400-$6,410.
Summary: I start to turn into the bearish bias when I see that the price starts to fall downwards from the triangle (from the grey area). Currently, there are just too many short-term bullish signs. As usual, I start to make updates to hold You on the 'track' and help You as much as I can!
Bullish confirmations:
* A candle close above the $6,445, $6,460, above the triangle and above the round number $6,500
Bearish confirmation:
*Close below the $6,385 and below the triangle!
Hopefully, this breakdown helps You out a little bit to confirm Your own analysis!
Please, don't forget to LIKE, COMMENT & FOLLOW!
Thank You for your support, I really really appreciate it!
Have a nice week!
*This information is not a recommendation to buy or sell. It is to be used for educational purposes only!

Using Candlesticks to Find Market Manipulations
This is why I am not "investing for the long-term" in BTC.
What are you looking at? Bot manipulation.
What's a bot you say?
en.wikipedia.org
www.technologyreview.com
finance.yahoo.com
www.coindesk.com
Here in fact is a historical chart for when I brought one of my more advanced bots online:
This was a smallish market cap coin to test on. i.imgur.com
You'll notice the 5 tests I did over 2 weeks as I was getting code straightened out.
Op1 was testing injection to manipulate the price.
Op2 was testing sustained injection while manipulating volume.
Op3 was testing how well I could maintain price vs dump volume (for the exits).
Op4 was the pump to dump my series of buys at the floor.
Op5 was my final total exit.
As you can see, I was able to double my money many times. With a comfortable
operating range a bit above 50% return.
This scales easily, all it takes is stake vs market volume. I did those with a
tad under 1%. I've accumulated 3% of this particular coin now and will be testing
more robust manipulations. I should be able to make perfect upside-down U's with
at least 50% returns at the top of the arc. And keep it up like a bouncing ball
that doesn't lose inertia, since I have inertia-driving volume. (If an outsider
were making moves off of mine, they'd realize a higher return, since they don't
have to use injection volume). You can do this with less stake on a higher volume
coin, because other bots and humans both will amplify your moves for you, with
less of a personal injection.
I like Heiken Ashi for reversals, but I like candlestick to suss out manipulations.
You should check out Candlestick Patterns:
www.candlecharts.com
www.incrediblecharts.com
Hammers, Dragonflies, 4price doji, hanging men...
Why such long shadows? Bots.
DPO is shown to compare to: and
Note the blunt peaks on BTCUSD vs the other two?

A brief introduction of candlestickA brief introduction of the candlestick. Look at the chart and see the candlestick pattern which is most illustrious the Forex, Crypto also stock markets.

BTCUSD, winning candlestick color indicator signal #3 Hi guys, please give me a LIKE if you find this idea interesting, candlestick color indicator signal #3 has formed again. Over the last two days I made 600% using it. As before, I use STIXEX for this strategy, in other words, I place trades whether the next candlestick in the price chart will be red or green. I will not get into the details how STIXEX or my indicator works, but here is an excerpt from one of my posts, and you can also join “candle color options” chat right here on TV for more discussions:
“The interesting fact about candlesticks is that in the long run, there are always the same number of green and red candlesticks, regardless if the market is going up or down. So when the number of, for example, red candles rises above the mean (for example there are 55 green candles out of the last 100 candles), this gives us an opportunity to start placing trades on red candles in the anticipation that the number of red/green candles will revert back to the mean (50/50).”
HOW TO TRADE THIS SET-UP: At the moment, the indicator is showing that there are 55 green candles out of the last 100. So now, every time when new red candle forms, I will place a trade that the next one will also be red. I will trade until I am up by 300% (STIXEX pays fixed 100% payouts on winning trades) or until red/green ratio of the last 100 candles goes back to 50/50 (50 red and 50 green candles out of the last 100). I trade 15min candles, so if you want to trade along make sure that you follow me.
If you are not familiar with “color options”, ask me in the comments section or join a chat right here on tradingview - candle color options.
Please follow, like and comment !

Bearish Engulfing 4h CandlestickBearish Engulfing 4hr Candlestick EUR/USD and start of crossing in VFI_LB indicator.
Vwap for entry in 1.22 target below 1.18 support.
Divergence and convergence pattern in indicator and candlestick.
Increase volume for bear in the currency.


Bearish Candlesticks on Bank NiftyNSE:BANKNIFTY
Bearish Candlesticks identified on latest downtrend movement of NSE:BANKNIFTY .

Bearish Candlesticks Pattern on SilverTVC:SILVER
Bearish Candlesticks identified on Daily timeframe of TVC:SILVER chart.

Bearish Candlesticks Pattern on TeslaNASDAQ:TSLA
Bearish Candlesticks identified on daily analysis on NASDAQ:TSLA downtrend
