NTAP: Filling gap, solid candlestick patterns ahead of earningsNTAP has moved into the gap area, and is now poised to challenge the next resistance level. This stock has had recent HFT activity and is likely to have more HFT attention on the day of its earnings release. The candlestick patterns are solid ahead of earnings. Watch for pro traders setting up for a pre-earnings run.
Search in ideas for "CANDLESTICK"

SPX500 - Rally and CandlesticksHello Friends,
I would like to stress the importance to check higher level TFs candles to get and idea if rally can continue after such a lengthy run.
In this idea I want to demonstrate that monthly candlesticks analysis with a little hint from Elliott Waves can show that SPX rally will continue if 2815 is broken up. I personally believe that it is very high probability of this happening.
The char shows that we had an inside bar on Nov, 2018 and the candlestick pattern got triggered by breaking low of "mother" candle Oct, 2018 low. BUT after initial drop price quickly found support and returned above October candle low. That showed strength and suggested that price will go to the opposite side of mother candle (Oct, 2018), which effectively means - REVISIT THE TOP. During the rally on Monthly chart we produced another BULLISH inside bar candle Jan, 2019 and currently we are about to knock on the top of it mother candle Dec 2018.
Once we break Dec, 2018 top - bullish inside bar pattern triggers renewed rally which will fulfill the destiny to revisit the top and potentially break it.
Having that in mind we can say that 2019 will be a bullish year for stocks and with that drop in Nov/Dec 2018 big money just made much better position for year 2019. Look at the volume! All the selling has been bought. Price moving above that sell off volume!
Any comments/questions are welcome.

Candlestick Pattern-BTC-Long-legged DojiLong legged doji candle for BTCUSD. For FMI (Forex Mastery Institute) Studies.

Waiting for Candlestick Pattern to Buy NZDUSDH1 Time Frame
Break down trend
Break Key level
Waiting for Candlestick pattern at support zone to buy
-----------------------------------------------------------------------------------------------
Wish you all have a good trading day!

$PTON Big Doji candlestick suggests Bounce to 130-132 Over sold indicators supporting Friday Big Doji candlestick around 105 . Above 98 Short-term suggests bounce to 130-32 then consolidation or other pullback lower than 93. Battle ground around 123
Resistances: 115.2 - 123.4 - 130-132
Supports: 98 - 93 - 85 Stops for longs.

USD/CAD SHORT and how to read candlestick patterns.There is a reasoning behind the formation of candlestick patterns. Let´s do some X-rays of the candles to understand their formation.

Bajaj Finance ( DAILY ) - Candlestick PatternBAJAJ FINANCE( DAILY )
Candlestick Confirmation
Downtrend from 31st Aug 2020 till 23rd Oct 2020
Indication of Bullish Engulfing with spike in volume and Stochastion in oversold positions
AWAIT FOR BULLISH CANDLE CONFIRMATION
Buy above 3362
Target of 3519

Possible rising three methods candlestick patternWe could possibly be seeing the next 4hr candle a bearish engulfing due to this potential rising 3 methods candlestick pattern

AUDCAD trading a double candlestick pattern on a down-channelAUDCAD testing the upper part of the down-channel, with a double candlestick pattern: a tweezers top and a bearish engulfing pattern.
Stop loss and take profit are very tight, since we are trading on the M15 within a very tight channel, so I suggest to check the spread first for your broker and avoid this trade if you have a spread that is over 1 pip.

DAX Price Alert / Bearish Engulfing Candlestick PatternDeutsche Boerse AG German Stock Index DAX.
The German Stock Index is a total return index of 30 selected German blue chip stocks traded on the Frankfurt Stock Exchange.
The DAX has a base value of 1,000 as of December 31, 1987.
Candlestick Pattern: Bearish Engulfing
The ideas and price alerts published here are not financial advices.

Bearish Regular Divergence + candlestick reversalHey guys,
I except a retracement on short term (4H) BTC price.
A regular bearish divergence and a HANGING MAN bearish candlestick reversal pattern makes me think of a retracement for next hours.
Also, STOCHASTIC shows that BTC is overbought.
What do you think about this ?

Power of Candlesticks (AUDCAD analysis)Hey guys,
today i want to show you the power of candlestick combined with structure. Here is the 4H chart on AUDCAD, and the price is coming back to retest the 618 level of the bigger daily impulse; this level also lines up with a structure (that you can see if you scroll the chart).
With this two level i was able to draw a box where i can search for shorting opportunities down on lower timeframes, and that is what happened.
As soon as price reached this zone it stopped its upward move and gave us a strong selling pressure signal (pinbar) followed by an engulfing candle.
In order to get the real power of candlestick you can sometimes combine 3-4 candles together and see what's coming out. In this case on the right i've drawn the result and it shows us very strong sellers. At this point, knowing the level it's so much important i want to short at the first retracment.
Stops above highs, first target at 1,5:1 RR and second target to be determined.
If you have questions or you want to share your view, feel free to comment below.
Otherwise, see you in the next chart!

NTPC Confirmed Bearish Pin-Bar CandlesticksThe Pin Bar Candlesticks formation indicates change in trend. If it is found near important resistance level then it signals selling pressure and rejection of prices on high level as indicated the above chart.
Therefore, it is an important formation to measure market sentiments and as per above chart it indicates high selling pressure or profit taking signals short.

MIDAS with Japanese CandlesticksOne of my favourite trading strategies is using MIDAS with Japanese Candlesticks and here is the checklist on how to do it.
1) Identify a trend. (Higher highs and higher lows or lower lows and lower highs).
2) Launch a MIDAS curve from the beginning of the trend.
3) As price pulls back to the MIDAS curve, draw a line to identify price structure.
4) If price fails to break the MIDAS curve and then penetrates the price structure = Enter Position.
5) The Stop Loss is set to be just above/below the MIDAS curve.
6) As the trend develops, add further MIDAS curves (R1, R2 etc) and more positions with this strategy until,
7) you see price break the most recent MIDAS curve and fails to close above/below market structure (see chart) as this would strongly suggest that the trend is dying and/or a different market sentiment is coming in to play.
8) This is where you close out all your positions.
Let me know if you have any questions,
I will be posting real trade setups with this strategy so make sure to follow ! :)
PM me if you want to get a free copy of the MIDAS Technical Analysis System.
MIDAS Trading Tools for MT4 is available to download @ MQL5.com

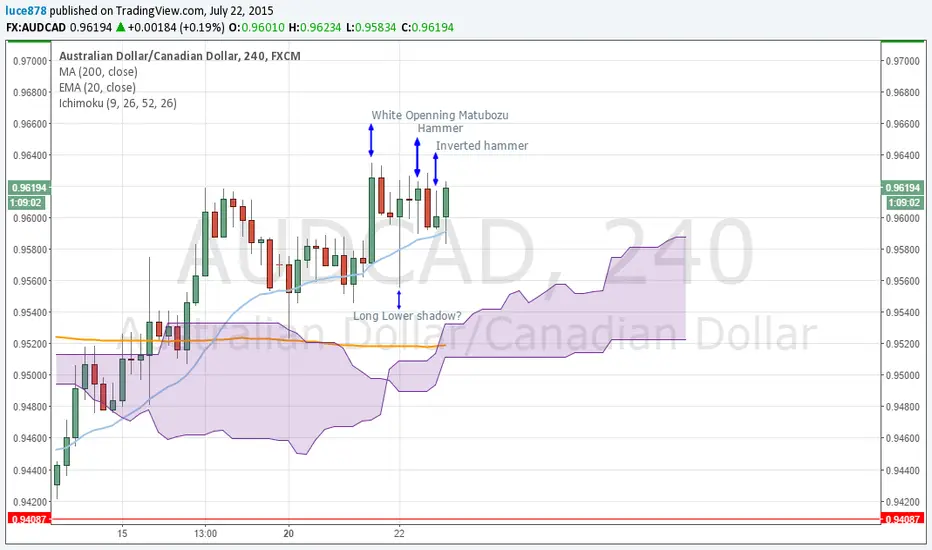
AUDCAD Candlesticks signals on the 4 hour chartAs the title says, there are a couple of candlestick that more or less indicates the continuation of the uptrend. As a learner , I've always found that a single candlestick doesn't indicate anything, but a couple of them do. I'm (paper trading) long in this position and mi stop loss is settled at the bottom of the long lower shadow.
Bearish Candlesticks on Daily, GBP/JPYA Shooting Star candlestick formed on May 29th. The last two trading sessions have produced Hammer candlestick patterns. All these are potentially Bearish signals for the GBP/JPY.

Advanced Micro Gives a Class on CandlesticksAdvanced Micro Devices has done more recently than just plunge to its lowest level in over two years. It’s also given some interesting lessons on candlestick patterns.
The heavily traded chip had a thick red bar on October 7 after preannouncing weak quarterly results. The next session saw prices inch lower but remain in a tight range. On October 11, AMD made a higher high and lower low: an outside day. The 12th was just the opposite, with a small inside candle. Then another outside day (bullish), a bearish inside day on Friday and a positive inside candle on Monday. Tuesday and Wednesday saw another pair of outside and inside moves.
All those candles, on the heels of four weeks of solid downside, could potentially suggest prices are stabilizing. Is all the bad news priced in before CEO Lisa Hsu announces final numbers on November 1?
Next, the patterns occurred around $59. That level held AMD in check February and July 2020 before excitement about 7nm Ryzen chips triggered a breakout. Could old resistance be turning into new support?
TradeStation has, for decades, advanced the trading industry, providing access to stocks, options, futures and cryptocurrencies. See our Overview for more.
Important Information
TradeStation Securities, Inc., TradeStation Crypto, Inc., and TradeStation Technologies, Inc. are each wholly owned subsidiaries of TradeStation Group, Inc., all operating, and providing products and services, under the TradeStation brand and trademark. You Can Trade, Inc. is also a wholly owned subsidiary of TradeStation Group, Inc., operating under its own brand and trademarks. TradeStation Crypto, Inc. offers to self-directed investors and traders cryptocurrency brokerage services. It is neither licensed with the SEC or the CFTC nor is it a Member of NFA. When applying for, or purchasing, accounts, subscriptions, products, and services, it is important that you know which company you will be dealing with. Please click here for further important information explaining what this means.
This content is for informational and educational purposes only. This is not a recommendation regarding any investment or investment strategy. Any opinions expressed herein are those of the author and do not represent the views or opinions of TradeStation or any of its affiliates.
Investing in cryptocurrencies involves significant risks. Please click here for TradeStation Crypto’s risk disclosures on investing and trading in cryptocurrencies.
Investing involves risks. Past performance, whether actual or indicated by historical tests of strategies, is no guarantee of future performance or success. There is a possibility that you may sustain a loss equal to or greater than your entire investment regardless of which asset class you trade (equities, options, futures, or digital assets); therefore, you should not invest or risk money that you cannot afford to lose. Before trading any asset class, first read the relevant risk disclosure statements on the Important Documents page, found here: www.tradestation.com .


BTCUSD Short - Multiple pattern and candlestick analysisPatterns
1. Harmonic Pattern shows a Bearish Crab (Bear)
2. Leaving the ascending channel at the bottom (Bear)
3. Forming a symmetrical triangle pointing upwards slightly (Bear)
4. Elliot (correction) wave ABCDE is at play which could become double or triple top or a head an shoulders (Bear)
5. Declining volume shows there's no big price changes coming (So for now remains bearish)
Candlesticks
1M: Evening Doji Star (Bear)
1W: Bearish Harami (Bear)
1D: Bearish Engulfing (Bear)
4H: Bearish Engulfing as well (Bear)
1H: 3 Bearish Soldiers (Bear)
_____________________________________________________________________________________
I'm purely a beginner in technical analysis. Please hit like, follow or place a comment if you wish.
Any of your feedback is my motivation to keep going and to learn more about Technical Analysis!

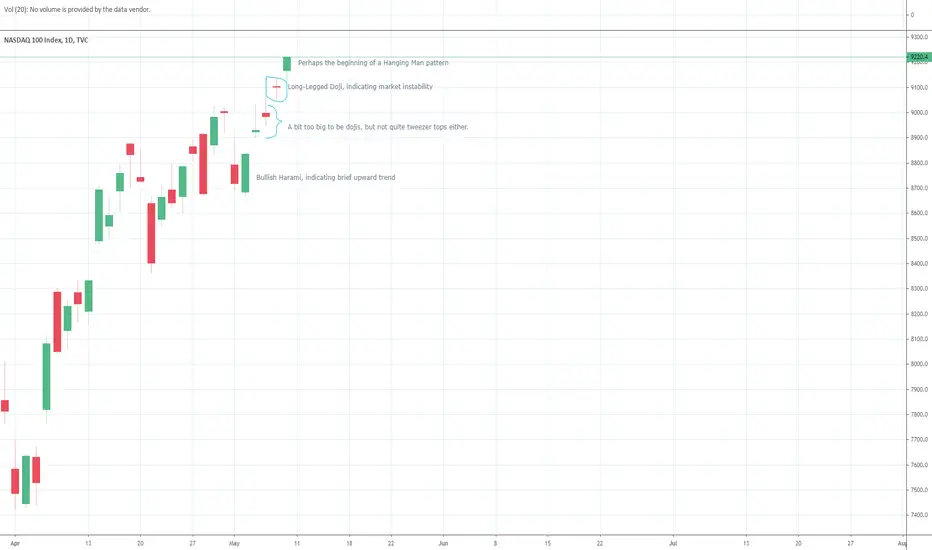
Trying to learn Candlesticks, NDX Short downtrend?Very new to technical analysis, sorry. Trying to analyze candlestick patterns and it seems there is a bit of market instability with a doji and a possibility of the formation of a hanging man. Predicting a bearish trend for the next few days. Thoughts?
GBPNZD A Candlestick analysisWe always pay attention to the story that candlesticks tell us. They indicate a short trade here.
Like and comment if you find value in our analysis.
Good luck
NOTES:
- All trades are executed with a valid signal of our own. As a trader you should develop and test your own entry protocol.
- We never trade just because the price reaches the trading zone. This also means that not every idea is a valid trade.
- Our analysis are trading ideas not trading signals for you. Therefore questions about the status of the trade, stop loss, take profit levels won't help your progress to be a better trader.
- Instead of trying to take this trade and win small profits, focus on the analysis and how to create your own trading style.
Best Regards.

$SPY $SPX $VIX Candlestick produces down pattern?$SPY $SPX $VIX Everytime the daily gets one if these candlesticks it drops hard, VIX bottomed at 11 and quad witch day is over, what will Monday bring?

EURNZD Short on Candlestick ActionLooking for Candlesticks similar to previous peaks to get into the sell here for the triple top to be complete.
