Gold: Potential Correction on the Horizon?Gold has long been regarded as a safe haven asset, drawing the attention of investors during periods of economic uncertainty. In recent years, gold prices have reached historic highs, fueled by inflation concerns, geopolitical tensions, and shifts in monetary policy. However, as with any asset experiencing a prolonged rally, the question arises: Is a correction in gold prices imminent?
Understanding the Recent Gold Rally
Several factors have contributed to gold’s impressive performance:
Inflation Hedge: Persistent inflation has driven investors toward gold as a store of value.
Geopolitical Risks: Ongoing conflicts and global tensions have increased demand for safe haven assets.
Monetary Policy: Central banks’ dovish stances and low interest rates have made non-yielding assets like gold more attractive.
Several scenarios could catalyze a correction in gold prices:
Unexpected Economic Recovery: Stronger-than-expected economic data could reduce demand for safe haven assets.
Aggressive Rate Hikes: Faster-than-anticipated interest rate increases could shift investor preference away from gold.
Resolution of Geopolitical Tensions: Any de-escalation in major geopolitical hotspots may dampen gold’s appeal.
#gold #commodity #commodities #metals #trading #portfolio
Search in ideas for "COMMODITY"

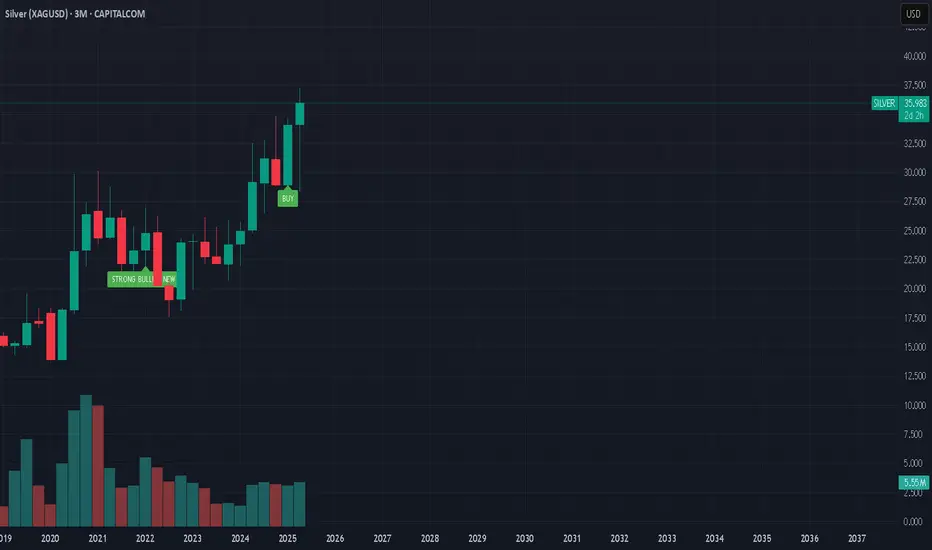
Silver-The Next Gold?The precious metals market is abuzz with a compelling question: Is silver poised to become the next gold? As gold continues its record-breaking ascent, investors and analysts are turning their attention to silver, which has demonstrated remarkable performance and potential in 2025. Let’s dive into the factors driving silver’s price, expert forecasts, and what the future may hold for this dynamic metal.
Silver’s 2025 Surge: Outpacing Expectations
Silver prices have surged impressively in 2025, recently trading above $34 per ounce—a 14% year-to-date increase that outpaces many other commodities. This rally is not just a speculative spike; it’s underpinned by robust fundamentals, including:
Gold’s record run, which historically pulls silver prices higher due to their strong correlation
Persistent supply deficits, with 2025 marking the fifth consecutive year of market shortfall
Soaring industrial demand, especially from the green technology and electronics sectors
Renewed safe-haven buying amid ongoing geopolitical and economic uncertainties
#commodity #silver #gold #xau #metals #finance #market #trading #portfolio #analysis
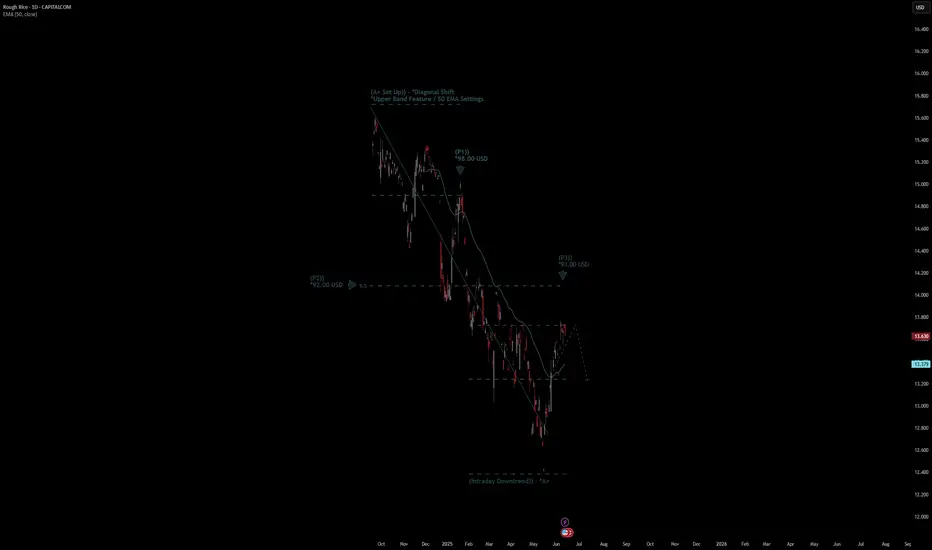
Rough Rice Commodity Quote | Chart & Forecast SummaryKey Indicators On Trade Set Up In General
1. Push Set Up
2. Range Set up
3. Break & Retest Set Up
Notes On Session
# Rough Rice Commodity Quote
- Double Formation
* (A+ Set Up)) - *Diagonal Shift | Completed Survey
* (Intraday Downtrend)) - *A+ | Subdivision 1
- Triple Formation
* (P1)) / (P2)) & (P3)) | Subdivision 2
* (TP1) | Subdivision 3
* Daily Time Frame | Trend Settings Condition
- (Hypothesis On Entry Bias)) | Indexed To 100
- Position On A 1.5RR
* Stop Loss At 90.00 USD
* Entry At 89.00 USD
* Take Profit At 86.00 USD
* (Downtrend Argument)) & No Pattern Confirmation
* Ongoing Entry & (Neutral Area))
Active Sessions On Relevant Range & Elemented Probabilities;
European-Session(Upwards) - East Coast-Session(Downwards) - Asian-Session(Ranging)
Conclusion | Trade Plan Execution & Risk Management On Demand;
Overall Consensus | Sell
WTI oil has approached a key area of resistanceThe technical picture of WTI oil shows that the commodity is now near one of its key downside resistance lines. Could we get a break, or trendline will remain intact?
Let's dig in!
TVC:USOIL
MARKETSCOM:OIL
Let us know what you think in the comments below.
Thank you.
77.3% of retail investor accounts lose money when trading CFDs with this provider. You should consider whether you understand how CFDs work and whether you can afford to take the high risk of losing your money. Past performance is not necessarily indicative of future results. The value of investments may fall as well as rise and the investor may not get back the amount initially invested. This content is not intended for nor applicable to residents of the UK. Cryptocurrency CFDs and spread bets are restricted in the UK for all retail clients.

This commodity called Cocoa is offering an excellent risk/rewardThe red dotted line shown is the weekly bearish trend line that has recently got a break out.
You can go to a smaller time frame, the 4H or 1H to find a better entry point. That may be a retracement that offers you a good opportunity to get in.
Now, commodity is much more volatile so don't be stingy with your SL , give it a wider margin else you will be disappointed when the game is over much faster than you anticipated.
Good luck!

MCX - Multi Commodity Exchange (45 minutes chart, NSE) - LongMCX - Multi Commodity Exchange (45 minutes chart, NSE) - Long Position; short-term research idea.
Risk assessment: Medium {volume structure integrity risk}
Risk/Reward ratio ~ 1.35
Current Market Price (CMP) ~ 6490
Entry limit ~ 6400 on May 16, 2025
Target limit ~ 6680 (+4.38%; +280 points)
Stop order limit ~ 6192 (-3.25%; -208 points)
Disclaimer: Investments in securities markets are subject to market risks. All information presented in this group is strictly for reference and personal study purposes only and is not a recommendation and/or a solicitation to act upon under any interpretation of the letter.
LEGEND:
{curly brackets} = observation notes
= important updates
(parentheses) = information details
~ tilde/approximation = variable value
-hyphen = fixed value

"COCOA" Commodity CFD Market Heist Plan🌟Hi! Hola! Ola! Bonjour! Hallo!🌟
Dear Money Makers & Robbers, 🤑 💰
Based on 🔥Thief Trading style technical and fundamental analysis🔥, here is our master plan to heist the "COCOA" Commodity CFD market. Please adhere to the strategy I've outlined in the chart, which emphasizes long & Short entry. 👀 Be wealthy and safe trade 💪🏆🎉
Entry 📈 : You can enter a Bull or Bear trade at any point after the breakout.
Buy entry above 11,800
Sell Entry below 10,000
Stop Loss 🛑: Using the 2H period, the recent / nearest Pullbacks.
Goal 🎯: Bullish Robbers TP 13,600 (or) Escape Before the Target
Bearish Robbers TP 8,800 (or) Escape Before the Target
Fundamental Outlook 📰🗞️
The COCOA Market is expected to move in a Bullish direction, driven by the following key factors:
🔵Macro Factors:
Global Economic Growth: Rising global economic growth, particularly in emerging markets, is expected to increase demand for cocoa.
Inflation: Moderate inflation levels in major cocoa-consuming countries are expected to support cocoa prices.
Currency Fluctuations: A weaker US dollar is expected to support cocoa prices, as it makes cocoa more competitive in international markets.
🟡Fundamental Factors:
Supply and Demand Imbalance: The global cocoa market is expected to face a supply shortage in the 2022/23 crop year, supporting prices.
Weather Conditions: Favorable weather conditions in major cocoa-producing countries, such as Côte d'Ivoire and Ghana, are expected to support cocoa yields.
Certification and Sustainability: Growing demand for certified and sustainable cocoa is expected to support prices for high-quality cocoa beans.
🟠Sentimental Factors:
Investor Sentiment: Positive investor sentiment, driven by improving global economic growth and supply chain disruptions, is expected to support cocoa prices.
Market Positioning: The commitment of traders (CoT) report shows that hedge funds and other large speculators are net long cocoa, indicating a bullish sentiment.
Technical Analysis: Cocoa prices have broken out above a key resistance level, indicating a bullish trend.
- Bullish Sentiment: 83% of clients are long on COCOA, indicating a strong bullish trend.
- Bearish Sentiment: 17% of clients are short on COCOA, indicating a relatively weak bearish trend.
- Neutral Sentiment: No explicit data available, but we can infer it's relatively low given the strong bullish trend.
📌Please note that sentiment analysis can change rapidly and may not always reflect the actual market performance. These percentages are based on current market data and may not reflect future market movements.
That this is a general analysis and not personalized investment advice. It's essential to consider your own risk tolerance and market analysis before making any investment decisions.
📌Keep in mind that these factors can change rapidly, and it's essential to stay up-to-date with market developments and adjust your analysis accordingly.
💖Supporting our robbery plan will enable us to effortlessly make and steal money 💰💵 Tell your friends, Colleagues and family to follow, like, and share. Boost the strength of our robbery team. Every day in this market make money with ease by using the Thief Trading Style.🏆💪🤝❤️🎉🚀
I'll see you soon with another heist plan, so stay tuned 🫂

MCX - Multi Commodity Exchange (Daily chart, NSE) - LongMCX - Multi Commodity Exchange (Daily chart, NSE) - Long Position; short-term research idea.
Risk assessment: Medium {volume structure integrity & volatility risk}
Risk/Reward ratio ~ 4.25
Current Market Price (CMP) ~ 5930
Entry limit ~ 5925 to 5775 (Avg. - 5850) on April 25, 2025
1. Target limit ~ 6201 (+6%; +351 points)
2. Target limit ~ 6700 (+14.53%; +850 points)
Stop order limit ~ 5650 (-3.42%; -200 points)
Disclaimer: Investments in securities markets are subject to market risks. All information presented in this group is strictly for reference and personal study purposes only and is not a recommendation and/or a solicitation to act upon under any interpretation of the letter.
LEGEND:
{curly brackets} = observation notes
= important updates
(parentheses) = information details
~ tilde/approximation = variable value
-hyphen = fixed value

The more you rise, the harder you fall, or what?The month of March has been a strong month for the TVC:GOLD bugs. The commodity has been hitting new highs every week. Let's see where the next target could be.
MARKETSCOM:GOLD
Let us know what you think in the comments below.
Thank you.
74.2% of retail investor accounts lose money when trading CFDs with this provider. You should consider whether you understand how CFDs work and whether you can afford to take the high risk of losing your money. Past performance is not necessarily indicative of future results. The value of investments may fall as well as rise and the investor may not get back the amount initially invested. This content is not intended for nor applicable to residents of the UK. Cryptocurrency CFDs and spread bets are restricted in the UK for all retail clients.

GOLD knocking on heaven's door againAnd once again we are at the spot, where MARKETSCOM:GOLD is trying to go for another all-time high. Will we see another strong push, or is it time for the commodity to slow down and retrace? Let's dig in!
TVC:GOLD
Let us know what you think in the comments below.
Thank you.
74.2% of retail investor accounts lose money when trading CFDs with this provider. You should consider whether you understand how CFDs work and whether you can afford to take the high risk of losing your money. Past performance is not necessarily indicative of future results. The value of investments may fall as well as rise and the investor may not get back the amount initially invested. This content is not intended for nor applicable to residents of the UK. Cryptocurrency CFDs and spread bets are restricted in the UK for all retail clients.

Analysis on 10 Elite Forex and Commodity(Gold $ SiLVER) PairsWe trade on only these 10 Elite Forex and Commodity(Gold $ SiLVER) Pairs.I would be able to Assist you on analysis only when its these 10 Pairs that we Focus..ENJOY!!

Can further declines in DXY attract buyers of this commodity?ICEUS:CT1! futures have been on a steady decline for some time now. Could potential further declines in DXY attract buying interest of MARKETSCOM:COTTON ? Let's dig in.
Let us know what you think in the comments below.
Thank you.
74.2% of retail investor accounts lose money when trading CFDs with this provider. You should consider whether you understand how CFDs work and whether you can afford to take the high risk of losing your money. Past performance is not necessarily indicative of future results. The value of investments may fall as well as rise and the investor may not get back the amount initially invested. This content is not intended for nor applicable to residents of the UK. Cryptocurrency CFDs and spread bets are restricted in the UK for all retail clients.

Cocoa UK Commodity Quote | Chart & Forecast SummaryKey Indicators On Trade Set Up In General
1. Push Set Up
2. Range Set up
3. Break & Retest Set Up
Notes On Session
# Cocoa UK Commodity Quote
- Double Formation
* (Uptrend Argument)) | Completed Survey
* 2X Pattern Structure | Combo Feature & Entry Bias | Subdivision 1
- Triple Formation
* Numbered Retracement | 0.786 & 1 | Subdivision 2
* Trendline 1&2 | Neutral Bias | Subdivision 3
* Daily Time Frame | Trend Settings Condition
Active Sessions On Relevant Range & Elemented Probabilities;
European Session(Upwards) - US-Session(Downwards) - Asian Session(Ranging)
Conclusion | Trade Plan Execution & Risk Management On Demand;
Overall Consensus | Neutral

Uranium Commodity Quote | Chart & Forecast SummaryKey Indicators On Trade Set Up In General
1. Push Set Up
2. Range Set up
3. Break & Retest Set Up
Notes On Session
# Uranium Commodity Quote
- Double Formation
* (Reversal Argument)) | Completed Survey & Entry Feature
* 012345 | Wave Count | Subdivision 1
- Triple Formation
* 1st Retracement | Downtrend Bias | Subdivision 2
* 2nd Retracement | Continuation Entry | Subdivision 3
* Daily Time Frame | Trend Settings Condition
Active Sessions On Relevant Range & Elemented Probabilities;
European Session(Upwards) - US-Session(Downwards) - Asian Session(Ranging)
Conclusion | Trade Plan Execution & Risk Management On Demand;
Overall Consensus | Sell

"WHEAT" Commodity CFD Market Bullish Heist Plan🌟Hi! Hola! Ola! Bonjour! Hallo!🌟
Dear Money Makers & Robbers, 🤑 💰
Based on 🔥Thief Trading style technical and fundamental analysis🔥, here is our master plan to heist the "WHEAT" Commodity CFD market. Please adhere to the strategy I've outlined in the chart, which emphasizes long entry. Our aim is the high-risk Red Zone. Risky level, overbought market, consolidation, trend reversal, trap at the level where traders and bearish robbers are stronger. Be wealthy and safe trade.💪🏆🎉
Entry 📈 : Traders & Thieves with New Entry A bull trade can be initiated at any price level.
however I advise placing Buy limit orders within a 15 or 30 minute timeframe. Entry from the most recent or closest low or high level should be in retest.
Stop Loss 🛑: Using the 4H period, the recent / nearest low or high level.
Target 🎯: 5.700 (or) Escape Before the Target
Scalpers, take note 👀 : only scalp on the Long side. If you have a lot of money, you can go straight away; if not, you can join swing traders and carry out the robbery plan. Use trailing SL to safeguard your money 💰.
Fundamental Outlook 📰🗞️
Based on the current market situation and fundamental analysis, the outlook for Wheat is bullish in the short term. Prices are expected to continue rising due to supply and demand imbalances, weather-related issues, and geopolitical tensions. However, traders should be cautious of potential price volatility and keep a close eye on upcoming events that may impact wheat prices.
CURRENT FUNDAMENTALS:
Supply and Demand: The global wheat supply is currently outpacing demand, which has put downward pressure on prices. The International Grains Council (IGC) estimates that global wheat production will reach 765 million tons in 2023, up from 758 million tons in 2022.
Weather Conditions: Weather conditions in major wheat-producing countries such as the United States, Russia, and Ukraine have been favorable, which has supported wheat yields and production.
Government Policies: The US government's trade policies, including tariffs on Chinese goods, have impacted the wheat market. The US is a major wheat exporter, and trade tensions have reduced demand for US wheat.
Competition from Other Grains: Wheat is competing with other grains such as corn and soybeans for market share. The price of corn and soybeans has been relatively high, which has made wheat less attractive to buyers.
BULLISH SENTIMENT:
Weather Risks: 20% of traders and investors believe that adverse weather conditions in major wheat-producing countries could reduce wheat yields and production, which could support prices.
Trade Deals: 15% of traders and investors believe that a resolution to the US-China trade dispute could increase demand for US wheat and support prices.
Strong Demand from Importers: 10% of traders and investors believe that strong demand from importers such as Egypt and Turkey could support prices.
Trading Alert⚠️ : News Releases and Position Management 📰 🗞️ 🚫🚏
As a reminder, news releases can have a significant impact on market prices and volatility. To minimize potential losses and protect your running positions,
we recommend the following:
Avoid taking new trades during news releases
Use trailing stop-loss orders to protect your running positions and lock in profits
Please note that this is a general analysis and not personalized investment advice. It's essential to consider your own risk tolerance and market analysis before making any investment decisions.
Keep in mind that these factors can change rapidly, and it's essential to stay up-to-date with market developments and adjust your analysis accordingly.
💖Supporting our robbery plan will enable us to effortlessly make and steal money 💰💵 Tell your friends, Colleagues and family to follow, like, and share. Boost the strength of our robbery team. Every day in this market make money with ease by using the Thief Trading Style.🏆💪🤝❤️🎉🚀
I'll see you soon with another heist plan, so stay tuned 🫂

Is it Time for Commodity Currencies to Shine?As Trump announced tariffs on Canada and Mexico, which was bullish the USD, the CAD closed the day green as Commercial traders are net-long while Speculators are increasing their short position. Will fading this crowded trade (not max crowded yet) end up being one of the better trades during the first quarter of 2025? This is also not the only currency set up that way. Other commodity currencies include the AUD and NZD.
These three currencies are where Speculators are most short. Now we wait for the market to confirm the long trade with a news failure.
For new followers, the CMR process is to wait for Speculators (both small and large) to become extremely crowded and then fade their trade after a news failure in the market confirms the trade. You want to be on the same side as Commercials when the market turns.
Thanks,
Jason

SOYBEAN CFD Commodity Market Bullish Heist Plan🌟Hi! Hola! Ola! Bonjour! Hallo!🌟
Dear Money Makers & Robbers, 🤑 💰
Based on 🔥Thief Trading style technical and fundamental analysis🔥, here is our master plan to heist the SOYBEAN CFD Commodity market. Please adhere to the strategy I've outlined in the chart, which emphasizes long entry. Our aim is the high-risk Red Zone. Risky level, overbought market, consolidation, trend reversal, trap at the level where traders and bearish robbers are stronger. Be wealthy and safe trade.💪🏆🎉
Entry 📈 : Traders & Thieves with New Entry A bull trade can be initiated on the MA level breakout of 1050.00.
however I advise placing Buy limit orders within a 15 or 30 minute timeframe. Entry from the most recent or closest low or high level should be in retest.
Stop Loss 🛑: Using the 4H period, the recent / nearest low or high level.
Target 🎯: 1130.00 (or) Escape Before the Target
Scalpers, take note 👀 : only scalp on the Long side. If you have a lot of money, you can go straight away; if not, you can join swing traders and carry out the robbery plan. Use trailing SL to safeguard your money 💰.
Warning⚠️ : Our heist strategy is incompatible with Fundamental Analysis news 📰 🗞️. We'll wreck our plan by smashing the Stop Loss 🚫🚏. Avoid entering the market right after the news release.
Fundamental Outlook 📰🗞️
The SOYBEAN CFD is expected to move in a bullish direction.
REASONS FOR BULLISH TREND:
Weather Conditions: The weather conditions in the US and Brazil, the two largest soybean-producing countries, are expected to be favorable for soybean production. This will lead to a potential increase in supply, which will put upward pressure on prices.
Demand from China: China, the largest importer of soybeans, is expected to increase its imports of soybeans due to a shortage of domestic supply. This will lead to an increase in demand for soybeans, which will drive up prices.
US-China Trade Deal: The US and China have signed a trade deal, which includes an agreement to increase Chinese purchases of US agricultural products, including soybeans. This will lead to an increase in demand for soybeans, which will drive up prices.
Low Inventory Levels: The inventory levels of soybeans in the US are currently low, which will lead to an increase in prices as demand increases. When inventory levels are low, suppliers are less likely to offer discounts, and buyers are more likely to pay a premium to secure supplies.
Strong Export Demand: The export demand for soybeans is expected to remain strong, driven by demand from countries such as China, Mexico, and Japan. This will lead to an increase in demand for soybeans, which will drive up prices.
Production Costs: The production costs for soybeans are expected to increase due to higher costs for inputs such as seeds, fertilizers, and pesticides. This will lead to an increase in the cost of production, which will be passed on to consumers in the form of higher prices.
Government Policies: The US government has implemented policies to support soybean farmers, such as subsidies and tariffs. These policies will help to increase the profitability of soybean farming, which will lead to an increase in production and higher prices.
Market Sentiment: The market sentiment for soybeans is currently bullish, with many traders and investors expecting prices to rise. This will lead to an increase in demand for soybeans, which will drive up prices.
Technical Analysis: The technical analysis for soybeans is currently bullish, with the price trading above its 50-day and 200-day moving averages. This indicates that the trend is upward, and prices are likely to continue to rise.
Seasonal Trends: The seasonal trends for soybeans are currently bullish, with prices typically rising during the summer months due to strong demand from countries such as China and Mexico.
These fundamental points suggest that the SOYBEAN CFD is likely to move in a bullish direction, with prices expected to rise due to strong demand, low inventory levels, and favorable weather conditions.
Please note that this is a general analysis and not personalized investment advice. It's essential to consider your own risk tolerance and market analysis before making any investment decisions.
Keep in mind that these factors can change rapidly, and it's essential to stay up-to-date with market developments and adjust your analysis accordingly.
💖Supporting our robbery plan will enable us to effortlessly make and steal money 💰💵 Tell your friends, Colleagues and family to follow, like, and share. Boost the strength of our robbery team. Every day in this market make money with ease by using the Thief Trading Style.🏆💪🤝❤️🎉🚀
I'll see you soon with another heist plan, so stay tuned 🫂

GSCI Commodity Index - Will the Bull Shakeout End the CorrectionThe commodity bull market that began in 2020 might not be over yet. The last three years, 2022, 2023, and 2024, could merely represent a healthy retracement within a larger bull market. A few months ago, there was a minor panic just below a clear support level, after which the market rebounded, suggesting that such low prices were not sustainable in this market. Currently, on a 10 day timeframe, the MACD has issued a buy signal. I have no idea if this buy signal will ultimately propel prices much higher, but considering the recent shakeout of the bulls, I remain bullish.

Palladium: A Rare Trading Opportunity Palladium is currently trading at levels last seen in 2014 and 2018, hitting an extremely low support level. From here, I anticipate a bounce back to at least the previous high of $1,200 per unit.
📌 Next Target:
My projection is a rise to $1,500, which marks a strong resistance level.
Palladium is a highly demanded commodity, and at these low prices, it presents traders with an extraordinary opportunity to capitalize on its rebound potential.

Why are Interest rates falling? Time to buy? We have seen an amazing fall in interest rates.
Bonds have looked to put in a local bottom.
Why are bonds showing signs of accumulation?
Is the bond market pricing in a recession?
I believe the recent decline in yields is due to commodity weakness.
Yields have soften because energy & base metals have become cheaper.
This drives the disinflationary narrative.
I think its to early to tell whether this decline is from demand or global weakness.

Litecoin is a commodityIt is simple, you buy and hold.
Therefore, understand that Doge as well is a commodity too.
Be safe.

Brent Oil Getting Into A SqueezeLooking at the technical picture of EASYMARKETS:BRTUSD on our daily chart, we can see that the commodity is currently trading in a small range, roughly between the 81.83 and 83.98 levels. At the same, on the bigger picture, the price remains between two trendlines: a short-term upside support line taken from the lowest point of December 2023 and a downside resistance line drawn from the highest point of September 2023. This means that the pair is slowly getting into a squeeze. Although we might see some strong movement in-between the two trendlines, we would prefer to wait for a breakout first, before examining the next short-term directional move.
A push through the upper side of the aforementioned range and a break of the previously discussed downside line would also place EASYMARKETS:BRTUSD above the 83.98 barrier, possibly attracting more buying interest. A forthcoming higher high would be confirmed, potentially clearing the way towards the 87.87 zone, marked by the highest point of November 2023. If the buying doesn't stop there, the next aim could be at 89.58, which is the inside swing low of 19th of October 2023.
Alternatively, a price-drop below the lower side of the range and a break below the short-term upside line may set the stage for a move to lower areas. EASYMARKETS:BRTUSD could then fall to the 79.44 territory, a break of which might open the door for a move to the 76.64 level. That level marks the lowest point of February.
Disclaimer:
easyMarkets Account on TradingView allows you to combine easyMarkets industry leading conditions, regulated trading and tight fixed spreads with TradingView's powerful social network for traders, advanced charting and analytics. Access no slippage on limit orders, tight fixed spreads, negative balance protection, no hidden fees or commission, and seamless integration.
Any opinions, news, research, analyses, prices, other information, or links to third-party sites contained on this website are provided on an "as-is" basis, are intended only to be informative, is not an advice nor a recommendation, nor research, or a record of our trading prices, or an offer of, or solicitation for a transaction in any financial instrument and thus should not be treated as such. The information provided does not involve any specific investment objectives, financial situation and needs of any specific person who may receive it. Please be aware, that past performance is not a reliable indicator of future performance and/or results. Past Performance or Forward-looking scenarios based upon the reasonable beliefs of the third-party provider are not a guarantee of future performance. Actual results may differ materially from those anticipated in forward-looking or past performance statements. easyMarkets makes no representation or warranty and assumes no liability as to the accuracy or completeness of the information provided, nor any loss arising from any investment based on a recommendation, forecast or any information supplied by any third-party.

reminder commodity supercycles end in 2030oil price from 1971, stagflation? crisis 98? recession 2008? crisis 2020?
also when u realize why a lot country joined BRICS, why there is great reset in 2030, because it is the peak of the commodity bullish supercycle and the bottom of the USD buy power
