Crypto TOTAL Marketcap ; pray with meCrypto TOTAL Marketcap ; pray with me
3 options; nice dead cat bounce, massive last wave macro reinflation and of course our favourite; goblin town.
plan accordingly. this PA is fuckin cancer right now.
last MC idea, unfortunately the 'straight to heaven' option went to shit.
also check out my 13 and 17 bull macro fractals linked. there is still hope.
if we break down hard from here there prob isnt lol
being quite reactive at this point will prob save you bag holding if goblin town awaits.
gl
Search in ideas for "CRYPTO"

Cryptocurrency (Bitcoin & Ethereum) Daily Analysis 2021/05/25Hi Crypto Community! This is my first video analysis, if you find value in it, please do support by liking and following. Cheers!

Crypto Trading 101: The Elder RayHi Hoppers! Today we dissect the Elder Ray and learn how to take long positions along with the Parabolic SAR.
Without further due, let’s get into the Elder Ray!
Elder Ray
The Elder Ray is an oscillator with components of trend and momentum indicators to measure the strength of bullish and bearish trends. It uses exponential moving averages to generate signals and pinpoint the dominant power of the market. This indicator labels both trends as “bull power” and “bear power”. When the green sticks are longer than the red ones, the trendline becomes green to indicate that the bullish power is stronger than the bearish power. At this event, the Elder Ray signals a buy. When the red sticks are longer than the green ones, the Elder Ray signals a sell.
One drawback faced by the Elder Ray is that it provides too many signals in a ranging market. To improve the oscillator, we have added the Parabolic SAR to work alongside the Elder Ray. Thus, we only take a position when both indicators signal a buy.
What is the Parabolic SAR?
The Parabolic SAR is a trend-following indicator marked on the graph by black dots. When the black dots are below the price, the Parabolic SAR indicates a bullish market. When the black dots are above the price, it suggests a bearish market.
Elder Ray + Parabolic SAR
We can use the sell signals from the Elder Ray to close out positions. As the Elder Ray is quick to react to price changes, it is also fast to take your profits before the market turns against you. One positive aspect of the strategy is that it made big wins and small losses (during the short time we analyzed it). If your strategy has a winning percentage of 50%, but the winners make a 3% profit while the losses are at 1%, then your strategy will still be profitable even if you only win half of the time.
Have a great trading week ahead, and we will catch you on the next one!
—CRYPTOHOPPER—

Crypto Trading 101: Scalping Trends With DEMAHi hoppers, today we are looking at a scalping strategy that involves scalping trends by combining the DEMA with the ADX. First, let’s break down the Double Exponential Moving Average (DEMA).
Double Exponential Moving Average
To understand the Double Exponential Moving Average, lets first explore the “Exponential Moving Average”. The Exponential Moving Average (EMA) is one of the most frequently used indicators in the crypto sphere. The EMA is a trend-following indicator that is used to identify the direction of a trend. The EMA reacts quicker than the Simple Moving Average to price changes because the EMA gives greater weight to the latest closing prices. The DEMA reacts faster than the EMA by giving even more weight to recent closing prices.
We can use the DEMA on the 15 minutes chart to identify solid entry points. Keep in mind, the DEMA has the same weakness as all trend-following indicators: ranging markets. When the market is ranging, the DEMA will keep opening up new positions. Therefore, it is critical to use another indicator to identify when the market is trending, and when it is not.
Now let’s take a look at how to use the ADX to improve the profitability of the DEMA.
Average Directional Index (ADX)
The ADX is a volatility indicator that measures the strength of a trend. When the ADX is above 25, we can infer that the market is in a strong trend. This can be seen on the graph when the white line crosses above the black line, and the green cloud is active. You can see this better if you click on “Maximize the chart”. We have chosen to run the ADX on the 4-hour chart as the indicator tends to be more reliable on the longer timeframes.
For our exit strategy, we have not chosen any indicator. Instead, we have decided to exit based on our usual scalping settings:
Take profit 7%
Stop-loss 1%
Trailing stop loss percentage 1%
Arm trailing stop loss 1.5%
You can see the positions opened by the strategy better if you click on “Maximize chart”.
Have a great trading week ahead, and we will catch you on the next one!
—CRYPTOHOPPER—

Crypto Trading 101: Trading Bitcoin With The DMIThe Directional Movement Index (DMI) is one of the few indicators that can be used on its own in trading, especially when it comes to swing trading. The DMI can work as a standalone indicator because it is made up of multiple indicators, specifically: the +DI, -DI, and the ADX indicator. Let’s now dive into how these components fit together!
+DI & -DI
The +DI and -DI are two lines that measure the strength of positive and negative trends. +DI indicates a positive trend, and in our case, it is marked by the color blue on the chart. -DI represents a negative trend, and it is orange in our graph. When the +DI is above the -DI, the bullish pressure is larger than the bearish one. And if the negative line is above, the bears are dominating the market. Therefore, a bullish signal is given when the +DI crosses the -DI upwards, and a bearish signal is given when the +DI crosses the -DI downwards.
ADX
You may have noticed the positive (+DI) and negative (-DI) lines have crossed many times on the chart, but we have identified only a few signals (indicated by the green circles on the graph). This is because the signals from the +DI & -DI lines are filtered out by the ADX. The ADX identifies the strength of a trend and the volatility in the market. The white line on the bottom graph represents the ADX, while the horizontal black line has an ADX value of 25. Therefore each time the ADX is above the black line, it indicates a strong market trend and volatility.
Following June 3, 2020, the ADX filtered out all of the +DI and -DI signals until the 20th of July. Not trading was preferable as the market has been ranging and was not the best time to trade due to the low volatility.
We have used the following settings when creating this analysis.
Stop Loss: 5%
Trailing Stop loss percentage 2% and arming at 7%
—CRYPTOHOPPER—

Crypto Trading 101: ATR The Ultimate Volatility FilterHave you made a lot of profit during a trend, only to lose it during a range? With Cryptohopper’s Average True Range (ATR) indicator, you can now safely avoid ranges and only trade the profitable trends.
Without further due, let’s take a closer look at the ATR!
Average True Range
The Average True Range indicator (ATR) is a volatility indicator that increases and decreases in value to reflect the changing volatility of the market. For example, when the market is ranging, the ATR will have a relatively low value, while a high value indicates the opposite. This indicator can be used as a filter for trend-following or momentum indicators.
Here at Cryptohopper, we have taken this indicator a step further and added an exponential moving average (EMA) to the ATR to generate volatility confirmation signals on the crossovers between the ATR and the EMA. Within this system, a signal will be created when the ATR crosses the EMA upwards, indicating increased volatility. Another confirmation is generated when the ATR crosses the EMA downwards, displaying decreased volatility.
To make the ATR easier to spot visually, our team also added a green cloud for the periods with increased volatility and a red cloud for the periods with decreased volatility.
The ATR can work well with both momentum and trend-following indicator, so let’s take a look at what happens when we pair it with an indicator that has both components!
Moving Average Convergence Divergence
The Moving Average Convergence Trend (MACD) is a trend-following momentum indicator which generates signals on the crossover of two exponential moving averages. When the histogram turns green, a bullish crossover has taken place, and thus a buy signal is given, and when the histogram turns red a bearish crossover has taken place and a sell signal is given.
When you combine the MACD with the ATR, you will trade only when the MACD generates a buy signal, and the ATR confirms the volatility as displayed by the blue line on the graph.
We have used the following settings in our display of this strategy:
Take profit 3%
Stop-loss 2%

#Crypto Total Market Cap long-term view - bear market to come?Ignoring the Corona Panic phase with emotional sentiment we saw repeating patterns of the different market phases.
Follow that TA we are more in a very long Sideways phase as in the final Bear Market phase.
Despite one fakeout we are in the huge 2-week-candle from May 2021 - closing a 2-week candle outside this Sideways phase to the downside might bring the final Bear Market phase.
On the other hand this Sideways phase does take a long time so far - so maybe we will see new long-term patterns.
What are your assessments on that chart?
Drop me a nice comment if you'd like me to analyze any other cryptocurrency.
*not financial advice
do your own research before investing

Total Crypto MarketCap is very near to breakout so What next ?#Crypto Total MarketCap Chart Update:-
Now Total Crypto MarketCap is $2.388T
And now Total MarketCap Is trading at resistance level.
If break $2.50T Resistance than we can see Big Spike in Crypto MarketCap and All market prices.
Now $2.15T is strong support.
If breaks $2.50T then Next Stop could be $3.30T
Let’s see what will happen
So Keep an eye on l Breakout Point.

Crypto Market will fly!I did a lot of research an analysis, but everything is pointing out to the upcoming rally across the crypto market. When looking at Total Market Cap, it is quite obvious that there is a huge bull flat. If I to trade TOTAL, this would be my setup, but this could only be the very beginning of a huge rally.

XLM/USDT 1DAY UPDATE BY CRYPTOSANDERS !!Hello, welcome to this XLM/USDT update by CRYPTO SANDERS.
CHART ANALYSIS:- Stellar (XLM) was also in the green in today’s session, after two consecutive days of price declines.
XLM/USD peaked at 0.1154 earlier in the day, which comes less than 24 hours after falling to a low of 0.1122.
As a result of the decline, bulls continued to push the token away from a recent floor at 0.1100, and back on course toward resistance at 0.1320.
Today’s rebound was helped by the RSI reaching a floor of its own at 37.00, and it is now tracking at 39.87.
A ceiling at 44.00 now awaits bulls and could be the main hurdle preventing further gains this weekend.
I have tried to bring the best possible outcome to this chart.
Hit the like button if you like it and share your charts in the comments section.
Thank you.

Crypto - UPtober or HACKtober 🤔Hi Traders, Investors and Speculators
Ev here. Been trading crypto since 2017 and later got into stocks. I have 3 board exams on financial markets and studied economics from a top tier university for a year. Daytime job - Math Teacher. 👩🏫
October is notorious for upward price action on Bitcoin, earning the title UPtober about two years ago. However, a new trend has begun - HACKtober.
During this year, we see an increase number of hacking across the months but October has been the month with the most hacks and the most liquidity stolen. After 4 hacks within the last 48 hours, October is now the month with the biggest hacking statistically, and there is another 15 days to go. According to Chainanalysis, $718 million is accounted for to be stolen from DeFi protocols across 11 different hacks. At this rate, 2022 will surpass 2021 as the biggest year for hacking on record. So far this year, over $3 Billion accounted for has been hacked across 125 hacks. During 2019, most hackers targeted exchanges. Now, the biggest targets are DeFi protocols. Cross-chain bridges remain a major target, with 3 breached tis month accounting for 82% of all losses this month and 64% of all losses this year.
Let's discuss a few ways to minimize your risk when investing in this wild west market:
🖐 - Research the team. Perhaps the single most important success factor for any ICO or cryptocurrency is the developers and administrative team behind the project. The cryptocurrency space is dominated by major names, with superstar developers like Ethereum ETHUSDT founder Vitalik Buterin capable of making or breaking new projects simply by having their names listed on a development team. For that reason, it's increasingly common for scammers to invent fake founders and biographies for their projects.
🖐 - Check the whitepaper. The whitepaper should lay out the background, goals, strategy, concerns, and timeline for implementation for any blockchain-related project. Whitepapers can be incredibly revealing: companies that have a flashy website may reveal they lack a fundamentally sound concept. On the other hand, a company with a website containing spelling errors may have a whitepaper that indicates a rock-solid concept and a carefully conceived implementation plan.
🖐 - It it sounds too good to be true, it probably is. The idea of getting rich quick on an investment in a hot new project sure is tempting. Keep an eye out as you look for new investment opportunities in the ICO and cryptocurrency spaces. Remember that projects sounding too good to be true , likely are. Spend time scrutinizing every detail, and assume that the absence of a piece of crucial information may be an attempt to hide an unsound model or concept. Look for outside sources to verify the legitimacy of any project before making an investment. Ask questions that you can't already find the answers to.
💭 Whilst I remain bullish on Crypto, the above does reveal a worrisome trend for decentralized finance. Like this, DeFi still has a long way to go in terms of security. Hopefully the SEC case against Ripple will provide more clarity in terms of regulations and responsibility going ahead.
_______________________
📢Follow us here on TradingView for daily updates and trade ideas on crypto , stocks and commodities 💎Hit like & Follow 👍
We thank you for your support !
CryptoCheck

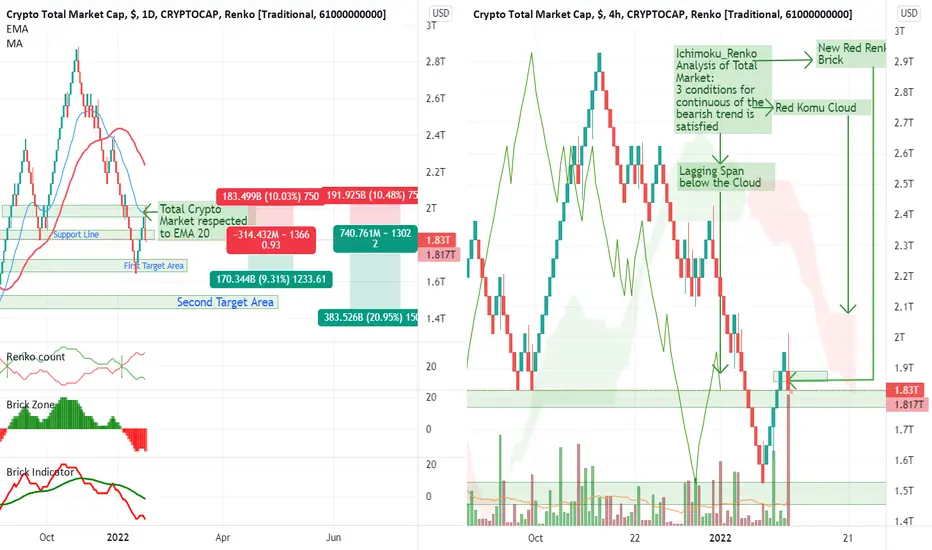
Crypto Market is Ready for a dropHi dear traders
Crypto Market respected EMA 20 and created a new Redbrick and is creating a Swing Pattern.
Ichimoku_Renko analysis shows that the conditions of the downtrend are met.
But we see a support level in the range of 1.826T. So to confirm this downtrend, it is better to wait for the breakdown of the support level.
WHERE ARE WE IN THE ALTS MARKET? - CryptoManiac101CRYPTO ALTS / USD
Where do you think we are right now? Did we find a local top or did we top off this bull market?

CRYPTO WEEKLY #21After two weeks of massive sell offs its rebound week for crypto and the moon boys are back in business! Throughout the crypto space we've seen big dips and big dip buying and we are currently in the midst of a bullish reversal towards new highs! (or not?)
Welcome to a new week of crypto and a new sentiment! Fear has taken place for hope and optimism and the bulls are back to take on the the bear fight. Tradingview is flooded with longs again and finally we can be bullish, right? Well, for the immediate short term, most likely yes but what most bulls won't like the admit; the dump has just started! I am personally not bullish on this market just yet and I don't think we have seen a true bottom. However that doesn't mean a day trader couldn't pick up some good dips along the way if he he or she would know when to sell. My outlook goes to see how the current trading week will develop rather than looking for buy ins - with specific interest for Tuesday's till Friday's trend. With the futures expiring on Friday and the month of June ahead it is very much to be seen how the coming weeks will turn out.
Historically speaking we have just started the bear market and are currently in a bullish reversal trend inside a longer bearish trend comparable to last full trading week of January 2018 (green arrow left on chart) and are likely in for more pain next week comparable to the first full trading week of February 2018 (red arrow on chart). Sure, it doesn mean it definitely has to play out the same way but the likelihood for another 40+% correction is definitely there! For my stance and position in the market it means that I calculate any dip buying with an increased risk, especially with the intention for a mid to long term hold.
So, that leaves me to my personal conclusion that I will not enter the market before the 31st of May 2021 and by doing so potentially miss out on substantial gains this week but at the same time cover an increased risk of substantial losses over the next week(s). The outlook for the current trading week is bullish however Tuesday and Wednesday will show us the true trend. Real bullish confirmations are to break 1.67tn market cap and hold it as support and a bearish outlook would be to see a rejection at this zone (blue box on chart). Price levels I look out for BTC are to be able to break back above 42K with a decisive breakout and retest on a 4 hour time frame or above. Anything below these levels is nothing more than a continuation of a bear trend.
The moon boys will be lift the mood from optimism to a small hype but it is to be seen if the bullish dream outpaces the bearish reality. (Check my latest BTC chart linked below for psychological price levels)
Laste note: my point of interest is the purple box. ;)
IMPORTANT: this is not financial advice, trade or invest based on your own risk and research.

BTC/USDT 1DAY UPDATE BY CRYPTOSANDERS !!Hello friends, welcome to this BITCOIN update from Crypto Sanders.
Hello dear traders, we are new so we ask you to support our ideas with your LIKE and COMMENT, also be free to ask any question in the comments, and we will try to answer all, thank you, guys.
The daily candle is still at the support level of $58.300k, which is a positive sign for Bitcoin price stability. This support level is important, and staying above it shows that the bulls are still in control.
If we break this support level, we will likely enter the $57k range, which indicates further bearish moves. The $60k support level is a crucial range that traders and investors are closely monitoring.
For now, the $58.300k support remains strong. As long as BTC does not fall below the $58k support on the daily timeframe, a rebound is likely. This means that as long as the price stays above this level, there is a good chance of a bullish recovery.
$58,000 is the main support level.
Current price: $58.888.
If the support breaks, the price could drop to the $57k range.
As long as the $ 58k support is not broken.
Do your own research before investing.
Trade safely.
Remember:-This is not a piece of financial advice. Stay tuned to us for further updates and analysis. Thank you!

BTC/USDT 1DAY AND 4HOUR CHART UPDATE BY CRYPTOSANDERS !!Hello friends, welcome to this BITCOIN update from Crypto Sanders.
Chart Analysis:- Analyzing Bitcoin’s (BTC) oscillators provides an essential snapshot of its current market stance. The relative strength index (RSI) at 56, Stochastic at 54, and commodity channel index (CCI) at 18 align in a neutral zone. This neutrality signals a balanced market sentiment, with neither overbought nor oversold conditions prevailing. These indicators suggest a period of consolidation, with potential shifts contingent on broader market influences.
The story told by bitcoin’s moving averages is one of subtle optimism. Similar to the past few weeks of analysis, the exponential moving averages (EMAs) over 10, 20, 30, 50, 100, and 200 days predominantly signal bullish sentiment, despite the 10-day EMA presenting some bearish sentiment. Conversely, the simple moving averages (SMAs) for these same periods also indicate positivity, including the 10-day SMA. This divergence in the shorter-term EMA reflects the inherent volatility and rapid shifts in market sentiment typical of crypto assets.
bitcoin has shown a strong uptrend, moving from a low of 15,479 to a peak of 44,729. However, the appearance of a significant Dec. 10 red candle with a long upper wick suggests possible resistance to higher prices or profit-taking activities. The volume, not showing a significant increase, hints at a cautious approach by traders, possibly indicating a lack of strong buying conviction.
As suggested by the daily chart, a prudent strategy would be to await a retracement towards key support levels for entry points. These levels could be previous resistance points or moving averages not explicitly marked. For exits or profit-taking, one should monitor the peak prices or the emergence of bearish patterns like multiple long upper wick candles, indicative of potential reversals.
The 4-hour chart offers a more granular view of Bitcoin’s price action, confirming the uptrend seen in the daily chart. Post-peak, the cryptocurrency entered a consolidation phase, marked by volatility and relatively low volume, suggesting a lack of significant sell-off. Entry strategies could involve observing price behavior at current levels or waiting for a rebound from a support level. In contrast, an exit strategy might include setting a stop-loss just below the recent consolidation to mitigate the risks of a breakdown.
The confluence of neutral to positive signals from oscillators and moving averages, coupled with Bitcoin’s resilient performance on the daily and 4-hour charts, points towards an optimistic outlook. The absence of clear overbought conditions and the cryptocurrency’s ability to sustain above key support levels paint a bullish picture.
Despite the current stability, underlying bearish signals cannot be overlooked. The mixed signals from the 10-day EMA and the appearance of the Dec. 10 red candle with a long upper wick on the daily chart hint at possible resistance and profit-taking. Should Bitcoin fail to sustain its current levels and break below key support zones, this could trigger a bearish reversal.
I have tried to bring the best possible results in this chart.
If you like it, hit the like button and share your charts in the comments section.
Thank you.

XRP/USDT 1DAY UPDATE BY CRYPTOSANDERS !!Hello friends, welcome to this XRP/USDT update from Crypto Sanders.
Chart Analysis:- XRP is also bullish and managed to book a 5% increase this week. However, the resistance at 68 cents is still to be broken before this cryptocurrency can aim for higher levels.
The support at 57 cents held well, and considering that buyers are dominating the market right now, XRP could continue to perform in the coming week.
this cryptocurrency could break the current resistance and aim to reach the previous high from July when XRP got close to $1.
I have tried to bring the best possible results in this chart.
If you like it, hit the like button and share your charts in the comments section.
Thank you.

ETH/USDT 1DAY UPDATE BY CRYPTOSANDERS !!Hello friends, welcome to this ETH/USDT update from Crypto Sanders.
Chart Analysis:- Ethereum (ETH) rebounded from Friday’s drop, making a run back towards the 1,800 level to start the weekend.
ETH/USD peaked at 1,796.57 on Saturday, after the price fell to a low of 1,751.44 less than 24 hours ago.
This climb means the world’s second-largest cryptocurrency has traded higher for nine of the last ten sessions.
this latest rally comes as the 10-day (red) moving average continues its uptrend versus its 25-day (blue) counterpart.
the RSI found a floor at 68.00, using it as a springboard to a current reading of 69.94.
Bulls will likely make further runs towards 1,800, despite overall price strength being overbought.
I have tried to bring the best possible results in this chart.
If you like it, hit the like button and share your charts in the comments section.
Thank you.

ETH/USDT 1DAY UPDATE BY CRYPTOSANDERS !!Hello friends, welcome to this ETH/USDT update from Crypto Sanders.
Chart Analysis:- Ethereum (ETH) also edged lower in today’s session, falling below the 1,800 mark in the process.
After reaching a high of 1,857.81 on Thursday, ETH/USD dropped to a bottom at 1,764.01 earlier in the day.
This decline has seen ETH snap a seven-day bull run, pushing the cryptocurrency away from a multi-month high in the process.
The drop coincided with the RSI failing to breach a resistance level of 74.00, and it is now tracking at a reading of 71.13.
Traders who are holding onto their long positions may begin to reconsider this, should the index fall below the 70.00 mark.
I have tried to bring the best possible results in this chart.
If you like it, hit the like button and share your charts in the comments section.
Thank you.

ETH/USDT 1DAY UPDATE BY CRYPTOSANDERS !!Hello friends, welcome to this ETH/USDT update from Crypto Sanders.
Chart Analysis:- Ethereum (ETH) reached 1,800 for the first time in several months, after being the beneficiary of general sentiment around crypto.
ETH/USD rallied to an intraday high of 1,845.99 earlier today, a day after trading at a bottom of 1,664.58.
ethereum reached its highest point since August 13, when the price was marginally below 1,860.
The move saw ethereum climb for a fifth straight session, as the RSI broke out of a resistance at 60.00.
ETH is now severely overbought, with the index now tracking at 76.79.
Bulls broke a ceiling of 68.00 over the last several hours, however it is unlikely that this will be sustained, as profit takers begin to loom.
I have tried to bring the best possible results in this chart.
If you like it, hit the like button and share your charts in the comments section.
Thank you.

BTC/USDT 1DAY UPDATE BY CRYPTOSANDERS !!Hello friends, welcome to this BITCOIN update from Crypto Sanders.
Chart Analysis:- Bitcoin bulls pushed the cryptocurrency over the 35,000 level on Tuesday, as momentum over a potential ETF approval intensified.
Following a low of 30,433.32 to start the week, BTC/USD surged to a peak at 35,150.43 earlier in the day.
This resulted in bitcoin climbing to its highest level since May 7, 2022, when the price was trading above 36,000.
Earlier gains have somewhat eased due to several factors, one of which being the relative strength index (RSI) moving deep into overbought territory.
the index is tracking at the 88.60 mark, which is its strongest reading since the start of the year.
BTC is now trading at 34,528.51, as traders have likely started closing off positions, in order to secure profits.
I have tried to bring the best possible results in this chart.
If you like it, hit the like button and share your charts in the comments section.
Thank you.

ETH/USDT 1DAY UPDATE BY CRYPTOSANDERS !!Hello friends, welcome to this ETH update from Crypto Sanders.
Chart Analysis:- Ethereum (ETH) on the other hand, fell for a third straight session, as the cryptocurrency collided with a long-term floor.
After hitting a high at 1,580.26 on Wednesday, ETH/USD plunged to an intraday low of 1,543.59 earlier today.
The move saw the world’s second-largest cryptocurrency close in on a support point at the $1,540 mark.
This comes as the 10-day (red) moving average continued to trend lower and extend its downward cross with the 25-day (blue) trend line.
The last time bears forced a breakout below the aforementioned floor, ethereum went on to fall to a seven-month low.
I have tried to bring the best possible results in this chart.
If you like it, hit the like button and share your charts in the comments section.
Thank you.

XRP/USDT 1DAY UPDATE BY CRYPTOSANDERS !!Hello friends, welcome to this XRP update from Crypto Sanders.
Chart Analysis, Ripple, was another notable mover on Monday, falling by over 4% in today’s session.
After reaching a high of 0.5218 on Sunday, XRP/USD plunged to a bottom at 0.4975 earlier in the day
This resulted in the world’s fifth-largest cryptocurrency moving to its weakest point since September 18.
Monday’s move occurred as the RSI retreated towards a support level at the 43.00 mark for the first time in three weeks.
the index is now at a reading of 43.60, with ripple trading at 0.5014, following a three-day losing streak.
In the event that the RSI falls under 43.00, XRP will likely edge below 0.5000 in the upcoming days.
I have tried to bring the best possible results in this chart.
If you like it, hit the like button and share your charts in the comments section.
Thank you.
