Lisk looks like bullOK, this one is kinda hard. It's definitely a rising wedge and rising wedges are "generally" bearish. But, we are very close to the trend line and daily MACD is very close to green.
I see two outcomes: first, we break up from this wedge. Second, we go down and test the trend line (around 0.0005s), then go up. Either way, it looks like a good buy opportunity if you ask me.
Search in ideas for "LISKBTC"

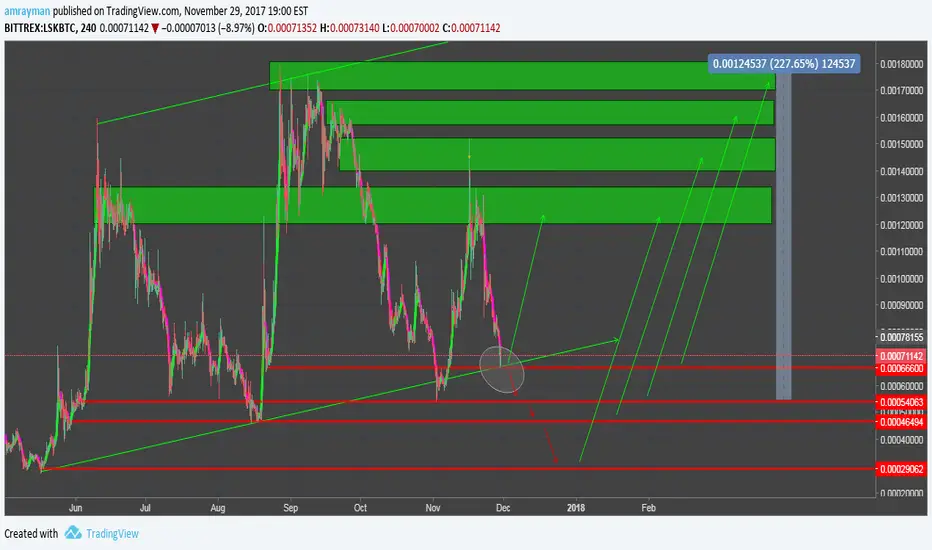
Lisk Long termThrough this analysis it consolidates my idea of lisk being a solid option for 2018.
In this chart pattern we can see how the market gave a sudden impulsive pattern about a month ago, after that it had a negative trend . When it touched the support it created a new trend that concurs with the elliot waves. After it's corrective pattern it created a impulse x2 to the previous one.
I expect to see a correction within the next 10 days. I see two possible scenarios here:
1. Having another impulsive trend starting at the first arrow on the left .
2. Having a down trend for couple of more days and then bouncing back with a very solid upward trend. Buy oportunity in the blue arrow on the right.
Appliying some fundamental here: Lisk has shown a nice performance in the past weeks giving several updates which have promoted a certain growth in the comunity. It has many plans for months within march-april that can significantly affect this coin. I will try to keep this topic updated.
Have a safe trade.
Thoughts?


LISK Back To Bullish LISK Back To Bullish
After last trade lisk went down fast at daily frame missed check long one at weekly, cost us stop loss and at the weekly frame as we saw lisk show wick and back to bullish again this is noob mistake but we still learn from our mistakes.
Lisk bounced well from 0.148 fib and now play at 0.382 fib looks very good still have long way to move in it free to buy now just follow capital managment.
Targets
Short-Term
(1) 0.00145211
Mid -Term
(1) 0.00178091
(2) 0.00221931
Long-Term
(1) 0.00284702
(2) 0.00348470
Stop limit at 0.00057531 be sure you now risk and reward before join any trade
risk- reward
37 % - 277%
Tip for the Day
Be a patient trader.
Paradoxical though it may seem, successful day traders often don't trade every day. They may be in the market, at their computer, but if they don’t see any opportunities that meet their criteria they will not execute a trade that day. That’s a lot better than going against your own best judgment out of an impatient desire to “just do something.” Plan your trades, then trade your plan.
capital management is recommended.
we ask Allah reconcile and repay.

LSKBTC - LISKLSKBTC - LISK ... Will support channel work again? Will see... Please follow, like and comment. Thank you :)


LISK trading opportunityLisk knocking at the resistance levels of the previous channel! if we break resistance at 0.00067 further upward movements can be expected! Higher targets than shown on the chart are possible and could be reached. But we have to account for bitcoin also knocking on the door and shutting down altcoins at any moment.


LISK/BTC Pair - Possible Head & Shoulders Downard MoveChart shows a 12-hour time-frame in simple line format. Possibly a head and shoulders top that has broken the neckline, and come back up again to retest it (red line), and now begun moving down again. If it were to reverse again and break above that line, it could signal a buying opportunity, but otherwise, I see this chart pattern as bearish.
The MACD on this time-frame also looks weak to me, at least it doesn't have near the strength of the previous upward trends, and it along w/ the RSI are both falling. Higher time frame indicators don't seem to support a breakout to the upside either.
Caveat: I'm fairly new to trading, this is my first published idea. Open for feedback.


LISK - Cup & Handle Formation, Fibonacci. Lisk has formed a cup and handle which give us an indication of where the prices could be heading next, the handle shows the support and resistance lines and depending on which one is broken will dictate where the price will head next. Keep in mind that Lisk development team is continuously cutting back their projects, therefore, there is still time to catch the trend before any news comes out or new programs are released like the Software Development Kit. If the support is broken you should use the Fibonacci percentages to indicate where the price is heading next.
Orange - Resistance.
Pink - Support.

LISK Touched bottom (50 - 120% target) - Time to tradeLISK touched bottom.
MACD and RSI indicators show bullish signs.
Chart shows bullish formation and possible breakout.
Buy in range 0.00075 - 0.00088
Stop orders at 0.00065.
Targets:
(1) 0.0012000
(2) 0.0018000
Remember: YOU DESERVE THE BEST!


CoinLoop AI Signal: Coin: Lisk LISK - BUYAI signal LSK
Indicator: Price touched support followed by large buy volume. Positive market sentiment.
Signal: Likelihood of price increase: 75%


Lisk 8 hour chart: TargetTarget: 12000
Stop-loss: 06800
After a move up from the long-term trend line and double top at the 0.618 fib level, lisk has undergone a correction and has now broken the downtrend. We are looking for an initial target back at the 0.618 level before we re-evaluate. Watch for a break of the demand zone I have indicated as it could signal a further move down. Good luck.

