LTC to $68.5LTC previously broke out a falling wedge and is heading to the wedge target at $63.66. The price is inside the 4H and 1D ichimoku cloud, and above the 2H cloud. LTC has completed and retested an inverse head and shoulders with at target of around $68.5 which would be confluent with the 4H and 1D cloud resistance.
There is strong resistance in the $64 region.
Search in ideas for "LTC@"

LTC/USD ANALYSIS (THE RUN TO $100!)LTC ANALYSIS:
LTC is in the same boat as ETH. Running thru all sense of resistance ands buyer FOMO starting to come into play. The yellow box should turn into a temporary support, and another wave should bounce off this support. The main targets for the future are Target 1 at $89, followed by Target 2 at 101 and Target 3 at 114. This analysis is not a short term target zone, this is for bag holders. There will be small turnovers along the way, for this analysis do not use leverage. RSI is oversold but does have room to run. Buyers look hungry and I expect a further incline upward towards to $100.
Possible Entries: 74-79

LTC how high can it go?LTC broke out from the midterm falling wedge with volume. Previously LTC broke out of a smaller widening descending wedge. The descending wedge target is at $51.5 .
I believe it is most likely there will be a pullback to retest the falling wedge. If the price bounce at the retest it will go the falling wedge target at around $80.
If all of this is a fake out and price go back in the falling wedge, that will be very bearish and price will not stop at $30 but go down to the previous low of $22.

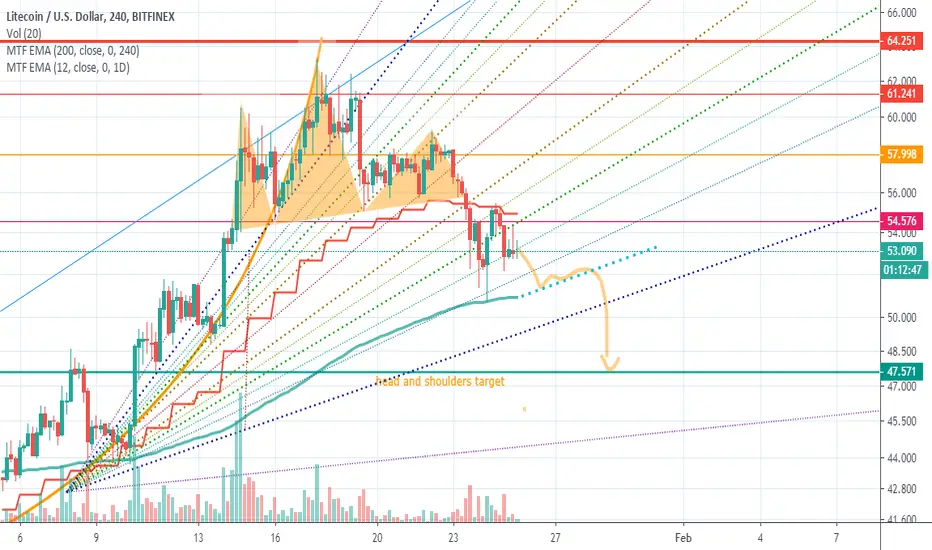
LTC it will not go upLTC fell out of a significant head and shoulders, failed on the retest which coincidentally was at the daily 12ema, a very strong resistance.
Price got support from the 4H 200 ema.
My opinion is that price cannot go over the daily 12ema. Price always fell hard after being rejected by the daily 12ema. Price will continue its downward path to reach the head and shoulders target.
Price is currently going down the Gann fan which is also a very bearish indicator and hard dumps always happen with gann fan failures.
It will test the 4H 200 ema again and sit on it before it dumps. LTC always likes to sit on support before it dumps.
LTC/BTC Potential Channel break LTC taking it's 3rd poke at the top of this trend line/channel. If it can break it there's clear upside after sliding for months against BTC. I've marked some key levels that should provide resistance should LTC break to the upside. If you can catch a retrace to the low-mid 60000 sat range that's a good spot to buy. Otherwise we can play the breakout accordingly. The daily RSI is pretty hot right now so I would expect a retrace or at least some consolidation. A low volume pullback/bullflag will be ideal. BINANCE:LTCBTC

LTC leading indicatorLTC likes to lead the market at some times, the charts show volume rising, and once LTC clears the $62 mark it will probably gear towards $94 EOY
Not financial advice, give a like

LTC breakthrough downtrend line. Pivot points.LTC breakthrough of the downtrend line. If price fixes above the trend line, movement to the region of 71-75 $ is possible.
If there is no consolidation, then a possible return to support in the region of $ 51. Be careful here! This support is critical. If it is not held back, then a possible decrease in the downward channel to the region of 36-32 $.
If support is maintained, then some kind of sideways movement will begin, as in the previous downtrend. Further on the situation. I specifically highlighted this zone on the previous downtrend and the situation now.
In the past downtrend, too, many people believed in a market turn when a long lateral movement began. What came of it yourself you see on the chart. Those who believe and do not exit stop loss from the market received a halving of funds.
All levels with goals and pivot points, on which the further price movement depends, I showed on the chart.
At the expense of stop loss, it is important not the size of the stop loss, which is more likely to be knocked down if there is a good movement, but the ENTRANCE MOMENT.
I trade LTC periodically. You can see other trading ideas for the last half a year at my related trading ideas.

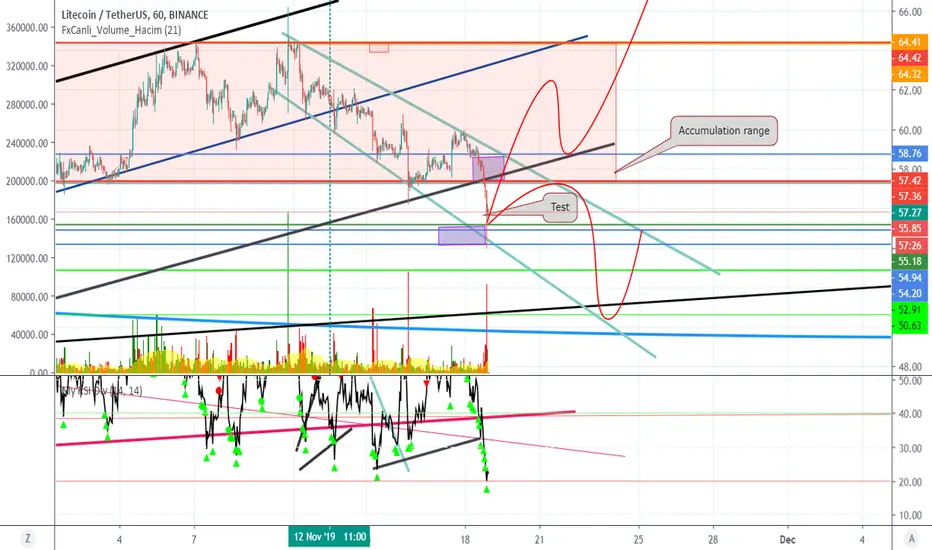
LTC, possible Wyckoff liquidity testLTC has been trading in a range that can be considered a Wyckoff accumulation zone, where whales buy LTCs from shaken and frightened plebs. The dump can just be a liquidity test to shake out the final plebs' weak hands.
But to avoid sounding permanently bullish, I have drawn a bearish scenario.
My prior idea,below, was right, where I grudgingly considered a drop to $55.
LTC is Generous - %100 Profit Opportunity Approaching LTC is forming a beautiful ABC formation which will probably end in 37-43 usd range. Really beautiful pattern to play.
I am accumulating from these levels as well. Will be laddering all the way down.
After the crash it is obvious that LTC will give us a x2 bounce as it always does. Target will be around 80-90 usd, details will be discussed later.
This is a mid-term trade, can take up to 1-3 months.
Accumulate wisely.
No stop loss for now, laddering all the way down.
PS: Breaking below to 20 USD levels also should be considered if BTC breaks below 4000 usd.

Ltc analysis for long term, See which level is best for buyLTC maked an head and shoulder pattern and now its in down trend to following its pattern. i am marked support become resistance level, from where i think ltc can up for the pattern retrenchment and also show when can go for retrenchment.
If you like please consider to follow me.
Thanks

LTC WEDGE BREAKOUT!LTC had down sloping consolidation on top of the wedge and finally decided to break to the upside. The 0.618 target has been reached with volume and MACD bearishly diverging. RSI has double toped on the 15 minute timeframe suggesting a short term pullback or last least a consolidation period. Let us hope that price can hold above this $70 area so another leg up can follow. Upper targets are now the 0.886 and 100% retrace of the wedge around $73.45.
Let me know what you think! Will LTC have the momentum to shift trends!?

LTC will kick-off the rise of the Altcoins...and BTC!LTC (and EOS) kick-started the bull-market in February, where Bitcoin did it in April. EOS has started its rise now, LTC will soon follow!

LTC/USDT (1D) LTC Still Holds the Main Support with Perspective LTC still holds the main support with perspective to form a double bottom. The chart tells everything and there is nothing to add. Right now we have a good opportunity to enter either with StopLoss under the main support or with safety buy orders at the lower levels. It depends on your strategy. Good luck everyone!
DISCLAIMER:
This is just my opinion and view of the market. Please keep this in mind and consider in your trades.
Hit "Like" if you like my analysis. That would help me to understand if you really liked it :-) !
Trading ideas are not trading recommendations - this is just my point of view. You can agree or disagree with it.
Your likes and comments really help me. So I thank everyone in advance who really does it!
Subscribe if you would like to get my fresh updates on the market and my TA on the regular basis.
Good luck everyone!

LTC making higher lowsLTC looking good on the USD pair, not so much on the BTC pairing. Making higher lows, halvening happens in about 6 hours. Think we should see growth here from the USD pair. If BTC nukes LTC will probably follow. So be careful. Looks good to me though to clear 100+, depending on what Bitcoin does. Also should be a nice long term HODL if you prefer.
Disclaimer: I am not a financial advisor, and this is not financial advise

LTC long ideaLTC long idea.
Buy 0.0076-0.0081 (daily 1D bullish OB)
T1: 0.0105 (1st 1D bearish OB)
T2: 0.0115 (2nd 1D bearish OB)
T3: 0.0142 (3rd 1D bearish OB)
Reasoning:
C wave in a larger WXY correction.
C wave is a zigzag 5-3-5 correction with an extended 1st wave correction.
1D bullish OB in the green box.
there is 1 below it at 0.0071 which may also be a target. but since the USD version of LTC looks bullish af, i don't think we'll hit thta.
Simple bullish divergence appearing on the RSI, slow and fast oscillators over 14 periods. medium strength signal.

LTC ready to bounce here! LTC has dropped considerably recently but it has just broke above resistance and could be set up to rise to previous POC
Waiting for a daily close above this level is recommended for confirmation but it is looking good with OBV making a HL while price continued to make a LL
With the halvening coming up and the NFL news today, LTC isn't looking as bad as everyone says

LTC USD Update! LTC USD POSSIBLE DOUBLE BREAK OUT?!LTC After testing three times the 138 $ resistance is apparently retracing on the old resistance of the descending triangle and simultaneously on the major ascending triangle.
A big move is possible in the next few hours.
-- This is not financial advice, for illustrative purposes only. Thanks! --
Push the like button if you agree! Or leave a comment for question.
If you want to see more chart analysis or updates, don't forget to follow me!
You can find me also in Twitter --> @cryptogabri

Ltc smaller time frame forecast!LTC is made a perfect correction that will push him o new highs so watch for buys:). Now you have in 5 min a perfect small correction the will break for the bigger top...lets hope the LTC will start parabolic in a bigger time frame!

LTC BULL - BOTTOM LTC surging back - nobody is pricng in potential LTC Futures on TD Ameritrade. Great set-up tonight before UTC close at 8PM EST ...in my humble opinion.
Let's get it!

LTC Block reward Halving...... 05:48; August 6; 2019LTC block reward halving: litecoinblockhalf.com
Lots of people suspect block reward halvings boost the price of the cryptocurrency, we've seen btc-usd advance after block reward halvings.
Did you see vertcoin VTC go from under $1 to almost $12 in the three months leading up to its halving in December 2017?: btcmanager.com
$144 is a key trigger point - once LTC reaches this level, bulls will go into reckless mode.


LTC diamond bottom pump to the HalvingLTC looks like it could be forming a diamond bottom.
Zooming out immediately makes me ignore that for continued downsie to the LTCM19 Expiry, however BullBearFilter is showing possible long signla and stoch is turning up.
Moving averages and pointing down on the daily but only just so that could change
then factor in the LTC halving not too far away

LTC Cup and Handle PT3LTC/LiteCoin is above $90 and not to long ago i suggested a cup and handle is in play. i believe it is ready to shoot to its targets of $156+.
Why? You can see that there a like 2-4 candles that have been shown and that this handle looks like it is just about to finish resulting in the epic bull run to come.
If that dose not convince you then i hope your right but if im right then you have sadly missed out.
so.. my indicators are very bullish
that is all on LTC today. i will be posting BTC news here either within the hour or in the morning:)
Peace Ya'll!!
