Microsoft OBSERVATION - Golden GatesMicrosoft has experienced its first golden cross since Feb 2019. Upon its previous occurance, Microsoft rallied from 108 to 190. I am not suggesting this will happen again, however. It’s very likely that Microsoft will see a double top before a fall back down. I would, from technical indicators, suggest that MSFT still has an interest in following the mapped trendline.
It’s equally as easy to get stopped out in this position, though. We can see the level at 161 being a very important support level should it hit before rallying.
Search in ideas for "MICROSOFT"

Microsoft (MSFT) Technical Update & its channelMicrosoft (MSFT) Technical Update & its channel
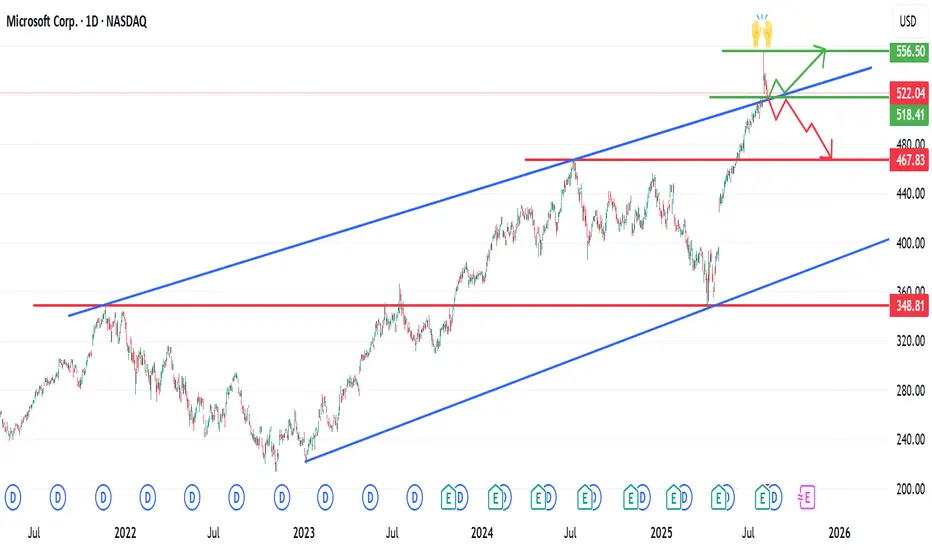
Microsoft began forming a long-term ascending channel as far back as November 2021, marked by three higher highs and two higher lows, as illustrated on the chart.
The price action became particularly interesting when it broke out of this channel, reaching a new all-time high (ATH) of approximately $557.
However, the underlying fundamentals (catalysts) were insufficient to sustain momentum at that level, leading to a pullback.
The stock is now consolidating around the $522 zone — a key confluence area where the ascending trendline meets a horizontal support level.
Outlook:
If price breaks below this zone and re-enters the channel, a deeper correction could follow, with potential downside targets in the $500 – $480 range.
As always, I encourage you to review the chart, share your thoughts in the comments, and connect if you’d like to discuss further.
Microsoft (MSFT)–Watching for Pullback Entry After $4T MilestoneMicrosoft Corp. NASDAQ:MSFT has become the second company after Nvidia to cross the $4 trillion market cap, powered by strong AI and cloud demand.
Azure revenue grew 34% to $75B in 2024, with a $30B AI infrastructure investment fueling future growth. Q4 EPS came in at $3.65 on $76.4B revenue, showing strong fundamentals.
We are looking for a pullback to key support for a long entry:
Trade Plan:
Entry Zone: $515 – $518
Take Profit: $536, $555
Stop Loss: $502
#Microsoft #MSFT #Stocks #Trading #StockMarket #TechnicalAnalysis #AI #Cloud #BigTech #NASDAQ

MICROSOFT Correction under the MA50 (1d) expected.Microsoft is trading inside a 14month Channel Up.
The MA50 (1d) is supporting since October 6th 2023, which is the same time length as the last Bullish Leg of the Channel Up.
It seems we are in a similar Bullish Megaphone Top formation.
Trading Plan:
1. Sell on the current market price.
Targets:
1. 395.00 (Support 1, which was the target during the previous Channel Up correction).
Tips:
1. The RSI (1d) is also forming an identical Bearish Megaphone as the June-July 2023 top.
Please like, follow and comment!!
Notes:
Past trading plan:

MICROSOFT Buy with a plan BMicrosoft / MSFT found support at 309.50, more or less where the August 18th low was priced, and put the Channel Down pattern on hold.
It is quite possible for a Rectangle to emerge as a hold of Support A (309.50) would potentially mean a test of Resistance A (341.10).
The 4hour MACD forming a Bullish Cross, certainly leads towards that direction.
As long as Support A holds, buy and target 340. If it fails and breaks, sell and buy on the 1day MA200 (target 320.00).
Previous chart:
Follow us, like the idea and leave a comment below!!

MICROSOFT - Long PositionMicrosoft earnings beat across the board, stock up on outlook, Microsoft's $15 billion cybersecurity business is giving investors new reason for optimism.

Microsoft Forming A Textbook TrendMicrosoft is following a pattern of trend then pullback/consolidation followed by trend and so on.
Although the pullbacks and consolidation zones do last a few weeks, this stock is a consistent mover,
and just requires patience if a position is held.
At the moment, we are seeing a trend in play, forming higher highs and higher lows with price now
making its way towards the all-time high at $263.
The 50 simple moving average is below and should act as support if we experience a deep pullback.
The last time price made contact with this indicator was back in March of this year. The fact that
price has not hit it since demonstrates how smooth the current bullish move is.
Microsoft has formed strong linear trends in the past and although the current move is not linear,
we could see momentum pick up and form another nice move.
The $300 round number is above and is the next level of resistance as this is a psychological level.
We are now in a waiting game as price approaches resistance.
See below for more information on our trading techniques.
As always, keep it simple, keep it Sublime.

Microsoft Trend ChannelMicrosoft has been following an upward trend channel. It gapped up and broke out of the channel on Oct 27 due to good earnings report. Microsoft held its price and I expect it to continue holding within the channel. I believe a good entry would be as it falls back to the trendline at approximately 76.00. I am watching closely to see if it breaks below the trendline which would be a bearish signal.
The Current stock price is above both the 150 day and 200 day moving average.
The 200 day moving avg line is trending up (for at least one month) early in the year.
The Current stock price is trading above the 50 day moving average.
The current stock price is at least 30 percent above its 52 week low. ( 36% above it's 52 week low)
The current price is 96% of it's new high.

Microsoft Corporation (MSFT) Tends To Drop Post-EarningsMicrosoft Corporation has been trending upward as are most stocks and sectors since the U.S. elections last year. Although "good" numbers and much hype surround markets, Microsoft has not had great results after their earnings calls for the last four years. The stock is also at the top of its clearly defined trend channel which has always resulted in a decline over the next few weeks. We have laid out a study of historical movements for the stock in this article. Will history repeat itself again causing a 5% plus drop?
When we look at technical indicators, the relative strength index (RSI) is at 78.4752. RSI tends to determine trends, momentum, overbought and oversold levels as well as likelihood of price swings. I personally use anything above 75 as overbought and anything under 25 as oversold. The RSI is currently overbought. This milestone has occurred 112 times and its significance is discussed below.
The positive vortex indicator (VI) is at 1.3159 and the negative is 0.6303. When the positive level is higher than 1 and higher than the negative indicator, the overall price action is moving upward. When the negative level is higher than 1 and higher than the positive indicator, the stock is moving down. The positive and negative are at somewhat extreme levels away from their central point of 1. Their current retreat back to 1 typically flags the end of the upward movement while signaling a drop for the stock.
The stochastic oscillator K value is 94.8017 and D value is 81.1292. This is a cyclical oscillator that is highly accurate and can be used to identify overbought/oversold levels as well as pending reversals and short-term activity. I personally use anything above 80 as overbought and below 20 as oversold. When the K value is higher than the D value, the stock is trending up. When the D value is higher that the K value the stock is trending down. The stochastic is certainly in overbought territory. The D value is still well below the K value and it could be a few more days before the D is greater than the K. When this crossover occurs, the stock could be ready to drop.
SPECIFIC ANALYSIS
Only one other time since 2000 was the RSI and positive VI at or above today's level at the same time the stochastic oscillator was overbought with the earnings call three days away. The stock dropped 5.21% over the following 14 trading days on that occasion.
The stock has dropped 12 of the last 17 times from its close price three days prior to the earnings call. Of these 12 occasions, the minimum drop is 0.67%, median drop is 4.40%, and maximum decline is 14.97%.
On four occasions since the start of the Dot Com Bubble Burst has the RSI and positive VI been at the same level while the stochastic oscillator was overbought. The minimum days to hit a bottom was 14 and the minimum stock loss was 4.62%. The median stock decline was 5.81% and maximum was 16.54%.
On 12 occasions the RSI and positive VI have been near their same levels are higher while the stochastics oscillator was overbought. The stock has dropped a minimum of 3.03% and median of 5.79% throughout these instances.
The RSI has closed at or above its current level 112 times since 1986. Over the next 30 trading days from this point, the stock does not always drop, the median decline is 6.86% and average loss is 8.68%.
Finally, the stock has been in a discernable trend channel since April 2016. The stock hit the top of this channel on Friday which it has done five other times since it began. The quickest drop from the top has occurred in three days and the slowest bottom occurred in 20 days. The minimum drop from the top of the channel is 3.23%, median is 4.79%, and max is 5.79%.
Between all of the aforementioned historics, we are confident the stock could drop at least 3.5% over the following 35 trading days. The significant drop should take shape after earnings are announced around October 26. Remember, even positive earnings have resulted in declines.

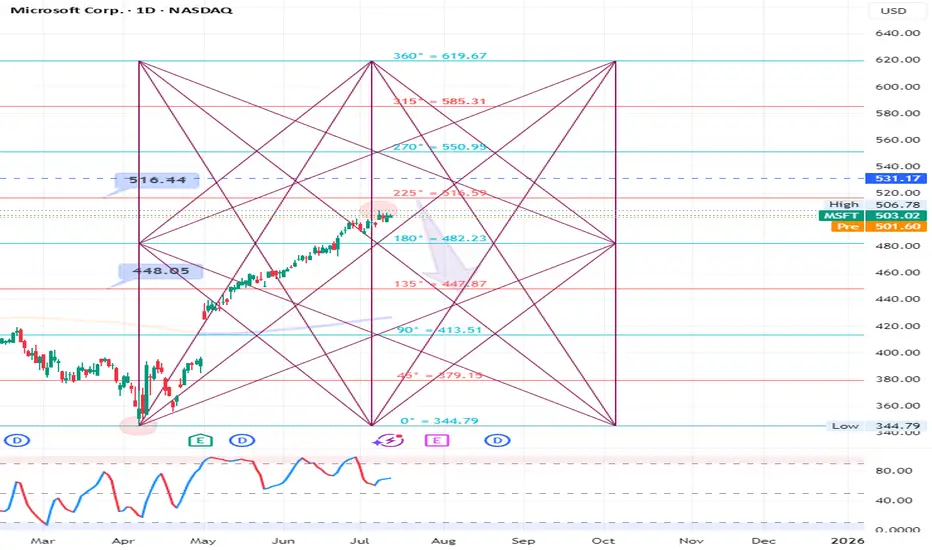
#Microsoft #MSFT Sell Setup #Microsoft (US Stock) Sell Setup
Last Close : 503.02 , Sell On Rise Around 516.59 And Sell More At 531.17 If Comes For The Target 448
#Gann #DowJones #Nasdaq
Microsoft Diamond Formation doesn't seem to be forEVAMicrosoft is also in troubled waters with the fight of tech and AI wars taking place.
Azure Slowdown: Cloud growth wasn’t as strong as investors wanted.
AI Competition: DeepSeek’s cheap AI models are shaking things up.
High Spending: They’re pouring cash into AI, worrying investors about profits.
And as Bullish as I am normally with Blue Chips, Right now, things are looking down for the tech giant.
Medium Probability Analysis
DIamond Formation
Island reversal - Downside to come
Price<20 but above 200MA
Target $318

Microsoft Update: Key Levels to WatchMicrosoft ( NASDAQ:MSFT ) is at an important point right now, and here’s what to look out for:
If we close above $442: There’s a good chance we’ll see targets at $453 or even $478 as buyers take control.
If the price breaks down out of the current range: A correction to $422 or $415 becomes a strong possibility.
Stay focused on these levels and let the market show you the way forward. No need to force it—patience pays.
Kris/Mindbloome Exchange
Trade What You See

Microsoft Head & Shoulders, $MSFTMicrosoft, the third largest company by weight continues to struggle since July. The troublesome part is that it appears to be building up a massive head and shoulders pattern all of this year. Additionally, the third shoulder is also looking like a huge bear flag and remains weak compared to the overall market.

MicroSoft Long Microsoft is currently sideways and will continue this movement for now. To cash on this sideways movement we can play support and resistance to buy and sell on key levels until it makes new Highs.

Microsoft - the top is likely here!Microsoft saw a big green to red reversal today on heavy volume at the All time highs of the chart.
If this bell weather name is finally done trending higher it sure to weigh in on the indices even with the slightest pullback.

Microsoft has 'first mover advantage' in 365 Copilot launchMicrosoft (MSFT) is set to launch its new 365 Copilot AI assistance — could this be the tech giant’s iPhone moment?
Price Momentum
MSFT is trading near the top of its 52-week range and above its 200-day simple moving average.
The price of MSFT shares has increased $0.46 since the market last closed. This is a 0.14% rise.
What does this mean?
Investors are applying buying pressure to MSFT shares today.

MICROSOFT Buy on the MA200 (1d) or on a Bullish Divergence.Microsoft is pulling down on a Channel Down.
Having failed to hold the 1.5 Fibonacci Channel level, it technically seeks the lower 1.0 level, which is where the MA200 (1d) currently is.
Trading Plan:
1. Buy on the MA200 (1d).
2. If it closes a (1d) candle under the MA200 (1d), then buy only after the first sign of an RSI bullish divergence.
Targets:
1. & 2. 340.00 and after a 1.5 Fib pull back, 367.00
Tips:
1. On a similar downtrend before the global market bottom was priced on November 4th 2022, the RSI (1d) was already on a Bullish Divergence. This is the reason for the second buy entry.
Please like, follow and comment!!

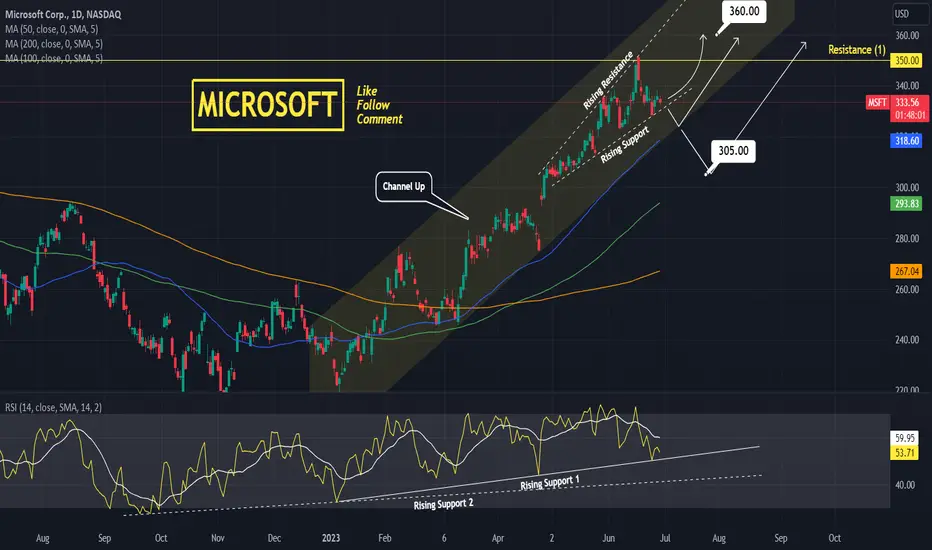
MICROSOFT remains bullish as long as the MA50 (1d) holdsMicrosoft is having a technical pull back inside the Channel Up that started at the beginning of the year.
It is testing the first Support level, the Rising Support line inside the Channel, with the second level being the MA50 (1d).
As long as it holds, the trend remains bullish.
Trading Plan:
1. Buy above the MA50 (1d).
2. Sell if a (1d) candle closes under the MA50.
Targets:
1. 360.00.
2. 305.00 (expected contact with the MA100 1d).
Microsoft is not ready for more upside Microsoft is not ready for more upside Now , it should be down for make last wave of triangle
Under FWB:250 is buy opportunity for all new high

Microsoft Corporation (MSFT) bullish trendMicrosoft Corporation (MSFT) based on technical indicators commonly used by stock brokers and experts.
Overall, based on the technical indicators, MSFT appears to be in a bullish trend, with a "Strong Buy" rating based on moving averages and technical analysis.
The current stock price for MSFT is $283.18, with a 1-month high of $284.46 and a 1-month low of $245.61. The price has increased by 0.50040813% or $1.41, which is a relatively small gain, indicating that the stock may be consolidating or in a short-term correction.
The Oscillators Rating is "Neutral," which means that momentum indicators are not showing a clear direction for the stock price in the short-term. The Relative Strength Index (RSI) is at 64.7315736, which is above the 50 level, indicating that the stock is in a bullish trend, but not yet in overbought territory.
The Stochastic %K (14,3,3) is at 87.30991423, which is above the overbought level of 80, indicating that the stock may be due for a correction in the short-term. However, the Stochastic %D (14,3,3) is at 83.47672967, which is also above the overbought level, indicating that the bullish momentum may continue in the near term.
The Average Directional Index (ADX) is at 36.8321884, which suggests that the stock is in a trend, but the strength of the trend is not very strong. The MACD Level (12, 26) is at 4.55233401, which is positive and above the signal line of 4.6224275, indicating that the stock may be in a bullish trend in the short-term.
The Aroon Up (14) is at 92.85714286, which is above the Aroon Down (14) of 0, indicating that the stock is in a strong bullish trend. The Bull Bear Power is 9.08816121, which suggests that the bulls are currently in control of the stock price.
In terms of moving averages, MSFT has a "Strong Buy" rating based on the Moving Averages Rating, with the Exponential Moving Average (20) at 275.6322072, the Exponential Moving Average (50) at 267.92250002, and the Exponential Moving Average (200) at 255.35050369. The stock is also trading above the Simple Moving Average (10) of 278.57339 and the Exponential Moving Average (30) of 272.56085621, both of which are also bullish indicators.
In summary, based on the technical indicators analyzed, MSFT appears to be in a bullish trend in the short to medium-term, with a potential for a correction in the near-term based on the Stochastic %K indicator. However, the overall trend remains positive with moving averages and other indicators suggesting a "Strong Buy" rating for the stock. As always, it's important to conduct thorough research and analysis before making any investment decisions.

Microsoft Potential Retest of BreakoutMicrosoft has been ripping lately, but as you can see price is way outside the upper bollinger band, wouldn’t be surprised to see a retest of the breakout next week.
Not financial advice.

MICROSOFT - Short PositionMicrosoft's Lead Kinect and HoloLens Developer Leaves the Company After Abuse Allegations

Microsoft Stocks will be BullishMicrosoft's Stocks is in a Descending Channel and Now the Price is at the Bottom of that Channel. The Price Will Start to Increase to the Top of the Channel Pretty Soon because the Fact that It is at the Bottom of the channel, makes it enough Reason to Increase and also we have a Regular Bullish Divergence on MACD Indicator as well Which is also another Reason for Us to Think about Bullish Stuff!
_ _ _ _ _ _ _ _ _ _ _ _ _ _ _ _ _ _ _ _ _ _ _ _ _ _ _ _ _ _ _ _ _
Thank you for seeing idea .
Have a nice day and Good luck
