MICROSOFT Idea Microsoft is expected to break the range, as the company won a defense cloud contract.
Search in ideas for "MICROSOFT"


Microsoft Buy IdeaMicrosoft Buy Idea @ Monthly Demand Zone (102.39 - 97.43)
Buy Limit: 102.39
Stop Loss: 96.19
Take Profit: 110.62
Risk Management = 0.01/$100
Recommended Leverage not to exceed 1:50
Recommended Risk Ratio 1:1.5 – 1:3
Close partially the contract once it reaches 50% of profit, Move stop loss over the entry level
Close partially the contract once it reaches 80% of the profit

Microsoft in watch list for a buy trade Microsoft in watch list for next week:
price will retrace (probably today 2018-09-14) and stochastic will go down.
Wait for stochastic in oversold area then buy MSFT


MICROSOFTTuesday, 4 October 2022
22:15 PM (WIB)
Facts About Microsoft
Microsoft enables digital transformation in the era of an intelligent cloud and an intelligent edge.
Its mission is to empower every person and every organization on the planet to achieve more.
For more details about Microsoft, please come visit the website .
Microsoft Wednesday, 9 December 2020
22:34 PM (WIB)
This the best time period to open an order for Microsoft for long terms transactions. After recover from heavy overbought, Microsoft quickly restarts the uprising wedge formation as usual and consolidates into Inverse Head & Shoulder formation. It is only a matter of time for the right shoulder to be shown with superpower bulls.
Best regards,
RyodaBrainless
"Live to Ride and Ride to Live"

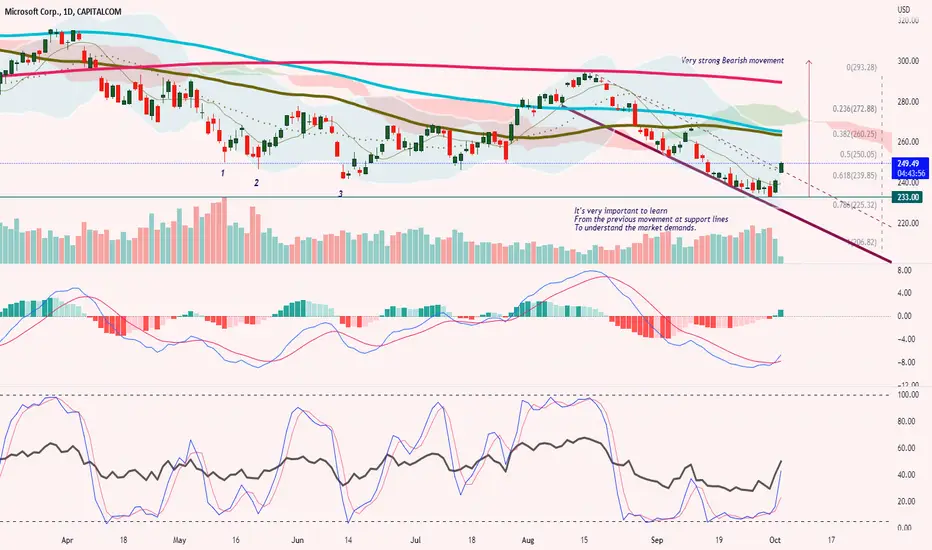
MICROSOFTFriday, 21 October 2022
23:38 PM (WIB)
Microsoft is under a heavy bearish market and locked down the middle lines as their support.
I'm not interested to trade in this Asset right now.
Might be at $190 would be good to enter the market as a bull.

Microsoft lHi Traders
Microsoft here @ demand Zone
if it breaks out it can reach 315 area.
drive safe

microsoftthe sellers are gettin weack after a big rally we can make a good profit of it
the microsoft is getting supported with a big support line after breaking the first prz it can be goo tiny profit
but after crossing the big prz point im going for huge profits
like and share if it was helpful

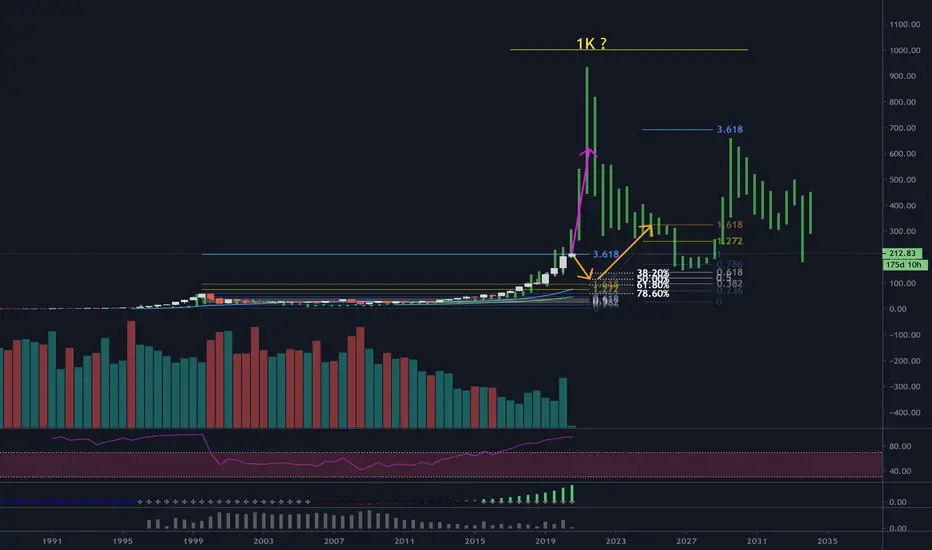
MICROSOFTThese are my thoughts on MSFT. They are meant to give you an idea, not trading advice.
Microsoft hitting resistance on a 6 month time frame.
Will it cool off here and retrace, or is this going to shoot for the stars.
These are 6 month candles, so it will be interesting to see what it will do in the long term.
I placed a bubble pattern on top of it to see what it "could" do if it blows out of proportion. This would mean it could hit 1K by the end of this year.
Please be careful, as the market never gives you certainties, only probabilities!
ALWAYS REMEMBER THIS WHEN YOU TRADE

Microsoft A bearish candle formed on 29 April, signaling a short term turnaround.
Prices are very probably heading lower tomorrow morning.
Support at 168 & Resistance at 190.
Here is my long term latest analysis

Microsoft - Monthly Bullish BreakoutHello Traders, welcome to today's analysis of Microsoft.
--------
Explanation of my chart analysis:
Since August of 2019 Microsoft stock has been creating a bullish triangle continuation pattern. Recently we saw a breakout above the strong $350 resistance level after which I do expect a retest of the previous structure level and then more bullish continuation towards the upside.
--------
I will only take a trade if all the rules of my strategy are satisfied.
Let me know in the comment section below if you have any questions.
Keep your long term vision.

Microsoft - Triangle BreakoutHello Traders, welcome to today's analysis of Microsoft.
--------
Explanation of my video analysis:
All the way back in 2014 Microsoft stock perfectly broke above a major resistance area at the $35 level and entered a +1.000% bullmarket. Over the past three years Microsoft has been trading within an ascending triangle and recently broke out towards the upside. If we see a retest of the breakout level mentioned in the analysis, I am looking for bullish trading setups.
--------
I will only take a trade if all the rules of my strategy are satisfied.
Let me know in the comment section below if you have any questions.
Keep your long term vision.

Microsoft showing downside with Inv Cup and Handle target $262.6Inv Cup and Handle formed on Microsoft.
The price broke below and this is where aggressive traders take advantage.
21>7
RSI<50
Target 262.66
Despite the positive sentiment with interest rates put on hold. There are signs that they will increase again this year. So we will need to prepare for the potential crash.

Altman + Microsoft: Will AI Wizardry Catapult Stocks ?Microsoft's trajectory into the future takes a compelling turn with the addition of Sam Altman, an AI luminary, to its internal team. This analysis explores the fusion of technology and finance, specifically delving into Altman's impact on AI development within Microsoft. We examine the integration of advanced AI features into Microsoft 365 and assess Microsoft's competitive position in the dynamic AI market.
On the financial front, Microsoft's robust fundamental rating sets the stage for closer scrutiny, emphasizing its stability and profitability. Altman's potential influence on Microsoft's stock value, given his renowned AI contributions, is a key focus, highlighting the pivotal role of innovation in sustaining and enhancing stock performance.
This concise analysis aims to unravel the symbiotic relationship between technological prowess and financial resilience, providing insights into Microsoft's post-Altman journey. As we navigate challenges and opportunities, the conclusion offers a holistic perspective on Microsoft's potential to lead in AI technology and maintain a competitive edge globally.
Technology Analysis:
Impact of Sam Altman Joining the Microsoft AI Team:
With Sam Altman's experience in AI development through OpenAI, his presence in Microsoft's internal team can positively influence the advancement of more sophisticated AI technology. The potential integration of Altman's ideas and strategies can strengthen innovation within Microsoft applications.
AI Technology in Microsoft 365 Applications:
Recent changes in Microsoft 365, such as the addition of Copilot features, demonstrate Microsoft's commitment to integrating artificial intelligence into its products. This can enhance user appeal and expand the user base of Microsoft applications.
Competitors and Position in the AI Market:
In the intense competition in the artificial intelligence sector with companies like Amazon, Google, and Facebook, Microsoft's strategic move with Sam Altman joining can help maintain and enhance its position in the AI market.
Financial Analysis:
Fundamental Rating of MSFT:
With a fundamental rating of 7 out of 10, Microsoft is considered highly profitable with no liquidity or solvency issues. A good dividend rating and consistent profits over the last 5 years indicate financial stability.
Impact of Sam Altman's Presence on MSFT Stock:
In addition to his contributions to technology development, Sam Altman's presence can also act as a positive catalyst for Microsoft's stock. Altman's reputation in the AI field and his connection with Microsoft can build investor confidence.
Innovation as the Key to Stock Value Increase:
In the face of tough competition, continuous innovation in AI technology is crucial to maintaining and increasing stock value. Altman's joining provides an additional potential for innovation that can influence the performance of MSFT stock.
Combined Analysis:
Synergy of Technology and Finance:
The combination of superior technology and stable financial conditions strengthens Microsoft's position in facing the future. Technological innovation is key to reinforcing the company's value, and, therefore, the potential for stock increase.
Challenges and Opportunities:
Despite Microsoft's solid fundamentals, challenges in AI competition persist. Hence, the company needs to stay focused on innovation and adapt to market developments.
With Sam Altman's support, Microsoft has the opportunity to continue leading in AI technology development. This enhancement can play a crucial role in the growth of MSFT stock value; however, long-term success also depends on the company's ability to stay competitive in the dynamic and competitive market.

Microsoft- MSFT analysisHi, I think there will be a more correction in Microsoft.
Wait for a more detailed setup.
To notify analysis and the free signals: Boost and follow, Comment for more.
Observe the money management (Use 1~3 % of your balance for each signal) and the stop loss.
Comment what the next stock should be.

Microsoft Desc. Triangle ready to pop to $239.96Descending Triangle is forming on Microsoft.
Can we talk about the gaps and liquidity issues? Is it because of the broker TradingView is showing for the company?
It's shocking and one I avoid trading by all means.
Anyway, the bearish signs are there
21>7>200
RSI<50
Bearish bias
Target $239.96
ABOUT
Microsoft is a multinational technology company based in Redmond, Washington that was founded in 1975 by Bill Gates and Paul Allen.
The company's most famous product is the Microsoft Windows operating system, which is used by over a billion people worldwide.
Microsoft also develops and produces a wide range of other software products, including the Microsoft Office suite, the Edge web browser, and the Xbox gaming console.
It's value is over $2 trillion in market cap
And of course the company is a major player in the field of artificial intelligence (AI) and is working on a number of innovative projects, including chatbots, speech recognition, and machine learning.

Microsoft - It's That SimpleHello Traders, welcome to today's analysis of Microsoft.
--------
Explanation of my video analysis:
In 2019 Microsoft stock started creating a major bullish trendline which was tested again in 2020 and also the beginning of 2023. Furthermore Microsoft also broke out of a massive ascending triangle formation and is now just looking extremely bullish. If Microsoft retest the previous breakout area mentioned in the analysis, we will be looking for long continuation setups.
--------
I will only take a trade if all the rules of my strategy are satisfied.
Let me know in the comment section below if you have any questions.
Keep your long term vision.

Microsoft (MSFT) -> Retesting The All Time HighMy name is Philip, I am a German swing-trader with 4+ years of trading experience and I only trade stocks , crypto , options and indices 🖥️
I only focus on the higher timeframes because this allows me to massively capitalize on the major market swings and cycles without getting caught up in the short term noise.
This is how you build real long term wealth!
In today's anaylsis I want to take a look at the bigger picture on Microsoft.
Looking at the higher timeframe you can see that Microsoft stock is once again retesting the previous all time high at the $340 resistance level.
Furthermore Microsoft is also creating an ascending triangle formation so I would love to see another bearish rejection and then the longer term bullish breakout.
- - - - - - - - - - - - - - - - - - - -
I know that this is a quite simple trading approach but over the past 4 years I've realized that simplicity and consistency are much more important than any trading strategy.
Keep the long term vision🫡

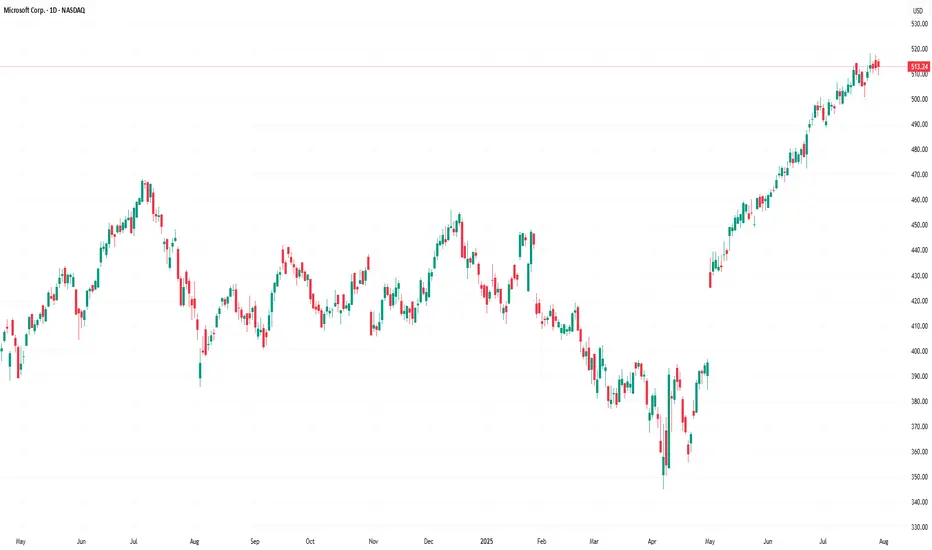
Microsoft Soars to Record High Following Strong Earnings ReportMicrosoft Stock (MSFT) Soars to Record High Following Strong Earnings Report
As the chart illustrates, Microsoft (MSFT) shares surged sharply after the close of the regular trading session – an immediate market reaction to the company’s strong quarterly results.
According to available data, MSFT's post-market price jumped to $555 per share, exceeding its previous all-time high by more than 8%.
Why Did MSFT Share Price Rise?
The quarterly report provided several reasons for optimism, including:
→ Earnings per share (EPS) came in at $3.65, beating analysts’ expectations of $3.37 by over 8%. Revenue also exceeded forecasts, totalling $76.4 billion versus the projected $73.9 billion.
→ Microsoft’s cloud revenue rose by 27% to $46.7 billion, while Azure’s annualised revenue exceeded $75 billion, driven by growing demand for AI-related services.
In response to these results, Barclays analysts quickly raised their price target for Microsoft shares from $550 to $625.
Technical Analysis of MSFT Chart
It is worth noting that the previous quarterly report was also strong, resulting in the formation of a large bullish gap on 1 May, followed by a sustained upward trend (highlighted by the purple trendline S). Importantly, the gap in the $395–425 range remains unfilled.
Yesterday’s report is also likely to result in a large bullish gap at the market open today, though this time, the market context could lead to a different scenario.
The key factor here is the long-term ascending channel (shown in blue), which reflects MSFT’s price movements throughout 2024–2025. After the previous strong report, the share price moved from the median to the upper boundary of the channel without setting a new record high. However, following the most recent report, the price has surged deep into overbought territory, potentially setting a multi-month high on the RSI and achieving a significant breakout to a new record.
As a result, once the initial excitement around the earnings subsides – and the desire of investors to close long positions intensifies – MSFT could undergo a correction from the upper boundary of the channel. In this scenario, the following support levels could come into play:
→ The psychological level of $550 in the short term;
→ The S trendline, as a possible support during a deeper correction.
This article represents the opinion of the Companies operating under the FXOpen brand only. It is not to be construed as an offer, solicitation, or recommendation with respect to products and services provided by the Companies operating under the FXOpen brand, nor is it to be considered financial advice.