Search in ideas for "Trxusd"
TRXUSDT TRXUSDT Price Action Analysis (1H Timeframe)
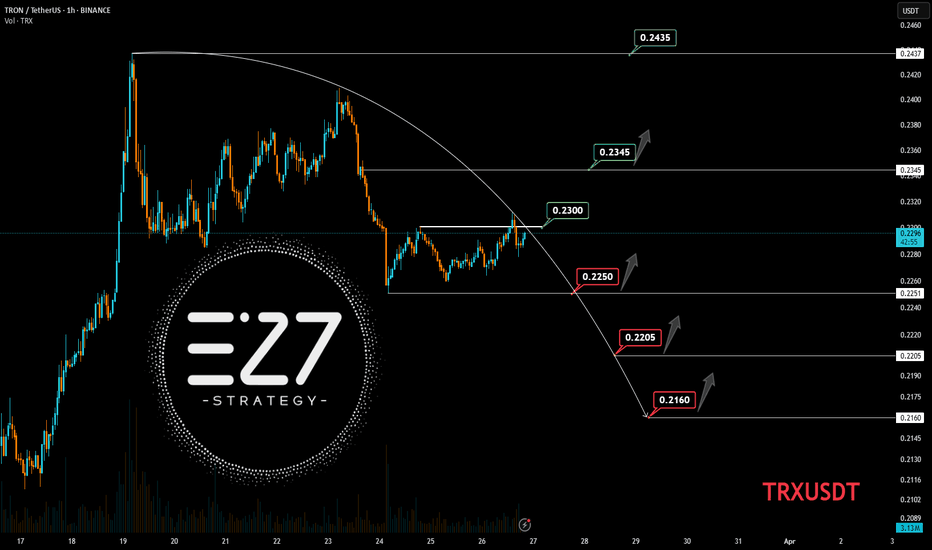
🔹 Overall Trend: After a strong rally, the price is in a correction phase, currently trading at 0.2291. The key resistance at 0.2300 must be broken for a bullish continuation.
🔹 Bullish Scenario:
A breakout above 0.2300 with confirmation could push the price towards 0.2345 and 0.2435.
If this happens, the bearish structure will be invalidated, increasing bullish momentum.
🔹 Bearish Scenario:
Failure to break 0.2300 may lead to a pullback towards 0.2250 and 0.2205.
Losing 0.2205 could open the way for a deeper drop to 0.2160, a critical support zone.
🎯 Conclusion: Watch key levels closely; a confirmed breakout above 0.2300 signals a buy opportunity, while losing 0.2250 strengthens the bearish outlook.
TRXUSDT DTRXUSDT 1H appears to be inside a triangle right now. We may be close to breaking the triangle. Because he is holding below the median of the Keltner channel, there may be a greater chance of him breaking up, quickly hitting the target.
Remembering that we should see this breakout over the next few hours. We need liquidity to really get out of this accumulation. This means that the ideal plan will be for him to break up tomorrow.


