trxusd berish idea trxusd looking berish short it huge risk rewar ratio
if you are unable to make good profitable chain in trading due to any reason i.e job or due to personal reasons.
if you have not good skills to understand the market behaviour to make consistently profit in trading account..... contact us for business in forex +92 345 765 3407 whatssapp
Search in ideas for "Trxusd"


TRXUSD Decline Towards 0.0245 Level in Mid SeptemberTRXUSD will try to break above 0.038 level but will eventually head south to 0.0245 by mid September


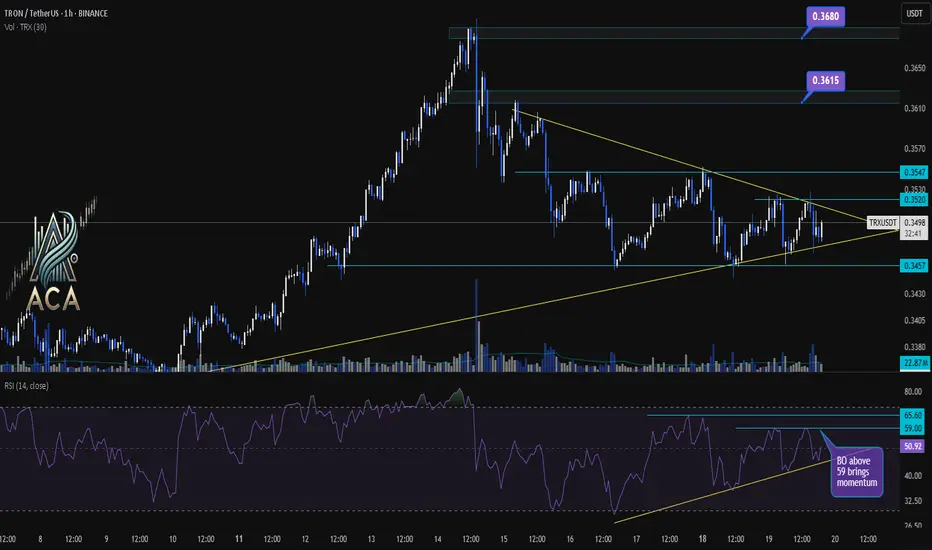
TRXUSDT 1H Chart Analysis | Eyeing the Breakout for MomentumTRXUSDT 1H Chart Analysis | Eyeing the Breakout for Momentum
🔍 Let’s break down TRX/USDT price action and identify setups that could unlock the next move, with a spotlight on RSI dynamics and key breakout levels.
⏳ 1-Hour Overview
The chart is currently forming a tightening symmetrical triangle, signaling a squeeze ahead of an expected breakout. Price action is consolidating between the local support at $0.3457 and resistance near $0.3520–$0.3547.
📈 RSI Insights
- The RSI sits around 48, reflecting short-term indecision and neutral momentum.
- There’s a clear RSI trendline forming higher lows, indicating underlying strength building up.
- Watch closely: An RSI breakout above 59 is flagged as a momentum trigger, historically driving stronger moves.
📊 Key Highlights:
- Chart pattern: Tightening triangle points to an imminent volatility expansion.
- Price structure: Breakout (BO) above $0.3520 or, more convincingly, $0.3547 opens up higher targets.
- Bullish targets: $0.3615 and $0.3680—these mark the next resistance zones if upside momentum takes over.
- RSI dynamics: Trendline support on RSI signals hidden demand; BO above 59 on RSI can fuel upside moves.
🚨 Conclusion:
TRX is at a make-or-break juncture. A decisive breakout above $0.3520 or, even better, $0.3547 could unlock a rally to $0.3615 and $0.3680. Keep a close eye on the RSI—trendline holds and a thrust above 59 can serve as early confirmation of buyer strength.
TRXUSDT Up trend continuationTRXUSDT has recently pulled back toward a key support level after reaching an all-time high. This support zone has previously acted as a pivot point, underscoring its significance. On the weekly timeframe, a large bullish candle suggests that a retracement to approximately one-third of the previous week's candle or the psychological level at 0.1900 would be a healthy correction. Following this pullback, the price may resume its bullish movement. The target is the resistance zone around 0.2070

TRXUSDT Bullish marketTRXUSDT is exhibiting a strong bullish trend, characterized by higher lows and higher highs. After reaching new all-time highs, the price is retracing and may pull back below the psychological level of 0.200. This correction could extend toward the lower channel border before resuming its upward movement, offering potential entry points for buyers aiming for the resistance zone around 0.2200

TRXUSDT potential Up Trend continuationTRXUSDT pulled back toward the swap zone, which has been tested multiple times before, and took liquidity below the equal lows, creating a false breakout at this significant level. Despite this, the overall trend remains bullish, and the market may enter a short-term sideways phase between 0.1570 and 0.1650. The presence of a recent bullish candle supports the potential for upward continuation. If the market holds above the swap zone and regains momentum, a move higher is likely. The target is the resistance zone around 0.1620

TRXUSDT CorrectionTRXUSDT is currently pulling back after forming a double top at a resistance zone. The price is now testing a previous support level, and there is a chance it could dip below this support, given the liquidity below this level and near the February highs. The market has already seen a pullback of around 12%, with the potential to extend to a 15% pullback. This price action might develop into a trend continuation pattern, possibly forming a triangle as it consolidates. If the market finds sufficient buying pressure at these lower levels, it could set the stage for a future upward move. The target is the resistance zone around 0.1618

TRXUSDT trend continuationTRXUSDT has pulled back following a recent surge. The market recently broke and closed above a flag pattern, with the price retracing about 38.2% of the previous bullish move. It has now reached a resistance zone last tested in 2021. Additionally, the price has pulled back to the previous higher high zone, from which it has already started to bounce. On the weekly timeframe, the market has broken through a large triangle pattern, suggesting a potential continuation of the trend. The target is the resistance zone around 0.1670
Dear traders, if you like this trading idea or you have an oppinion on it, we would love to hear it in the comments :)

TRXUSDT Limit Long is about to TriggerTRXUSDT is clearly one of the strongest coins in the recent months. It has established a clear long-term uptrend, where the resistance has flipped into the support.
We have placed a limit order to go long on the Tron, and we expect quite a strong uptrend to start this week.

TRXUSDT SHORT OPPORTUNITYTRXUSDT is in an uptrend and after reacting to a strong fresh OB, firstly broke the OB then got back beneath it and made a ChoCh, then I personally set my short setup, and I will enter in lower time frame in 15M and 5M, based on my checklist confirmation and risk and money management!
But as you know the analyzing timeframe is 4H and the triggering orders might take time, hence as you might know tomorrow there will be data, MCSI (Michigan consumer sentiment index) which is very important for dollar. So be careful at that time, DYOR and be profitable!
Ciao!

TRXUSDT(TRON) Daily tf Range Updated till 03-06-23TRXUSDT(TRON) Daily timeframe range. we all know what alt this is. #0.07816 is a solid level we can see last several times fakeout and failed here, so gotta be careful here and potential of setup here too. clearing here can lead the price to jump in above zone.

TRXUSDT → Consolidation. Breaking through Strong Resistance TRXUSDT breaks the downward resistance, which has been holding the price back for more than a year. As we can see, the price forms a local uptrend and on the next retest the coin forms a breakout. What's next?
The energy for the breakout has been accumulating since the end of last year. The last month and a half the price sticks to the resistance and forms pressure from below. (Triangle area).
While many altcoins have been confidently updating highs TRX has been practicing stamina and accumulating.
It remains for the bulls to hold the 0.0650 level defense behind them.
Strong support: 0.065, 0.0600.
Strong resistance: 0.0700 (breakdown strategy)
I expect from the bulls a confident consolidation of the price above the broken line with the subsequent growth towards 0.0800, then to 0.1000
Regards R. Linda!

trxusdt (Tron) in 15M TimeFrametrxusdt (Tron) in 15M TimeFrame | As you can see, the flag pattern in this coin is quite clear, in my opinion, at this moment, the market maker is collecting coins and it will experience growth and growth again, just like the flag pole, this is a personal opinion and only for Your review will be shared

TRXUSDT - Good opportunity
TRXUSDT :
It seems that the price will move up from this area.
Of course
After crossing 0.65157
You can place a stop-buy and place a stop loss below the red downtrend.
Or wait for the confirmation.

TRXUSDT- 1W SETUPTRXUSDT price held the long-term support for one Month and closed above EMA 21. Bulls looked in accumulation mode as they did well by holding the nerves and did not panic sell. So it is giving a good feeling about upcoming sessions that if a breakout happened we could see a massive rally upward. So keep accumulating at these levels.

TRXUSDT 2 master targets .TRXUSDT 2 master targets .
This is a high probability that may happening for theron may be trending.
against pessimistic ideas.

TRXUSDT SETUPTRXUSDT current drop reached at support zone where fib level 61.8% and trendline support also lies 0.11300. Now we can target 0.12 level followed by 0.122.


TRXUSDT inside 4hr after inside day TRXUSDT has broken the inside day to the upside,showing great relative strength among its peers.
Here we got this inside 4hr trade
I'll be willing to take some breakout long
Let's see how it goes yo!

