Search in ideas for "bch"


BCHBCH/USD - Coinbase
Still Holding!!
Just thought I would post an update on the hourly chart. I still think the resistance and support channel from the long term chart hold and that they will make some key resistance lines that we need to break through. We have also added a short term support line in green that BCH has begun forming and a short term inverted head and shoulders pattern. BCH has been really nice for swing trades but we have been stuck since our last 2300 entry. I'll be reevaluating holding BCH or making a similar trade as what we did with TRX ETH whenever we hit one of the resistance lines on the long term chart and how the coin behaves at those resistance lines.
I think its always very important to be flexible with your trades and resolute with your investments. What this means is that when you are making the type of trades we have been making; where we are only in the trade for a few weeks max, you need to have price targets but you need to re-evaluate those price targets every time the investment hits resistance. You need to be exceptionally vigilant with your short term trades or you should not be in them at all.
On the flip side, when you are investing in a company or a project you strongly believe in and have a long term horizon you need to be resolute with regards to volatility. You can't swing in and out depending on sentiment or FUD/Euphoria news and price action. This is what has led to my 100%-600% gainers like TSLA, CAT, and especially AMD. I purchased AMD at $2 when everybody was FUD'ing all over that beast and had no understanding about the companies fundamentals, product line, or companies using AMD in their devices.
When you trade, be flexible. When you're investing in something you've done your homework on and believe in, be a stubborn bastard.

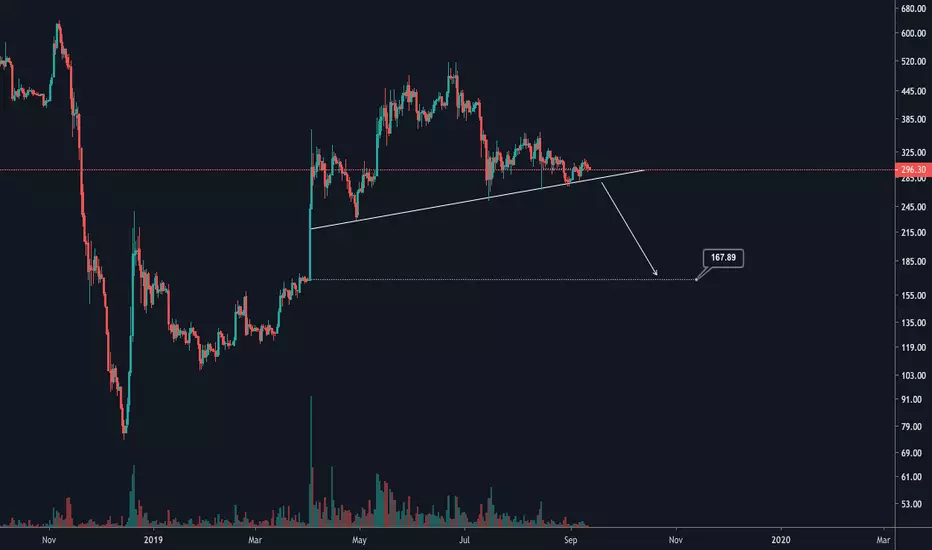
BCH BCH is forming a head and shoulders pattern, which is currently being confirmed by volume, as the volume is decreasing steadily at all 3 peaks.
If the bears sink the price below the neckline, that will be a very bad signal. Once the head and shoulders pattern is successful, the next price could be at $167.
On the other hand, to be able to enter the uptrend, BCH needs to rise above the $350 level.
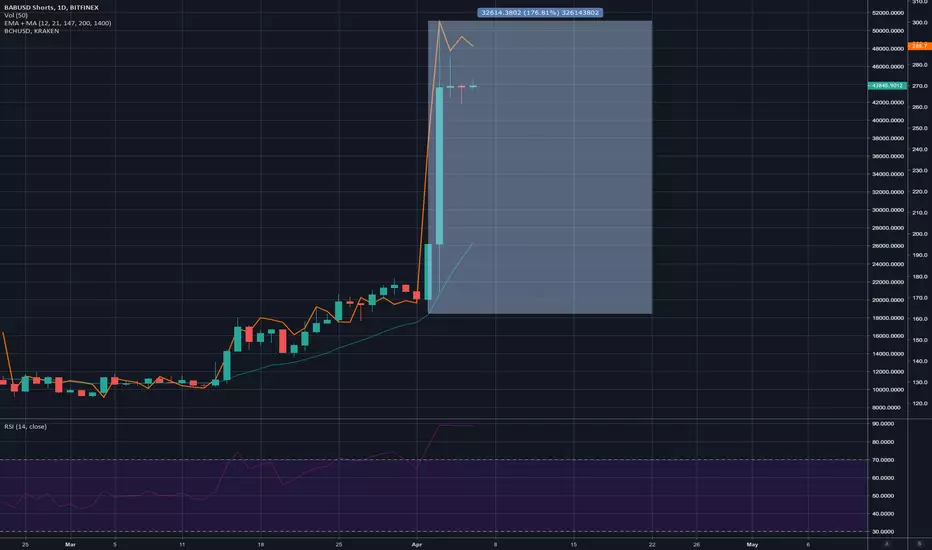
Bch@bch
I still don't have the confirmation of the break, the last candle was 326, so I don't think it can go higher than this, if it is approved, you can see the above three lines after a few weeks, if you are thinking about buying it, when you see it Two green numbers arrived, check the power of the candle and momentum, if it is OK, buy it


B


BCHBCH looking to break out of downward trend and falling wedge. Seen some erratic buy volume on the 1 hour chart. If BTC makes a bullish move it should bring alts up with it
BLong


BCH Technical Analysis and trade journal. Week of 4/8/19BCH in Depth Technical Analysis and trade journal. Week of 4/8/19
Trader Noxtreme back, going in depth on more coins for you all. I am finding a journal approach helpful for my published ideas so if you are finding it helpful also or if you want to join in PLEASE LIKE, SUBSCRIBE AND COMMENT. We are here to learn and grow as traders so do a good thing and share your strategies and ideas with us.
So let’s jump into it.
BCH weekly RSI is at 50. This is lower than LTC (68) and BTC (57) so, surprisingly, BCH has more room to run. This being said, BCH had one of the largest moves of the top 5 market cap crypto. BCH 108%, LTC 65%, BTC 32%, ETH 29%. These are interesting numbers in themselves but they indicate BCH and LTC ran the hardest, and they have the biggest loss potential if the entire space declines or consolidates. RSI being the lowest on BCH says that it did not take as buying pressure to move this price and I assume it would not take as much selling pressure to drop it either.
I want to quickly touch on the green boxes on my chart. The big green box we are currently in is a price gap from the BCH/BSV contentious hard fork. Gaps tend to fill quickly in stocks so I have been watching this area for a potential gap fill and then a gap fill reversal. I am not all that experienced with these types of situations but I have been studying them.
The second smaller green box is where I see our extreme pullback potential. This area has seen a lot of price actions so if we get a bear volume spike there is a chance we could come all the way back between 168.64 and 153 which is tough to even consider when looking at shorter term time frames and a current price of 309.
Lastly we have the 50 week MA coming down to greet us; potentially at the top of our price gap.
Take always: BCH is a wild one. It is thinly traded and your risk reward is going to be greater. We are in somewhat uncharted territory price wise but RSI shows room to run on the weekly and we have less resistance then support at the current price level on most exchanges.
On the BCH daily I am again seeing more bullish signs then bearish. First one being 12MA is about to cross the 200MA and the price hit the 200, briefly consolidated, then pushed right through, creating a little support there (white line). Bears are looking at the RSI of 79 and how easily this one moves but if I were able to short I would be looking for the gap fill reversal over a short here. We also have a big, (somewhat) symmetrical triangle bull flag. Again I think I would not be thinking of shorting BCH here if I was a bear. Volume is declining while price is consolidating up. MacD shows bull needing to slow down.
I am left with these conclusions: BCH is a bit of a wild card and it tends to not do what you expect (from my past experience). I am expecting a test of the top of the gap then a reversal, but again, this one tends to not do what I expect so I’m going to watch for the contrary pull back to the 200MA and then another spike up past the top of the gap and then the gap becomes support. Perhaps even a pull back to the lower green box. Sorry this is more of a gut reaction to what I’ve experienced with this coin but looking for these lower entries will provide better risk to reward. I like to say BCH is a stallion in a world of bulls and bears so I'm going to try and lasso this one from a distance.
Jumping into the 4hr we see our symmetrical triangle bull flag in all its glory. It looks like we are trying to hold support on the 26MA. The ranges between support and resistance lines are big. 17+ % from our current 294 support to the 200 ma cross support we see on my daily. 42% + to get down to our smaller green box and there are only (about 9) supports in that range.
RSI is 56 but BCH does not seem to like being less than 43 RSI on the 4hr since the end of January 19. We see the same swing characteristic here though; when it breaks it really breaks.
Finally our hourly for all the traders out there. Not much to say here that I have not already said for the longer term time frames other then we don’t really have a consistent RSI to play off for entries (look for 43 on the 4 hr). I’m seeing a lot more wicks on the tops of our highs then off the bottoms of our lows which leans a little bearish. 12 and 50 MA just crossed the 50 bearish. MacD isn’t sure what it wants. We are running out of space in our flag so this one could give us a sneak peak of what the rest of the pack might do.
This is my story and I’m sticking to it. Good luck and be cautious with this one. Stops are needed but VERY difficult to use because it swings so far.
PLEASE LIKE SUBSCRIBE AND COMMENT if this helps you out or you have something you see that I missed.

BCH (bcash) Resist @ $500, $640, $1300, $1650, $2950, ATHBCH Resist @ $500, $640, $1300, $1650, $2950, ATH
BitcoinCash has been suppressed underneath a two year descending trendline. A major crash in late 2018 drove BCH to super lows ($74) where it has established a new long term ascending trendline, BCH has been bull for 14 months now. It became even more bullish 7.Jan.2020 when it broke above the two year descending trendline (Circled).
What next.
If it goes up, here are an array of notable support and resistance points. These are good for identifying potential entry and exit points. Because we are well into the heat of the 2020 bull crypto market, its likely its going to go up along side the other crypto.
A wedge? Maybe the bull market takes a breather and BCH is forced to consolidate. It has room to consolidate in a massive wedge over the next year with lows in the low to mid $200's and an absolute high of $500 which is about today's price. While this would be healthy to take a slower pace like this, its more likely the bull market will help BCH run higher sooner. Also the wedge could convert to an ascending channel.
Playing the major support line: We are on a 14 month ascending support trendline now. Any touch of that support line should be seen as the best possible entry barring breaking support. (If we every touch it again)
------------
A note about BitcoinCash: I do not invest in many projects but I will trade anything. I personally do not like BCH. Bitcoin (BTC) is great code that has been forked(copied) hundreds or thousands of times. People fork it, make their own changes, brand it, pump out the first (genesis) block with or without pre-mining and their project is up and going in days or weeks instead of years. I thinking forking great code like BTC makes sense. What doesn't make sense is to fork the code and the ledger and the name. What happens when you decide to deploy a contentious hot fork like BCH.
You generate billions in marketcap literally overnight and based 100% on the reputation of the project of whose code & ledger you took.
Then you proceed to create an identity crisis for the leading crypto currency causing confusion among those new to crypto, susceptible to buying the "cheaper bitcoin".
Then you make an effort to use the developers own code with hardly any changes to it to try to overthrow the original developers in a coup.
It smells of greed and lack of integrity IMO. Furthermore in this case it was a protest to the lightning network (LN) of which if it were not for the LN, bitcoin transactions would still be taking 10-30 minutes instead of processing at point of sale speeds. Furthermore either the original developers don't understand the importance of the OSI and similar models that rely on layers to provide services or they were in on the money grab as well. I think legitimately a lot of the devs and BCH supporters are not doing this to be malicious. That said, this is why i feel that BCH and all the contentious hot forks are toxic to the crypto community. (though I will still trade them)
This isnt investment advice, its some of my observations while researching. You should always Do You Own Research!
Also consider using our site with TV charts as part of your short to mid-term trading strategy with real time and historical market depth of global crypto markets along with sector indices, an array of optional columns, orderflow coming soon and so much more > vcdepth.io
Here is BCH with 1% depth of market with MACD confirmation on a spike in bids just before the jump.

BCH long position 1000%BCH strongly undervalued coin, capitalization of BCH is huge, BCH use the same way like BTC you can buy a cup of coffee, foods, cars, whatever you want for BCH.
Also, the GRAYSCALE portfolio consists of BCH for 0.5 B USD.
And the cherry of the cake, the capitalization of BCH started grow from 10 B USD to 26B USD for several weeks ago.
All TPs on the chart!
Happy trading guys!

BCH ANALYSIS: CURRENT ACCUMULATION PHASE IN PLAY!BCH ANALYSIS:
BCH is ranging strong inside the zone of 200 to 230, and currently making its way back UP. The current long is entry at 217, scalp UP to T1 at 224.65. This is followed by a sell, and a short back down to T2 at 207.00. These are two short term scalp plays in progress for people who want to short term scalp. BCH hourly resistance will overextend buyers into overbought. The leg up will also give sellers a chance to step in at the top of resistance. I dont believe volume is strong enough to push BCH out of this accumulation phase YET. With that said, any break below support is bearish and will push BCH down to 175. Keep S/L tight in both directions!

BCH/USDT will probably go out of the banner shock!BCH/USDT will probably go out of the banner shock!
🚀📈 Exciting News! 📉🚀
📉 BCH/USDT has recently experienced 5 consecutive days of slight decline, indicating the release of short selling momentum.
But wait, there's more! 📈 The positive trend is pulling up, showing signs of a potential upward surge! 💹
💪 With the closest support around 225.04 (June 29, 2023 opening price), the outlook is promising for potential rebounds! 📊
🚩 Get ready for a flag-shaped oscillation pattern ahead, offering opportunities for both short-term traders and long-term investors! 📈🚩
🌟 Don't miss out on this golden opportunity!
Stay tuned for potential profits as BCH/USDT prepares for exciting price movements!
#BCH #USDT #ForexTrading

BCH SV Daily Analysis: The Climb to All Time HighBCH SV has fallen to exactly the level that Nouvive and Nouvive Intelligence wants it to $89. From there, it will be a slow, yet uphill battle to the All Time High of $141.
What do the charts Say?
Bullish
BCH SV is currently in a bullish triangle pennant, this means that when it breaks out from $100, it will fill the gap at $110 before deciding to climb to fill the last gap at $120.
BCH SV on the higher time frames has filled a double bottom, the market disagrees it will go below the level fo $89.
Volume is decreasing, meaning a volatile move will occur.
RSI Stochastic has crossed-over at current levels; this coupled with the rising Accumulation indicates that it will rise to the top of the pennant at $100.
Nouvive Intelligence points out that market sentiment is rising to previous highs and this is currently not a crowded trade.
Both bottoms occurred on the 0.5 Fibonacci, a move to fill the volume gap and to the tip of the triangle pennant is at the 0.618 fibonacci.
Bearish
It is unlikely but BCH SV may fall to fill the volume gaps at $87 and $77 where the 0.382 fibonacci is currently at.
If that happens, it will past the previous local low of $85, meaning above down to the 0.236 fibonacci is likely and closer to the previous support at $55.71
Nouvive Says:
Traders: An entry at $90 to the tip of the triangle and below the 0.618 fib is an 11% move and based on market sentiment may occur within the next 10 days.
Investors: An entry at $88 and a stop loss at $85 with a take profit at $120 will occur based on Market sentiment by the end of the year for a 30% gain.
BLong
