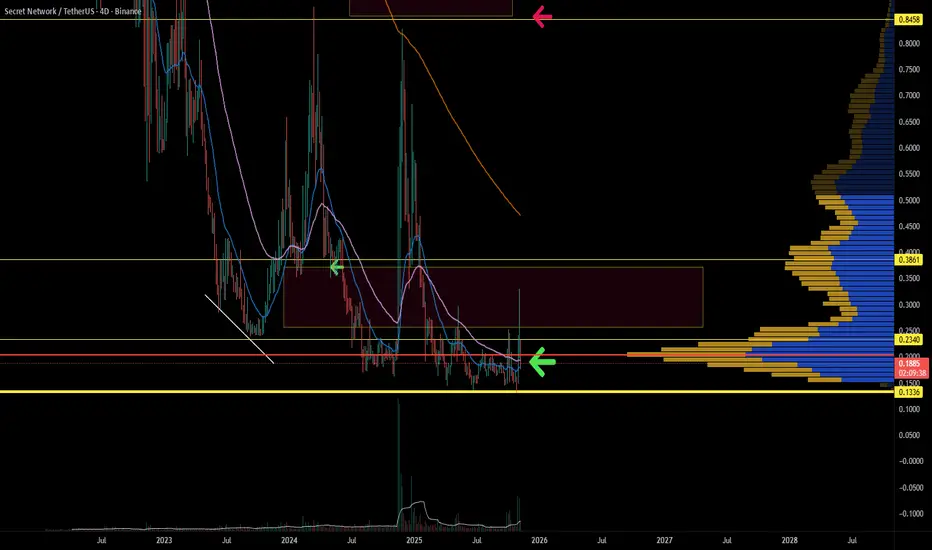
SCRT/USDT 3D — Falling Wedge Signals Potential Trend ReversalOn the 3D timeframe, SCRT/USDT is still moving within a medium-to-long-term downtrend after topping near the 0.82 USDT area. Current price action is trading near historical low levels, which often act as important technical reaction zones.
Volatility is gradually decreasing, indicating a compression phase that usually precedes a significant directional move.
---
Pattern Explanation
Price action is forming a Falling Wedge (Descending Wedge) pattern:
Series of lower highs and lower lows
The upper resistance line declines more steeply than the lower support line
This pattern is commonly recognized as a bullish reversal structure when a valid upside breakout occurs
However, as long as price remains inside the wedge, the prevailing bearish structure is still intact.
---
Key Levels
Resistance Zones:
0.157 – 0.165 USDT → dynamic wedge resistance
0.200 – 0.226 USDT → strong horizontal resistance
0.383 USDT → major resistance / previous distribution area
0.550 – 0.740 USDT → extended targets if a strong trend reversal unfolds
Support Zones:
0.105 – 0.096 USDT → major support & demand zone
A breakdown below 0.096 USDT would open further downside risk
---
Bullish Scenario
The bullish scenario becomes valid if:
1. Price breaks and closes above the upper wedge on the 3D timeframe
2. Breakout is confirmed by increasing volume
3. Price successfully holds above 0.157 – 0.165 USDT
Upside Targets:
Target 1: 0.200 – 0.226 USDT
Target 2: 0.383 USDT
Extended target (strong reversal): 0.55 – 0.74 USDT
This structure supports a medium-term trend reversal if the breakout is confirmed.
---
Bearish Scenario
The bearish scenario remains dominant if:
1. Price fails to break the upper wedge
2. Price breaks down below the 0.096 USDT support
3. A 3D candle closes below the major demand zone
Consequences:
Continuation of the downtrend
Potential move toward lower liquidity zones
Falling wedge fails as a reversal pattern
---
Conclusion
SCRT/USDT is currently at a critical decision zone. The Falling Wedge offers a potential bullish reversal, but confirmation is essential. The safest approach is to wait for a confirmed 3D candle close rather than anticipating the breakout prematurely.
A major move is approaching, and direction will be determined by price reaction at the upper wedge.
#SCRT #SCRTUSDT #CryptoAnalysis
#FallingWedge #Downtrend #PotentialReversal
#AltcoinAnalysis #SupportResistance #PriceAction #MarketStructure
Secret

Secret looking for bullish bids. SCRT has reached a level where buying and selling pressure has paused — effectively establishing a floor price. With the growing strength of the privacy narrative, market participation could soon pick up, reflected by increasing volume.
Higher timeframes are showing a positive shift in momentum at levels offering a healthy risk-to-reward ratio, signaling early bullish divergence. In such conditions, dollar-cost averaging (DCA) remains a sound accumulation strategy.
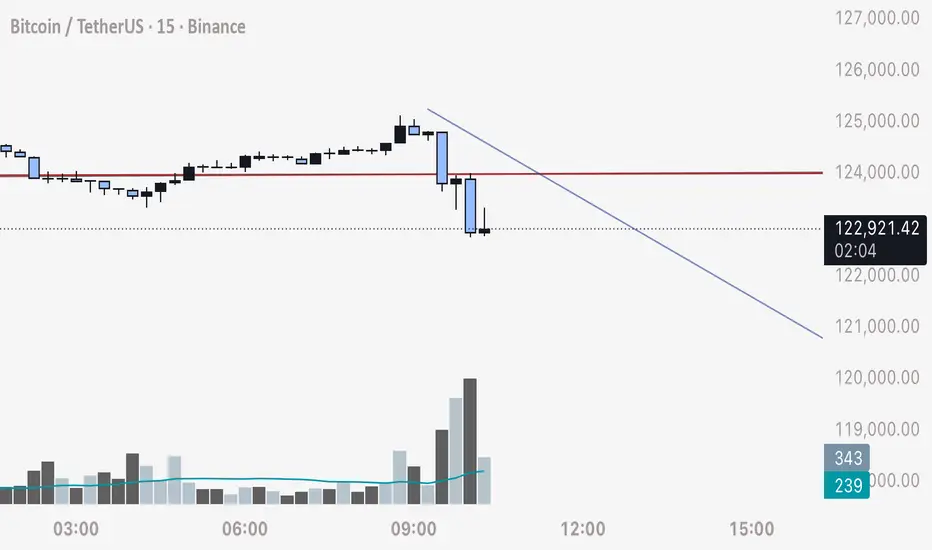
Result - Using Order Blocks to Predict Bitcoins MovementHere is the result from our first practical demonstration of the effectiveness of using order blocks (stop loss orders) and liquidity analysis to predict price movement on BTC.
Both the upwards movement and downward moment was able to be predicted with absolute accuracy.
I hope this result serves as proof for my thesis:
What moves Bitcoin is Stop Loss and Liquidation orders, which can be analyzed by looking back at open candles and length of consolidation to predict speed.
And
There is no market manipulation other than price being CONTROLLED to attract positions to be opened and consequently stop loss orders. Fast, sudden movements are a natural phenomenon caused by traders stop losses triggering into one another. Traders manipulate themselves.
I have applied this to two more examples on the higher time frames. And as those complete they will be reviewed.
PLEASE SEE ORIGINAL IDEA LINKED BELOW AS WELL AS OTHER PLANS AND IDEAS RELATED.
Any questions please comment below.
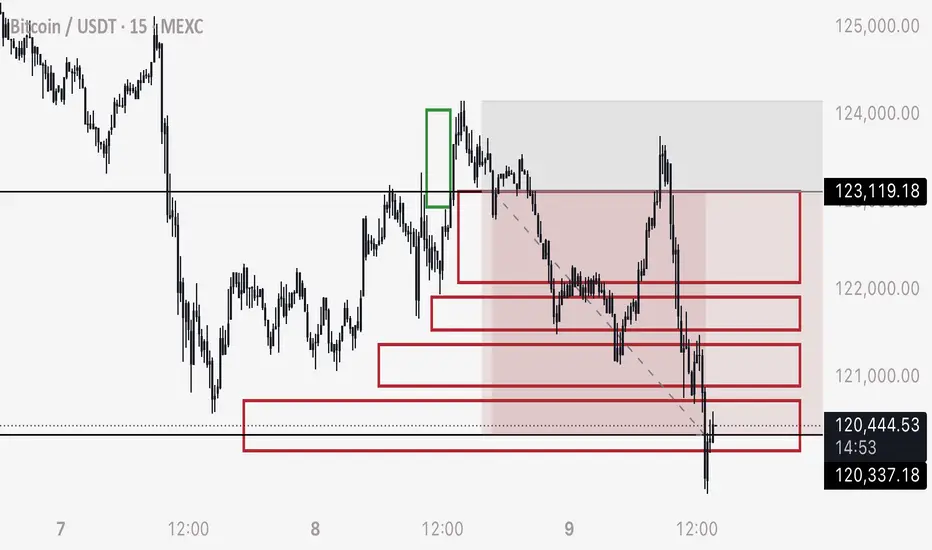
BTC - Practical Example of Trading Order Blocks / Stop HuntsHere is a very practical, recent example of trading the reaction of BTC hitting stop loss order blocks and how price moves.
Green Boxes:
- Note that price moves in a slow, downwards consolidation
- This slow drop allowed time for traders to enter shorts, consequently leaving stop loss orders for the entire position size
- The price movement when these cascading blocks of orders are triggered always moves exponentially faster than the consolidation. Slower the move in a direction = faster the wick in the opposite direction. More orders ( buys or sells ) equals greater speed and distance.
- These orders being triggered (stop losses and liquidations) trump any pattern, support or resistance. It all becomes irrelevant as the order chains will always execute and set off, ignoring any technical pattern.
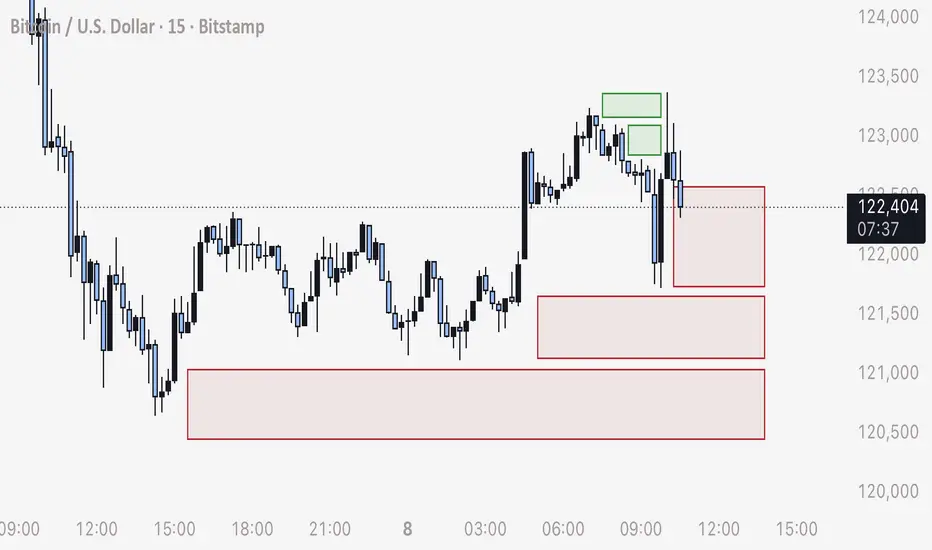
Predicting this Wick to 123,300:
- Notice the downwards consolidation followed by a faster drop in the end.
- Price quickly moved higher
- From this point we can anticipate that the high leverage stop loss orders for shorts will be triggered, at this point you can scalp a long, take profit slightly above where the consolidation started.
Red Boxes:
- The red boxes are sell orders created from long positions being opened and consequently their stop loss and liquidation orders
- Mark and extend boxes from the open zones that price has not reclaimed
- When price moves down low enough, to start filling these sell orders, you may short to slightly below the beginning of the upwards consolidation
- I’d anticipate when price moves below 122,200, that’s when the wick will form and land at a minimum of 120,100 (if not setting off more sell orders as we look at higher time frames than the 15 M)
- Looking at the slowness and time allowed for the upwards consolidation, we can anticipate a larger amount of longs have been opened, and this can be translated to an increased speed of a wick down and faster movement.
In Summary:
I hope this serves you as a good, practical example of the method of trading stop losses hunts and order blocks, which in my experience is the only reliable way to predict the price of Bitcoin.
Yours truly,
- DD
BTC - How Manipulation Works and How to Detect It I subscribe to premium solely for the multi second time frames, time frames that you may think are useless.
What if I told you this is the ONLY true way to detect manipulation?
HOW MANIPULATION WORKS
It’s a lot more subtle than you think.
The main driver of what moves the price of Bitcoin is the adverse orders from derivatives and leveraged positions. These orders being stop loss orders and liquidation orders.
In essence, it’s traders own decisions and orders, that cause price to move in an opposite direction.
You may have heard people say “Do the Opposite” or “Contrarian Trader”. What they mean is, the market seems to move in the opposite direction as the majority sentiment. Even the fear and greed index is used to convey this principal.
However there’s a true and technical way of understanding this.
As bitcoins price moves and consolidates SLOWLY and STEADILY in one direction, this extended period of time allows traders to enter leveraged positions in that same direction that’s moving price slowly up or slowly down.
Consequently, these trades are leaving opposite direction orders of a larger magnitude, such as stop loss orders for the “entire leveraged position size”. For example, Trader Bob uses $100 to inject liquidity into a long position, and opts to use 80x because of his confidence in Bitcoin moving up. Trader Bob then sets a stop loss order which “sells” his position and closes 100% of his leveraged position size. Trader Bob sets BELOW the current price a sell order for $8,000 - 80x his original $100 injected.
MANIPULATION comes in two distinct parts.
1) Price is held stable, to ACCUMULATE and ATTRACT more of the orders (long or short) - which the market makers and exchanges know is ACTUALLY creating more propellant and energy that will move price in the opposite way.
As an example, if Bitcoin is at 100,000 and the market makers and exchanges know there’s a mass amount of liquidity to reclaim at 80,000 - they will do a series of manipulations to get price to that level.
A) They will hold price steady while looking like Bitcoin is about to keep moving up. This attracts more longs with different leverage and stop loss orders creeping closer to 80,000
B) They will drop price slowly, and rise back quickly. The slow drop allows time for traders to work down the price scale those stop losses and liquidations, and the fast rise ensures they are left in tact and price won’t move low enough to trigger off the chain reaction.
SUMMARY OF 1)
Price is manipulation by being KEPT or STABLE from setting off the chain reaction of stop loss orders, which offering time to get traders to place more of these orders.
NOTE THAT Market Makers don’t place their own trades. They accommodate leveraging traders. That said, they do want their money back - so they want traders to place trades in the losing direction, while simultaneously having their own stop loss orders set a chain reaction that takes price to the level they want.
2) Price is PUSHED or FORCED into the chain reaction of stop loss orders and liquidation orders.
This is the manipulation that forces price, however we can understand the mechanics fully and understand the intentions.
Manipulators (hidden providers of liquidity) will place icebergs or many small orders, which generate large volume in small time intervals, and force bitcoin into the series of orders.
It is then the traders own adverse orders that automatically fulfill the price movement.
SUMMARY OF 2)
Price manipulation is initially forcing price into a series of stop loss orders and liquidation orders, and it’s possible to detect this.
USING THE 5 SECOND TIMEFRAME TO DETECT MANIPULATION
1) Add the basic VOLUME indicator to your chart
NOTE - Suggest using Binance BTC chart
2) Note the Volume moving average - which is shown as a Bitcoin Amount transacted each 5 second interval. This is commonly 0-2 BTC transacted per 5 second.
3) Observe each candle volume coming in. The time frame is small enough that you can see if it’s a buy or sell, very seldomly mixed buys / sells. This also serves as an alternative Order Book.
4) Watch for abnormally large volume transactions on the 5 second candles. It’s not out of the ordinary to spot a 5 second candle that contains 500 BTC bought or sold.
THIS is CERTAINLY the price manipulation that forces price into a sequence of stop loss orders.
5) Use that buy or sell manipulation volume candle as a que to understand the intention of where price is going to be forced.
THE WRAP UP
I hope to assist you all with understanding that the Bitcoin chart is very much INTENTIONAL and can be treated as a STRATEGIC BUSINESS due to the market cap being dominated by leveraging liquidity and few players who control it.
Love and luck to all,
- DD
BTC - Drawing your own Heatmaps and Understanding how BTC MovesAs of late I’ve been noticing more and more YouTube videos of analysts referencing coinglass heatmaps as a means of understanding where liquidity is.
Coinglass - if you read the details and disclaimer - is a prediction based algorithm and is not true or accurate data.
In fact, exchanges have no enforcement that encourages them to disclose data such as stop loss locations, leverage ratios, or liquidation zones.
To draw your own liquidity heat map, I demonstrate here how you can do that.
1) Determine the candle sets that move straight up or down - without price reclaiming that area.
2) Draw a box extending out from that section. Respectively these will be buy orders or sell orders.
3) Unlike limit orders for buys and sells, stop losses are extremely important - as they are limit orders that don’t automatically fill if price is at a premium or discount. They only fill if price crosses the exact price, setting off the order.
4) Use your liquidation boxes to determine where these hidden limit orders are in the chart. As we see currently, there is a mass of leveraged sell limit orders (long stop losses) stacked with little to no gaps in between them.
From here, we can understand how Bitcoin moves.
1) The majority of the market cap is leveraging liquidity. Liquidity used by traders leveraging their longs or shorts.
2) These orders leave above (or below) stop loss orders or liquidation prices, that act in the opposite way of traders direction. For example if a trader longs with $100 using 100x, he is leaving underneath his entry a sell order for the entire position size, or $10,000.
3) These stop loss orders trigger a natural chain reaction that fill, one into the next, causing the price to move fluidly as it triggers off the order block areas.
Since Bitcoin has been moving steadily up, sideways, up, sideways - for such a long period, we can deduce that there is a massive chain reaction of sell orders which will allow the price to drop aggressively and fluidly, without any active sell orders being placed by traders.
Traders looking at coinglass or other similar platforms, and stating there is a mass of short liquidity in the chart - are entirely wrong. Zooming out, we can see an overwhelming offset to the long positions left intact in the chart.
The bottom of the price drop will be the end of these stop loss orders. From there, price will leave a quick and quickly start returning to the higher levels.
Hope you found this helpful.
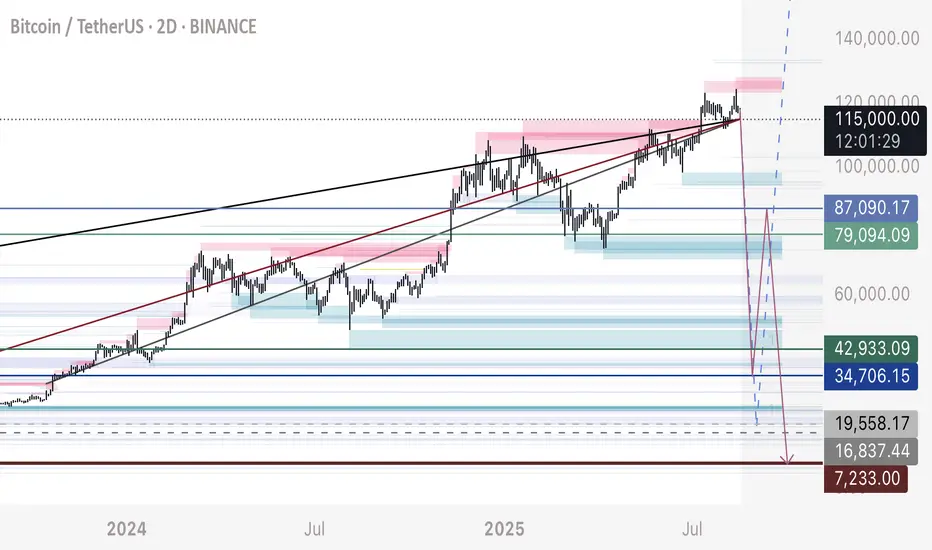
BTC - The Reason 8,000 is Possible There is already speculation and news coming out about plans of a large drop, and I imagine if this occurs there will be much hysteria and conspiracy about it.
Bitcoin is massively dominated by leverage trading. In fact, the majority of buys (or sells respectively) are leveraged.
Even Microstrategy for example, is leveraging its BTC to buy more BTC - and what happens when the value of the asset drops too low when leveraging is used? Well, we will find out. But normally this means bankruptcy / liquidation.
In futures trading, this is liquidation or stop losses being hit on those positions.
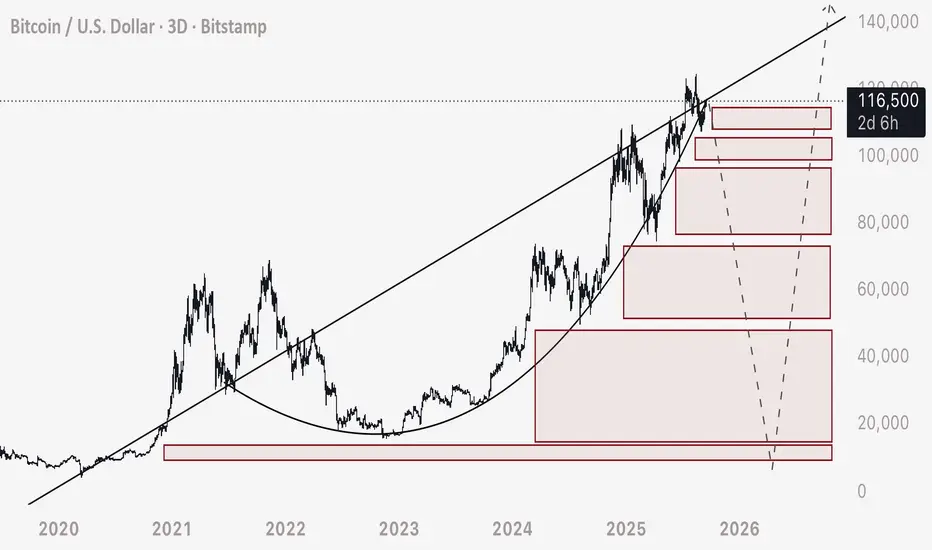
Since the price of BTC has been moving up, sideways, up, sideways, up, sideways - we could see for years the intentionality in this chart.
The market has been accumulating long positions / leveraged buys, holding the price up and continuing to attract money into the market cap (leveraged) and keep the orders in tact.
As a consequence, this leaves behind a trail, like a series of dominos, of leveraged sell orders.
These sell orders are in the form of long stop losses or liquidations. In essence, we have an explosive chain reaction ready to set off in the chart - an automatic, natural consequence to how the chart has been moving the last 2 years.
The argument may be that Bitcoins market cap is stabilized by a “floor”, possibly by ETF holdings, spot holdings, ETC - however, this is not the case. Many of these spot holdings themselves are leveraged with BTC to procure more BTC.
Even so, the vast majority of the market cap is market maker liquidity allowing retail traders to leverage trade the asset and other cryptocurrency - and the exchanges aren’t legislated to disclose where the stop losses are located or how much liquidity is contained here.
So if we think popular heat map and liquidation platforms are accurate, think again. The only way to really understand this, is to look at the price movement on HTF.
There are longs held since 12,000, and stop losses respectively held sub 10,000.
I suspect the true “floor price” of BTC is between 7,000 to 8,000 - that’s the total percentage of stable spot holding liquidity vs leveraged liquidity. Leveraged liquidity has no incentive to be stable, it moves in and out, market makers make their money via bankrupting / liquidating traders, or forcing them into stopped out positions.
For me, the last 1-2 years, this has never been an IF, but a WHEN. And WHEN this chain reaction occurs, those reading this can understand the reason is not a black swan (although that may serve as some initial excuse) - but rather a very natural phenomenon in a unique market that we mistakingly treat as a stable market that these events simple cannot happen in.
I’ll be very clear when I say - it’s possible BTC drops to 8,000, extremely fast, possibly in a matter of days or even hours, and quickly returns to ATH positions.
The real warning here I want to get across, is that a flash crash as I am describing, will only go so low as the stop loss orders are active. Ultimately there are no incentives or plans to destroy or bring BTC to zero.
When this flush happens, the big players (market makers) will be filling in the buy orders at those low prices with the liquidity returned from retail longs.
DO NOT SELL AT A MASSIVE LOSS. This is the biggest warning I have to get across with these posts, and would be the most devastating conclusion - believing BTC will go to nothing.
DXY is breaking down a major multi month bearish pattern and over the next 3-5 year period will be absorbing liquidity towards the lows. A falling dollar = bull market for BTC and equities.
This move up on BTC WAS NEVER A BULL MARKET - it was a bearish retest. This explains the erratic, up only nature of the move zoomed out - and all these justifications to explain that this is the “norm” it’s dangerous to traders. It’s not the norm of a bull market, it’s the norm of a bearish retest.
What do you do with this information?
If you are me, and by no means am I suggesting this, you can short the market and try to align yourselves with the big players.
If you’re a believer in the future of BTC, you can do nothing - not letting any fast drop or hysteria shake you or drive you to making an emotional decision to sell or change your mind.
This has never been a doom and gloom scenario for you all - it’s a reality check, a warning, and an opportunity to prepare yourselves for something you may not yet believe is possible unless you’ve been watching this market unfold since it’s very inception. In those cases, you will certainly remember flash crashes and stop hunts - and they have never changed, nor has the nature of the exchanges or market - it’s month more calculated now with big players invested in capitalizing to the fullest on the flaws of it all.
I wish you all the best.
Revealing the Masons' Secret Strategy for SHIB/USDTHey everyone! 🎉
Guess what? We’ve got some super exciting news for you today! 🎊 We’ve been working our magic behind the scenes, keeping our strategy a top-secret recipe 🍲, but now, it’s time to reveal a little bit of the Masons' magic 🧙♂️✨! And not just any Masons – we’re talking about the big Masons who control the world! 🌍🔮
Targets and Fun Stuff:
Current Price: SHIB is hanging out at around 0.00001705 USDT. 🤑
Support Levels:
Primary Support: 0.00001651 USDT – This is our cozy little safety net. 🛏️
Secondary Support: 0.00001540 USDT – Extra cushion just in case! 🛋️
Resistance Levels:
First Resistance: 0.00001718 USDT – First checkpoint, here we come! 🚀
Second Resistance: 0.00001850 USDT – Next stop, a bit higher! ⏫
Third Resistance: 0.00001904 USDT – Keep climbing! 🧗
Our Master Plan:
Initial Target: 0.00001718 USDT – Easy peasy, lemon squeezy! 🍋
Intermediate Target: 0.00001850 USDT – Let’s go higher! 🎈
Extended Target: 0.00001904 USDT – We’re on a roll! 🏄
Stop-Loss:
To keep things safe, we’ve got our stop-loss just below the primary support at 0.00001651 USDT. It’s like our trusty parachute 🪂 in case things go south!
Why the Secrecy?
We’ve been keeping our strategy under wraps because, well, where’s the fun in giving away all our secrets? 🤐 But now, it’s time to share the love and show you the power of the Masons' work! 🏰🔮
The Big Reveal:
So, get ready to witness some serious market magic. Whether you’re a seasoned trader or just dipping your toes in the crypto waters, we’ve got something exciting lined up for you! 🌊💸
Remember, we know what we’re doing, and we’re here to prove that a little bit of the Masons' magic goes a long way. Buckle up, enjoy the ride, and let’s make some gains together! 🚀💰
Stay awesome and happy trading! 😎✨
Your friendly neighborhood Masons 🧙♂️🧙♀️

Unveiling the Secret Masons' Trading Strategy for ANKR/USDT Hey everyone! 🎉
Guess what? We’ve got some super exciting news for you today! 🎊 We’ve been working our magic behind the scenes, keeping our strategy a top-secret recipe 🍲, but now, it’s time to reveal a little bit of the Masons' magic 🧙♂️✨! And not just any Masons – we’re talking about the big Masons who control the world! 🌍🔮
Targets and Fun Stuff:
Current Price: ANKR is hanging out at around 0.03069 USDT. 🤑
Support Levels:
Primary Support: 0.02787 USDT – This is our cozy little safety net. 🛏️
Secondary Support: 0.02220 USDT – Extra cushion just in case! 🛋️
Resistance Levels:
First Resistance: 0.03356 USDT – First checkpoint, here we come! 🚀
Second Resistance: 0.03894 USDT – Next stop, a bit higher! ⏫
Third Resistance: 0.04338 USDT – Keep climbing! 🧗
Fourth Resistance: 0.04995 USDT – Almost there! 🏁
Fifth Resistance: 0.05292 USDT – Boom, we’ve arrived! 🎯
Our Master Plan:
Initial Target: 0.03356 USDT – Easy peasy, lemon squeezy! 🍋
Intermediate Target: 0.03894 USDT – Let’s go higher! 🎈
Extended Target: 0.04338 USDT – We’re on a roll! 🏄
Ultimate Targets: 0.04995 USDT and 0.05292 USDT – Jackpot! 🎰
Stop-Loss:
To keep things safe, we’ve got our stop-loss just below the primary support at 0.02787 USDT. It’s like our trusty parachute 🪂 in case things go south!
Why the Secrecy?
We’ve been keeping our strategy under wraps because, well, where’s the fun in giving away all our secrets? 🤐 But now, it’s time to share the love and show you the power of the Masons' work! 🏰🔮
The Big Reveal:
So, get ready to witness some serious market magic. Whether you’re a seasoned trader or just dipping your toes in the crypto waters, we’ve got something exciting lined up for you! 🌊💸
Remember, we know what we’re doing, and we’re here to prove that a little bit of the Masons' magic goes a long way. Buckle up, enjoy the ride, and let’s make some gains together! 🚀💰
Stay awesome and happy trading! 😎✨
Your friendly neighborhood Masons 🧙♂️🧙♀️

Whales accumulate on the timid and the weak or just inexperienceWe see this quite often in BTC, Especially at ATH levels where inexperienced speculators flood into the space dreaming of bitcoin millions but really are not believers. Whales feed, normies Bleed might be a good Alternate title.
we continue to see resistance flipped support on an ATH, heavy action to get the Chart watchers who Zoom way in and watch charts on 1 and 5 minute intervals in awe of Bitcoins ability to gain 1000 dollars in value in what amounts to a trip to the fridge. These same people also panic buy rallys and panic sell reversals.
I cannot stress enough that if you are new to crypto, have some thoughts that it is a scam, that it is not a real world asset or any other doubt, but you cannot deny that people are making money and you like money too, right?
Right? Well, If you like money, why do you give it away?
Let me guess , I know the answer I think, it's simple isn't it.
You like money and you made a mistake, what are you doing messing with this crypto business anyway, you should have trusted your initial feelings of doubt and stayed far away and you just want out, if you've lost 30% and its only been a few hours you may as well count your blessings you've even got that left, better get out fast before Bitcoin goes into the negatives and your on the street eating from the trash. Right?
Hold on, Stop that thinking, you've fallen for the okie doak and are a mark, a sucker, rube, ok ok ok , that isn't productive but now that we've established that, what now?
Cash out, sell your electronics, move to a commune and worship the water nymph queen who above all things else is the true expression of feminine purity in a world controlled by the patriarch. Listen, I don't want to slap you and have no clue what any of that means, but let me tell you something. I was once you, well, almost, but in spirit, yes.
Until I learned "How to take BTC Whales to the ground with this one trick"
Yes, and its simple, Don't sell at a loss. Just don't
SCRT/USDT A Bullish journey? 👀 🚀SCRT Today analysis💎 Paradisers, take a look at #SCRTUSDT because it's been making some notable moves. It recently faced resistance at a high but now seems primed for a leap upwards after testing the trendline.
💎 Based on past behavior, #Secret faltered slightly at the $0.6392 level but now appears to be gathering momentum again, especially after bouncing off the trendline which it has respected well before. This suggests it might be gearing up to surpass its recent high.
💎 The price maintaining above its recent low point is encouraging for those betting on an increase. $SCRT might get a lift from the $0.4557 zone, though a drop below this could hint at a potential decline.
💎 For those of you considering getting in, particularly the newcomers, it's vital to keep a vigilant eye on market movements and proceed with caution.

BTC.USD Monthly VisionHello Guys. How are you today?
Let me say to Frankly, It's not financial advice.
that is just a Vision of the market. that's all.
*****************************
Today, I want to talk about Bitcoin in Monthly Time Frame.
as you see, I used the Fibonacci channel. I remove other levels except 0 - 0.5 - 1 - 1.5 - 2
I want to introduce you to 0 as a low of the first channel. (Black Line)
I want to introduce you to 0.5 as a Midline of the first channel. (Red Line)
I want to introduce you 1 as a Top of the first channel. (Black Line)
and so on.
*****************************
I changed the candle stick to a line chart.
So let's go into details.
I drew by Fibonacci Channel and you see two red circles (as support zone) these circles are reactions to the Fibonacci channel, I expect the price to touch again the Fibonacci Channel around 22500 USD and if we lose this zone,10500-11500 USD will be the next support zone.
And the 3rd Support zone will be the Blue circle zone.
So, please watch the market, there is no money in the market. The situation is so complicated.
I believe that we are in a recession and the U.S. government could NOT talk about the Recession because of China some reasons.
I bet we will touch the second support zone around 10500-11500 USD and maybe we will touch 4300 USD.
Who Knows!!!
Please don’t forget to write your comments ✍️✍️ Like 👍👍 and Share 👌👌 this Vision with your friends.
And Tell me do you agree with me or Not?
By the way, please draw this Fib Channel on your chart, and after that change the price from Line-chart to Candle-Stick.
You will see some amazing reactions. For example in Purple Circle 😜
Thank you so much in advance.
Wish you Health and Wealth.
Sincerely Yours
Ho3ein.mnD

#SCRT/USDT 1D (ByBit) Falling broadening wedge breakoutSecret Network is about to regain support, seems ready for short-term recovery towards 100EMA & 200MA resistances.
⚡️⚡️ #SCRT/USDT ⚡️⚡️
Exchanges: ByBit USDT
Signal Type: Regular (Long)
Leverage: Isolated (2.4X)
Amount: 5.0%
Current Price:
0.3480
Entry Zone:
0.3458 - 0.3218
Take-Profit Targets:
1) 0.3999
2) 0.4497
3) 0.4995
Stop Targets:
1) 0.2785
Published By: @Zblaba
$SCRT #SCRTUSDT #Secret #Privacy
Risk/Reward= 1:1.2 | 1:2.1 | 1:3.0
Expected Profit= +47.5% | +83.3% | +119.1%
Possible Loss= -39.8%
Estimated Gaintime= 1-2 months
scrt.network

BANDUSDT - big move incoming2-week chart looks very juicy, I have seen this RSI pattern many times before and I know what comes next. 10x long

Bitcoin longWe have buy limits order on 15k - 25k
Again we are targeting 220k by march or June 2022
But bitcoin in my view going soon to 36k areas ,
No one is selling BTC yet , they are all holding , but beyond the analysis, short secretly BTC to 48k , 36k , 25k
Or use buy limits on 18k - 25k
Sl :15k , you can buy with no SL wich i prefer if you are a believer then remove your SL and take the risk taking it from there with limits 👈
TP: 220k
It's not a signal as it's an idea which i am in it and felt i might share my position 😉
Good luck all

I want to say one Secret.Look this beautiful chart, nice structure long time.
Here time to buy a bag. :)
SLong

BARRISH STRUCTURE PATTERENS !!!!!!!Hello everyone, if you like the idea, do not forget to support it with a like and follow.
Through technical analysis, the market will be bearish if the coin has a week fundamental similar to **BTC.D **.Support and resistance levels come into play at this point.If the fundamental analysis reflects the reality of the market, the method has the potential to provide accuracy of up to 99 percent.
The research also indicates that a method known as barrish fakeout can be observed.
If you like my ideas then do support them with like and follow.
Also, share your views in the comment section.

Secret coin (SCRT) formed bullish Gartley for upto 168.50% pumpHi, friends hope you are well and welcome to the new update on Secret coin with Bitcoin pair.
Previously we caught a powerful pump of SCRT coin as below:
Now on a 4-hr time frame, SCRT has formed a bullish Gartley pattern. (Note: the C leg is not perfectly completed, but with BTC pair, SCRT has formed a perfect Gartley , therefore, for easy profit/loss calculations, I have ignored this C leg and shared the targets with US Dollar pair instead of with BTC pair).
Note: Above idea is for educational purpose only. It is advised to diversify and strictly follow the stop loss, and don't get stuck with trade

Classic bullish breakout on $SCRTI have had my eyes on Secret Network for quite some time now (for the strong fundamentals on almost everything built on top of Cosmos - $ATOM especially Secret) and $SCRT smashed through the triangle it was trading inside. I will be waiting for it to retest the broken trendline which I am certain it will bounce off of.
I will sell some of my bag at $2 for around 70% gain and leave the rest for long term hold.

SCRT continues to trade within the accumulation zoneThe SCRT USD pairing has settled nicely within the accumulation zone. We will monitor the volume and progress of SCRT and if it breaks the $2.00 mark on the daily time-frame and consolidates we could expect a run to the mid to high $3.00 area.
SLong

SCRT\USDT 👦ADAM AND EVE👧Hello friends👋
📈Long by 5% of the deposit
A rare Adam and Eve pattern formed on the 1d timeframe, the price broke through the horizontal resistance level, fixed and tested the level, a good point for a long position🙏

Secret coin (SCRT) formed bullish Gartley for upto 44.50 pumpHi, friends hope you are well and welcome to the new update on Secret coin with Bitcoin pair.
In the previous trade-setup, the priceline of SCRT was pumped but after a long spike on 4th March, it was dropped down.
Now on a daily time frame, SCRT has formed a bullish Gartley pattern.
Note: Above idea is for educational purpose only. It is advised to diversify and strictly follow the stop loss, and don't get stuck with trade
SLong

⚡️ #SCRT/USDT - SHORT - #SCALP ⚡️⚡️ #SCRT/USDT - SHORT - #SCALP ⚡️
Risk
- Medium
Entry Conditions:
-Flipped Key Support
- Flipped 20DEMA
- McFly Scalp Signal
- Rejection Candle
- General Bearish Market
News Source:
-
Entry: $
Take Profit 1: $
Take Profit 2: $
Stop-Loss: $
#SCALP
